Vestibular function in children
underperforming at school
Summary
Eloisa Sartori Franco1, Ivone Panhoca2
1 MSc in Speech and Hearing Therapy at PUC - SP. Professor at the Speech and Hearing Therapy Program at Universidade Metodista de Piracicaba - UNIMEP.
Audiolo-gy Internship Supervisor - UNIMEP.
2 PhD in Sciences at the Language Studies Institute at UNICAMP. Professor at the School of Speech and Hearing Therapy at PUC - Campinas. External accredited
advi-sor of the ’Child and Adolescent Health’ program, Department of Pediatrics, FCM/UNICAMP.
This study was done under the auspices of the Graduate Program on Children and Adolescent Health - Department of Pediatrics - FCM/UNICAMP. Field work was conducted at the School of Health Sciences - FACIS - Speech and Hearing Therapy Program - UNIMEP.
Send correspondence to: Eloisa Sartori Franco - R. Aldeia Campista 103 - Cond. San Conrado Sousas Campinas SP 13104-051. This paper was submitted to the RBORL-SGP (Publishing Manager System) on 25 June 2007. Code 4627.
The article was accepted on 21 October 2007.
L
earning is a complex, dynamic process, structured from motor and perception skills which, when cortically processed, give birth to cognition. Balance is a fundamental neurological function that helps us maintain proper postures, an essential factor in learning and a sign or neurologic maturity. Aim: this paper aims to study vestibular function in children underperforming at school. Study design: this is a cross-sectional study. Materials and method: eighty-eight children with ages ranging between 7 and 12 years attending the public schools of Piracicaba from 2004 to 2006 were enrolled. All children were interviewed, submitted to ENT examination, hearing tests, and vestibular examination.Results: fifty-one percent of the participants had no reported difficulties at school, whereas 49.0% were underperforming at school. Under vestibular examination, 73.3% of the children performing well at school had normal findings, whereas 32.6% of the underperforming children had normal test results. Unilateral and bilateral irritative peripheral vestibular alterations were found in 67.4% of the underperformers and in 26.7% of the children not experiencing difficulties at school. Conclusion: all vestibular alterations found had an irritative peripheral origin. There was a statistically significant association between vestibular alteration and poor performance at school.
Keywords: learning, labyrinthine disease, vertigo.
original article
INTRODUCTION
Learning is a complex, dynamic process, structured from motor and perception skills which, when cortically processed, give rise to cognition. Disorders in specific areas of the central nervous system connected to notions of bodily schemes, space, and time, constitute the neuropa-thologic basis for perceptomotor alterations and sensations disorders that may result in learning impairments1.
One-hundred and three children with and without learning disorders were enrolled in this study. Sixty (58.2%) children did not report learning disorders and 43 (41.7%) reported difficulties at school2.
Genetic factors, peripheral sensorial disease, neu-rogenic infirmities, diseases in general, social and cultural handicap, and learning disorders may negatively impact performance at school3.
Alterations in basic function integration, bodily sche-mes, spatial orientation, rhythm, fine motor coordination, laterality, analysis and synthesis functions, integration of parts into a whole, symbolization, language and its many aspects, impulse, attention and memory are neurogenic disorders that may produce learning impairment4.
Static balance is an important neurological function for the maintenance of postures adequate for learning. Dynamic balance is also an important evolutional function that provides insights on neurological maturity. Reports in the literature indicate that children with less developed function in this area have increased probability of having learning difficulties5.
The vestibular system, the proprioceptors, and the cerebellum are responsible for functions such as muscle tone, posture, balance, eye-motor coordination, and spatial orientation. This system seems to be largely involved in school learning processes6.
Narciso et al.7 looked at vestibular variations in
children and observed that 47% of the subjects had com-plaints related to performance at school. They found that vestibular disorders may be associated with learning and motor impairments.
According to Campos et al.8 infantile vestibular
disorder may considerably affect communication skills, psychological status, and performance at school. Low performance at school may also be indicative of labyrin-thine disease.
Caovilla et al.9 found that early identification of
infantile vestibular disease and etiologic treatment are of paramount importance in preventing the complications that frequently involve motor development and language acquisition. Vestibular tests should be done in every child suspected for vestibular disorder, although it is not easy to obtain precise accounts of the symptoms from the parents or the child.
Functional vestibular tests can be done through
electronystagmography and vectonystagmography. Digital vectonystagmography is one of the most widely employed tests in our practice to assess vestibular function, as it offers increased diagnostic sensitivity by measuring parameters connected to vestibular-eye-motor function and comparing stimuli to responses, apart from identifying the direction of the phenomena10.
Ganança et al.11 studied 30 children with poor
per-formance at school and found alterations under compute-rized nystagmography in 20.0% of the subjects.
According to Caovilla et al.12 the tests included in
digital vectonystagmography are eye-motor (eye motion, spontaneous and semi-spontaneous nystagmus, saccadic movement, and optokinetic nystagmus) and vestibular tests (rotational and thermal stimulation).
Abnormalities in voluntary saccadic control have been observed in many development disorders such as: dyslexia; learning impairments; attention deficit and hype-ractivity disorder13.
Eye motion patterns manifested during reading require alternation between saccade and fixation. It starts off with saccade covering 8 to 10 words combined with eye fixation and ends with prolonged saccade to restart reading another line14.
The saccadic pathway involves various regions of the cerebral cortex, cerebellum, and brainstem. Parameters such as latency, velocity, and accuracy of saccadic move-ments can be used to assess how effectively the central nervous system (CNS) manages rapid eye movement. Few CNS disorders remain undetected when latency, ve-locity, and accuracy of saccadic movement is rigorously measured10.
Vestibular alterations found in dyslexic children have led authors Frank and Levinson15 to postulate that
vestibular disorders and spontaneous nystagmus may in-terfere with sequential eye fixation required for reading.
Pendulum tracking is another type of eye motion that results from looking at a moving target used to assess the integrity of the eye-motor system in controlling slow eye motion, as they are affected by CNS and vestibular system disorders.
Following the teacher move around in the class-room, copying from the blackboard, reading, writing, and focusing require good eye-motor function and unaffected vestibular interconnections.
Optokinetic nystagmus is a rhythmic involuntary unconscious automatic ocular phenomenon. It may be reproduced when patients are asked to follow dots that move back and forth in opposite directions. It is an exte-roceptive response that compensates the movement of the environment through psycho-optical impulses. Optokinetic nystagmus may be altered in CNS syndromes and vesti-bular disorders10.
chil-dren with and without reading and writing impairment and found alterations in the vestibulo-ocular reflex in 20% of the subjects with poor performance at school, and that 7% of the children without impairments had vestibular alterations.
The rotational stimulation produced in the decre-asing rotational pendulum test allows the assessment of labyrinthine compensation status and its directional preponderance17.
Ayres18 looked at nystagmic movements in
post-rotational stimulation in children with learning impairments and saw reduced post-rotational nystagmus in 50% of the children with learning impairment and exacerbated post-rotational nystagmus in 13% of them.
Thermal stimulation done in caloric tests is the most sensitive of conventional vestibular tests done in patients without specific complaints or anomalies in other vestibular assessment steps.
Ganança et al.11 studied 30 children with poor
performance at school and found alterations under com-puterized nystagmography in 20.0% of the subjects, all in peripheral topographic diagnosis. According to the authors, most alterations were seen in the caloric test.
Ganança19 conducted a study with 64 children
affec-ted by language disorders without complaints of dizziness and found increased rates of vestibular alteration in the peripheral topographic diagnosis.
Relevant findings were observed in the studies by Franco and Caetanelli20. Computerized
vectonystagmogra-phy was performed in school-aged children and 20.7% of the subjects were found to have unilateral and bilateral peripheral irritative vestibular disorders.
Sensorial stimulation is fundamental for the develo-pment of language in children. When stimulated from an early age, children develop good coordination and focus. They also develop their creativity and self-confidence, and improve the chances of not having learning disorders.
This study aimed at analyzing vestibular function in school-aged children underperforming at school to better understand the triggering vestibular disorders and to consequently allow the development of future studies that address early intervention.
MATERIALS AND METHOD
Study type
This experimental study was approved by the Ethics Committee at our institution under permit 423/2003. It was conducted using the facilities and equipment of a clinic belonging to a university located in the countryside of São Paulo.
Case selection
The sample was taken from a group of children
aged between 7 and 12 years enrolled in public schools in the city of Piracicaba seen at the clinic between 2004 and 2006.
Two groups were assessed separately, one made up of children not reporting learning impairment and another containing children underperforming at school. The children were interviewed alongside their parents or caretakers before they were assigned to either of the groups. The following indicators, among others, were considered: inability to acquire new knowledge at the pace classmates do; not following in-class assignments; and information retention record.
One-hundred children accompanied by their parents or caretakers were invited to participate in the study. They were advised of their role in the study in the clinic.
An instructional meeting was carried out to provide participants with information and free informed consent forms. Testes with participants were scheduled after au-thorization was given by their parents or caretakers. All subjects agreed to participate and to have results divulged as set on Resolution 196/96.
- Inclusion criteria - group underperforming at scho-ol: the sample contained children complaining of low gra-des at school; their tone hearing thresholds between 500Hz and 8000Hz were equal to or under 15 dBHL21,22; type A
tympanometry and contralateral and ipsilateral acoustic reflexes present bilaterally at 500Hz and 4000Hz23.
- Inclusion criteria - group without learning impair-ment: the sample contained children that did not report any learning impairment; their tone hearing thresholds between 500Hz and 8000Hz were equal to or under 15 dBHL 21,22; type A tympanometry and contralateral and
ipsilateral acoustic reflexes present bilaterally at 500Hz and 4000Hz 23.
- Exclusion criteria - both groups: children under 7 and over 12, those reporting symptoms or hearing and visual disorders that could interfere with research findin-gs.
PROCEDURES
Interview:
All children and parents were interviewed with the purpose of gathering information on complaints of a vestibular origin, with emphasis on the presence or ab-sence or vertigo, exploring associated complaints, mainly those connected to hearing, neurovegetative symptoms, and neurologic cases suspected for involvement of the posterior fossa.
Otorhinolaryngological examination:
Audiological examination:
Audiological examination consisted of tone threshold audiometry done through air and bone con-duction when required, speech recognition tests, speech recognition threshold, and acoustic impedance tests as described by Mangabeira Albernaz et al.23. Speech and
tone audiometry tests were done in a soundproof booth and a MADSEN MIDIMATE 622 audiometer was used; for impedance tests we used a MADSEN ZO-72 device.
The criteria defined by Glorig and Davis21 and
Mangabeira Albernaz et al.22 were adopted to characterize
normal hearing patterns in various age groups and normal hearing thresholds.
Audiological test outcomes were used only as part of the inclusion criteria.
Vestibular examination:
The children submitted to vestibular examination were told to refrain from having coffee, tea, chocolate, and any labyrinth stimulating drug for 72 hours before the tests.
Vestibular tests were done as determined by Cao-villa et al.12 both in terms of sequence and test
interpreta-tion parameters. Vestibular test outcomes were interpreted as defined by Ganança et al.24.
Vectonystagmography was performed using a digital computerized vectonystagmograph (VECWIN) with three channels to acquire and record data, an EVR 03 visual stimulator, and an NGR 05 NEUROGRAFF ELETROMEDI-CINA LTDA ear air calorimeter.
All subjects were thus submitted to the following:
Nystagmus or position vertigo investigation According to the definitions set forth by Caovilla et al.12.
Eye movement biologic calibration
A visual stimulator was used to perform eye move-ment biologic calibration.
Spontaneous and semi-spontaneous nystagmus investigation
A visual stimulator (light bar) was used to perform spontaneous nystagmus investigation.
Saccadic movement investigation
A visual stimulator (light bar) was used to perform saccadic movement investigation.
Pendulum tracking investigation
A visual stimulator (light bar) was used to perform pendulum tracking investigation.
Optokinetic nystagmus investigation
A visual stimulator (light bar) was used to perform this investigation.
Peri-rotational nystagmus investigation
A YOSHI rotational pendulum chair was used in this test.
Post-caloric nystagmus investigation
An ear air calorimeter was used to investigate post-caloric nystagmus.
Assessment parameters
The analysis was performed as defined by Caovilla et al.12, to find data of interest for vestibular function
se-miology.
Analysis criteria:
Vestibular test interpretation was done according to the parameters defined by Ganança et al.24.
Statistical method:
The following tests were applied in the analysis of the vestibular test results, given the nature of the variables being analyzed:
• Parametric: Student’s t-test, controlled by Levene’s
test25, to compare the means between two analyzed variables;
• Non-parametric: Mann-Whitney’s test 26 to verify
associations between variables.
A confidence interval of 95% was used based on the mean and standard deviation values for the analyzed variables.
For all tests the level of hypothesis rejection and nullity was set at 0.05 or 5% and significant values were highlighted.
Program SPSS (Statistical Package for Social Scien-ces) release 13.0 was used to perform statistical calcula-tions.
RESULTS
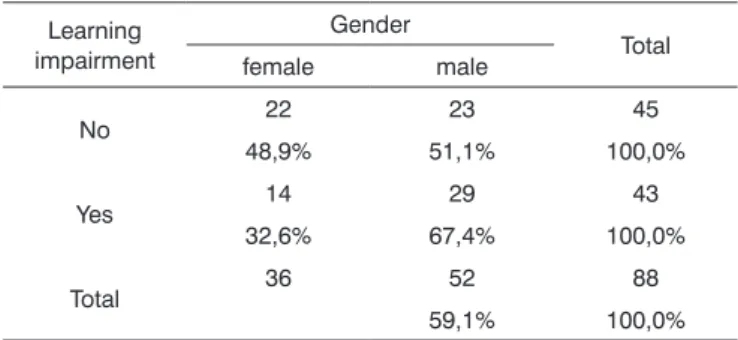
Table 1 shows the distribution of the sample in relation to gender and school performance.
Table 1. Sample distribution in relation to gender and school
perfor-mance (n=88).
Learning impairment
Gender
Total female male
No 22 23 45
48,9% 51,1% 100,0%
Yes 14 29 43
32,6% 67,4% 100,0%
Total 36 52 88
59,1% 100,0%
Table 2 shows the results of Student’s t-test con-trolled by Lavene’s test for Equality of Variances so as to check the possible differences between the means of parametric variables for eye-motor calibration parameters, namely latency, velocity, and accuracy.
Figure 2 features a box plot containing the statistical analysis for eye-motor calibration parameter velocity.
Table 2. Sample distribution in relation to eye-motor calibration
para-meters and school performance (n=88).
Variable Learning
impairment n Mean
Standard deviation
Signifi-cance (p)
latency_D_1 yes 43 157,00 81,68 0,531 no 45 147,31 90,25
velocity_D_1 yes 43 160,35 50,32 0,460 no 45 151,13 50,42
accuracy_D_1 yes 43 85,35 23,86 0,822 no 45 84,99 22,23
latency_E_1 yes 43 188,36 98,34 0,438 no 45 169,52 85,17
velocity_E_1 yes 43 143,84 51,52 0,515 no 45 151,05 53,64
accuracy_E_1 yes 43 87,18 17,95 0,796 no 45 88,03 15,10
a≤0,05
Figure 1 features a box plot containing the statistical analysis for eye-motor calibration parameter latency.
Figure 1. Box plot for right and left calibration eye-motor parameter
(latency) per group. (Student’s t-test controlled by Lavene’s test for Equality of Variances between the means of parametric variables of interest).
Figure 2. Box plot for right and left calibration eye-motor parameter
(velocity) per group. (Student’s t-test controlled by Lavene’s test for Equality of Variances between the means of parametric variables of interest).
Figure 3 features a box plot containing the statistical analysis for eye-motor calibration parameter accuracy.
Figure 3. Box plot for right and left calibration eye-motor parameter
(accuracy) per group. (Student’s t-test controlled by Lavene’s test for Equality of Variances between the means of parametric variables of interest).
parame-tric variables for saccadic movement eye-motor parameters latency, velocity, and accuracy.
Figure 5 features a box plot containing the statisti-cal analysis for saccadic movement eye-motor parameter velocity.
Table 3. Sample distribution in relation to eye-motor parameters of
saccadic movements and school performance (n=88).
Variable Learning
impairment n Mean
Standard deviation
Signifi-cance (p)
latency_D_2 yes 43 215,23 98,26 0,123 no 45 176,46 58,14
velocity_D_2 yes 43 101,74 29,19 0,481 no 45 98,88 43,87
accuracy_D_2 yes 43 95,84 25,37 0,043 * no 45 176,77 53,51
latency_E_2 yes 43 103,26 27,67 0,274 no 45 97,91 28,58
velocity_E_2 yes 43 108,55 33,14 0,105 no 45 176,77 53,51
accuracy_E_2 yes 43 103,26 27,67 0,274 no 45 98,40 27,41
a≤0,05
Figure 4 features a box plot containing the statisti-cal analysis for saccadic movement eye-motor parameter latency.
Figure 4. Box plot for right and left saccadic movement eye-motor
parameter (latency) per group. (Student’s t-test controlled by Lavene’s test for Equality of Variances between the means of parametric varia-bles of interest).
Figure 5. Box plot for right and left saccadic movement eye-motor
parameter (velocity) per group. (Student’s t-test controlled by Lavene’s test for Equality of Variances between the means of parametric varia-bles of interest).
Figure 6 features a box plot containing the statisti-cal analysis for saccadic movement eye-motor parameter accuracy.
Figure 6. Box plot for right and left saccadic movement eye-motor
Table 4 shows the results for Student’s t-test con-trolled by Levene’s test for Equality of Variances so as to check for possible differences between means of para-metric variables for gains in pendulum tracking at 20Hz, 40Hz, and 80Hz.
Figure 8 features a box plot containing the statistical analysis for nystagmus directional preponderance (NDP) in the optokinetic test.
Table 4. Sample in distribution in relation to pendulum tracking
gains and school performance (n=88).
Variable Learning
impairment n Mean
Standard deviation
Significan-ce (p)
gain_20Hz yes 43 0,91 0,36 0,786 no 45 0,85 0,25
gain_40Hz yes 43 1,01 0,21 0,695 no 45 0,98 0,22
gain_80Hz yes 43 0,86 0,23 0,404 no 45 0,82 0,19
a≤0,05
Figure 7 features a box plot containing the statistical analysis for gains in pendulum tracking at 20Hz, 40Hz, and 80Hz
Figure 7. Box plot for parameter gain in pendulum tracking at 20Hz,
40Hz, and 80Hz per group. (Student’s t-test controlled by Lavene’s test for Equality of Variances between the means of parametric variables of interest).
Table 5 shows the results for Student’s t-test con-trolled by Levene’s test for Equality of Variances so as to check for possible differences between means of parame-tric variables nystagmus directional preponderance (NDP) in the optokinetic test.
Table 5. Sample distribution in relation to nystagmus directional
preponderance (NDP) in the optokinetic test and school performan-ce (n=88).
Variable Learning
impairment n Mean
Standard deviation
Significance (p)
OPTO_PDN yes 43 6,20 4,55 0,486 no 45 6,05 5,29
VACL_D yes 43 11,34 2,04 0,075 no 45 10,55 2,37
VACL_E yes 43 10,92 2,01 0,486 no 45 10,54 2,22
a≤0,05
Figure 8. Box plot for nystagmus directional preponderance (NDP) in
optokinetic tests per group. (Student’s t-test controlled by Lavene’s test for Equality of Variances between the means of parametric variables of interest).
Table 6 shows the results for Student’s t-test control-led by Levene’s test for Equality of Variances so as to check for possible differences between means of nystagmus directional preponderance (NDP) in decreasing rotational pendulum test (DRPT) for lateral (NDP L), posterior (NDP P), and superior semicircular canals (NDP S).
Table 6. Sample distribution in relation to nystagmus directional pre-ponderance (NDP) in decreasing rotational pendulum tests (DRPT) and school performance.
Variable Learning
impairment n Mean
Standard deviation
Significance (p)
PDN_L yes 43 10,42 7,63 0,133 no 45 12,94 7,82
PDN_P yes 43 13,70 8,32 0,726 no 45 13,01 7,55
PDN_S yes 43 13,31 8,74 0,582 no 45 12,12 7,62
a≤0,05
Figure 9. features a box plot containing the statistical analysis for nystagmus directional preponderance (NDP) in the decreasing rota-tional pendulum test (DRPT) for lateral (NDP L), posterior (NDP P), and superior semicircular canals (NDP S).
Table 7. Sample distribution in relation to SCAV at 42ºC and 18ºC in
both ears and school performance (n=88).
Variable Learning
impairment n Mean
Standard deviation
Significance (p)
PC yes 43 23,34 13,30 0,012 * no 45 16,76 9,65
D_42 yes 43 11,00 7,04 0,478 no 45 8,81 3,04
E_42 yes 43 10,99 5,44 0,425 no 45 9,67 4,01
D_18 yes 43 20,02 10,29 0,012 * no 45 14,69 7,36
E_18 yes 43 17,66 12,13 0,031 * no 45 12,43 6,56
a≤0,05
Figure 10. Box plot for right and left caloric tests (CT) at 18ºC and 42ºC
per group. (Student’s t-test controlled by Lavene’s test for Equality of Variances between the means of parametric variables of interest).
Table 8. Distribution of final diagnosis as a function of school
perfor-mance (n=88).
Learning impairment
Final diagnosis Total
NVT PIVS SVPIB SVPID SVPIE
No 33 2 6 3 1 45
73,3% 4,4% 13,3% 6,7% 2,2% 100,0%
Yes 14 4 11 8 6 43
32,6% 9,3% 25,6% 18,6% 14,0% 100,0%
Total 47 6 17 11 7 88
53,4% 6,8% 19,3% 12,5% 8,0% 100,0%
p < 0,001 * Legend:
NVT = normal vestibular test;
PIVS = peripheral irritative vestibular syndrome;
BPIVS = bilateral peripheral irritative vestibular syndrome; RPIVS = right peripheral irritative vestibular syndrome; LPIVS = left peripheral irritative vestibular syndrome.
Table 7 shows the results for Student’s t-test con-trolled by Levene’s test for Equality of Variances so as to check for possible differences between means of para-metric variables for nystagmus slow component angular velocity (SCAV) in the caloric test, at 42ºC and 18ºC for both ears.
Figure 10 features a box plot containing the sta-tistical analysis for nystagmus slow component angular velocity (SCAV) in the caloric test at 42ºC and 18ºC for both ears.
DISCUSSION
In our results we could verify the distribution of the sample in percent terms of school performance in relation to gender. Some similarity was observed (p= 0.121) between the analyzed variables, and no signifi-cant differences were seen between genders.
Forty-five (51.0%) of the 88 children included in the study did not report any difficulties at school, whereas 43 (49.0%) were underperforming.
Similar findings were reported by Farias et al.2 in
a study that looked at 103 children with and without difficulties at school, 58.2% of whom did not report impairment and 41,7% did. Narciso et al.7 analyzed
ves-tibular disorders in children and saw that 47% of them complained of low performance at school.
The remarks made by Schachter et al.3 and
San-dler4 should be taken into account. In their studies they
found that learning can be affected by genetic factors, peripheral sensorial conditions, and neurogenic disea-ses, among others. Within neurogenic disorders lie the conditions involving basic functional integration of the bodily scheme and or spatial orientation.
According to Guardiola et al.5, static and
dyna-mic balance are important neurologic functions that enable children to adopt proper postures for learning. The authors claim that children with underdeveloped function in this area have an increased likelihood of experiencing learning difficulties.
Many are the contributions given by the studies done by Capovilla et al.6 and Campos et al.8 on the
as-sociations between the vestibular system and learning performance. Vestibular disorders in children may consi-derably impair their communication skills, psychological status, and school performance; the latter is a valuable indicative of labyrinthine disease.
According to Tuma et al.10, digital
vectonystagmo-graphy is one of the most widely employed methods to assess vestibular function, as it grants additional diagnostic sensitivity by allowing the measurement of parameters connected to vestibular and eye-motor function and comparison between stimuli and respon-ses, apart from identifying the direction in which such phenomena occur.
Our study found that the mean values associated with eye-motor parameters, both in the calibration of eye and saccadic movement, are within normal ranges for digital vectonystagmography according to Ganança et al.24 for latency, velocity, and accuracy. However, a
statistically significant association was observed in the mean values for accuracy (p=0.043) in saccadic mo-vement when comparing children underperforming at school to those doing well in class. Significance was
found in only one parameter to the right side.
Marchesin et al.13 reported anomalies in voluntary
saccade control in a wide variety of disorders such as dyslexia, learning disorders, and ADHD, thus supporting the compared data.
Our data sets seem to support the hypothesis postulated by Frank and Levinson15 in that vestibular
disorders may interfere with sequential eye fixation required for reading.
These concerns have guided studies such as the one by Horak et al.16 in which the vestibular function
of children with and without reading and writing di-sorders was analyzed. Altered vestibulo-ocular reflexes were found in 20% of the children underperforming at school. This adds to the findings reported by Hoyt14,
as eye movement required for reading alternates be-tween saccade movement and periods of fixation, thus requiring the integrity of the vestibular apparatus and of saccadic movements.
Our study showed that the mean values found in the caloric tests are within normal ranges for digital vectonystagmography as defined by Ganança et al.24 in
hot thermal stimulation (42ºC), for both children un-derperforming at school and those doing well in class. However, values above the normal ranges defined by Ganança et al.24 were found in cold thermal stimulation
(18ºC) of children underperforming at school, showing a statistically significant relationship between variables for both left and right stimulation (p= 0.031 and p=0.012 respectively).
Thermal stimulation is the most sensitive of the conventional vestibular tests. It allows the identifica-tion of vestibular disorders in patients without specific complaints and with normal results in other vestibular assessment steps.
The statement above was considered in the as-sumption that drove Ganança et al.11 to confirm that
the caloric test is the vestibular test that presents the greatest number of alterations.
When looking at nystagmus labyrinthine or di-rectional preponderance found in the caloric test, we observed a statistically significant association between variables when comparing children with and without learning impairment (p= 0.012). Our data sets show pe-ripheral vestibular disorder combined with labyrinthine excitation, leading to vestibular hyperactivity.
Ganança19 studied 64 children with language
di-sorders without complaints of dizziness and found high rates of vestibular disorders in peripheral topographic diagnosis.
vestibular test results (73.3%) among children doing well in class and lower rates (32.6%) among those with learning impairment. The identified vestibular disorders had both unilateral and bilateral irritative peripheral ori-gins, and involved 67.4% of the children with learning impairment and 26.7% of the children performing well at school. There was a statistically significant association between variables (p= 0.001).
Our results agree with the finding reported by Ganança et al.11 when they studied 30 children
complai-ning of learcomplai-ning impairment and found altered compu-terized nystagmography results in 20.0% of the children analyzed, all in peripheral topographic diagnosis.
Similar findings were reported by Franco and Caetanelli20. School-aged children underwent vestibular
examination through vectonystagmography and 20.7% of them had both unilateral and bilateral peripheral vestibular disorders.
Sensorial stimuli are fundamental for the develop-ment of learning skills in children. When stimulated from an early age, children will develop god coordination, focus, creativity, and self-confidence, thus minimizing the chances of experiencing learning impairments.
Considering the relevance of the relationship be-tween learning impairments and the vestibular system, further investigation must be conducted to confirm the findings reported in this study and to shed light on the ambiguities for which answers were not found.
In order for obscure aspects not to prevent pro-per intervention from being offered, more research and work on speech and hearing therapy is required.
CONCLUSION
Our study showed that the mean accuracy va-lues (in the assessment of saccadic movement) and the normal value thresholds in caloric tests specially under cold thermal stimulation (18ºC) were statistically significant in children complaining of learning impair-ment. A statistically significant relationship was also found for vestibular disorder and children affected by learning impairment. All found vestibular disorders are of a peripheral irritative origin.
REFERENCES
1. Rotta NT, Guardiola A. Distúrbios de aprendizagem. In: Diament A, Cypel S. Neurologia Infantil. 3.Ed. São Paulo: Ateneu, 1996.p. 1062-74
2. Farias LS, Toniolo IF, Coser PL. P300: avaliação eletrofisiológica da audição em crianças sem e com repetência escolar. Rev Bras Otorrinolaringol 2004;70(2):194-9.
3. Schachter DC, Pless IB, Bruck M. Self-report of family histories of learning difficulties. Can J Psychiatry 1992;37:29-32.
4. Sandler AD, Watson TE, Footo M, Levine MD, Coleman WL, Hooper SR. Neurodevelopmental study of writing disorders in middle childhood. J Dev Behav Pediatr 1992;13:17-23.
5. Guardiola A, Ferreira LTC, Rotta NT. Associação entre desem-penho das funções corticais e alfabetização em uma amostra de escolares de primeira série de Porto Alegre. Arq Neuropsiquiatr 1998;56(2):281-8.
6. Capovilla AGS, Miyamoto NT, Capovilla FC. Alterações de equi-líbrio e nistagmo pós-rotatório em crianças com dificuldades de leitura. Rev Fisioter Univ São Paulo 2003;10(2):61-9.
7. Narciso AR, Zeigelboim BS, Alvarenga KF, Jacob L, Costa Filho AO, Ribas A. Alterações vestibulares em crianças enxaquecosas. Arq Otorrinolaringol 2004;8(3):201-06.
8. Campos MI, Ganança FF, Caovilla HH, Ganança MM. Prevalência de sinais de disfunção vestibular em crianças com vertigem e/ ou outros tipos de tontura. RBM-ORL 1996;3(3):165-70.
9. Caovilla HH, Ganança MM, Munhoz MSL, Silva MLG, Ganança FF, Frazza MM. Vertigem paroxística benigna da infância. In: Silva MLG, Munhoz MSL, Ganança MM, Caovilla HH. Quadros clínicos otoneurológicos mais comuns. São Paulo: Atheneu; 2000.p.109-17.
10. Tuma VC, Ganança CF, Ganança MM, Caovilla HH. Avaliação oculomotora em pacientes com disfunção vestibular periférica. Rev Bras Otorrinolaringol 2006;72(3):407-13.
11. Ganança CF, Pupo AC, Caovilla HH, Ganança MM. Disfunção vestibular em crianças e adolescentes com mau rendimento escolar. Revista Fono Atual 2000;11:21-27.
12. Caovilla HH, Ganança MM, Munhoz MSL, Silva MLG. Equilibrio-metria Clínica. São Paulo: Atheneu; 1999.
13. Marchesin VC, Caovilla HH, Ganança MM. Dos movimentos oculares sacádicos em crianças com desordens do processamento auditivo. Acta ORL 2005;23(2):7-12.
14. Hoyt CS. - Visual training and reading. Am Orthopt J 1999;49:23-23.
15. Frank J, Levinson H. Dysmetric dyslexia and dyspraxia.J Am Acad Child Psychiatry 1973;12: 690-701.
16. Horak FG, Shumway-Cook A, Crowe TK, Black FO. Vestibular function and motor proficiency of children with impaired hearing, or with learning disability and motor impairment. Dev Med Child Neurol 1988;30: 64-79.
17. Ganança MM, Caovilla HH, Munhoz MSL, Silva MLG, Frazza MM. As etapas da equilibriometria. In: Caovilla HH, Ganança MM, Munhoz MSL, Silva MLG. Equilibriometria Clínica. São Paulo: Atheneu; 1999.p.68.
18. Ayres AJ. Learning disabilitiesand the vestibular system. J Learn Disabil 1978;11:30-41.
19. Ganança MM. Da vestibulometria em crianças com distúrbio de linguagem. [Tese de Doutorado] São Paulo: Universidade Federal de São Paulo - UNIFESP - EPM; 1989.
20. Franco ES, Caetanelli EB. Avaliação vestibular em crianças sem queixas auditivas e vestibulares, por meio da vectonistagmografia computadorizada. Arq Int Otorrinolaringol 2006;10(1):46-54. 21. Glorig A, Davis H. Age, noise and hearing loss. Ann Otol (St.
Louis) 1961;70:556-74.
23. Mangabeira Albernaz PL, Ganança MM, Caovilla HH, Ito YI, Novo NF, Juliano I. Aspectos Clínicos e Terapêuticos das Vertigens. Acta WHO 1986;5(Supl 2):49-109.
24. Ganança CF, Souza JAC, Segatin LA, Caovilla HH, Ganança MM. Limites de normalidade dos parâmetros de avaliação a vectonis-tagmografia digital neurograff. Acta AWHO 2000;2:105.
25. Vieira S. Bioestatística: tópicos avançados. Rio de Janeiro: Elsevier; 2004.