compounds and wire tapes
Conducted by:
Júlio Cardoso
Department of Materials and Manufacturing Technology
CHALMERS UNIVERSITY OF TECHNOLOGY
Göteborg, Sweden, 2009
Master Thesis No 12/2009
Performed at Swerea IVF, Göteborg
Examiner: Mikael Rigdahl
Department of Materials and Manufacturing Technology
Chalmers University of Technology
Supervisor: Annika Boss
Department of Polymeric Materials and Products
Swerea IVF
This diploma work was performed at Swerea IVF. This project has been a co-operation between Swerea IVF and Chalmers University of Technology. I am honored to express my deepest gratitude to my supervisor at Swerea IVF, Annika Boss, who gave me this precious chance to do my master´s project in Swerea IVF. Her patience, guidance and suggestions impressed me a lot. Also, I wish to extend my thanks to the whole staff at Swerea IVF for helping and supporting me through the project
Abstract
The participating companies in R&D programme Wire and Cable have expressed a great interest to increase the knowledge on how taping of automotive wires with different wire tapes affects the durability of wire insulations consisting of PVC and a halogen free polyethylene (PEHF) compound respectively.
In automotive harness wire tapes are wrapped around the wires in order to get the wires fixated. It is a well know problem in the automotive industry that the wire tapes have a negative influence on the PVC-wire insulations and decrease the service life of wires. This project was performed with the purpose to study the compatibility between wire-compounds and wire tapes. The study was not performed on real automotive wires, but on wire compounds that were extruded into bands. Two different commercial automotive wire compounds were selected: one PVC compound and one halogen free polyethylene (PEHF) compound.
These extruded bands were subjected to accelerated heat ageing in ovens at 125 °C with and without wire tape. The condition of the PVC and the PEHF bands were assessed by weight loss measurements, analyses with infrared (IR) spectroscopy, gas chromatography, thermal stability measurements and tensile testing.
The results of this project showed that all the samples tested had a large impact on the PVC-bands, the adhesives of the tapes accelerated the loss of plasticizer in the PVC by capturing plasticizer from the bands. The encapsulation of the PVC-bands with the tapes degraded the PVC. For the PEHF compound the acrylic adhesive of the tape captured a phenolic antioxidant which implies reduced thermal stability of the PEHF material. The migration of antioxidants out of the material will reduce the service life of the PEHF wires.
Table of Contents
1. Introduction ... 1
1.1. Objective... 1
1.2. Automotive Harness ... 1
1.3. Polyvinyl chloride (PVC) Wires... 3
1.4. Polyethylene Halogen Free (PEHF) Wires... 6
2. Methodology ... 8
2.1. Heat ageing ... 8
2.2. Fourier Transform Infrared Spectroscopy (FTIR)... 10
2.3. Gas Chromatography-Mass Spectrometry (GC-MS) ... 12
2.4. Tensile testing... 13
2.5. Thermal stability... 13
3. Experimental Performance ... 15
3.1. Material... 15
3.2. Sample preparation ... 16
3.3. Heat ageing in oven ... 18
3.4. Sample analysis ... 18 3.4.1. Weight loss ... 18 3.4.2. FTIR ... 19 3.4.3. GC-MS ... 23 3.4.4. Thermal stability ... 24 3.4.5. Tensile testing ... 27
4. Results and discussion... 28
4.1. PVC bands ... 28
4.1.1. Visual observation... 28
4.1.2. Weight loss ... 31
4.1.3. FTIR ... 33
4.1.4. GC-MS ... 38
4.1.5. Residual thermal stability of PVC bands ... 39
4.1.6. Tensile Testing ... 40
4.2. PEHF... 42
4.2.1. Visual observation... 42
4.2.5. Tensile testing ... 48 5. Conclusions ... 49 5.1. PVC bands ... 49 5.2. PEHF bands ... 50 6. Further research ... 50 7. References ... 51 8. Appendix ... 52 8.1. FTIR spectra ... 52 8.2. GC-MS Chromatograms... 58
List of Figures
Figure 1.1: Automotive harness.. ... 1
Figure 1.2: Un-aged PVC wires. ... 2
Figure 1.3: Chemical structure of trioctyltrimellitate (TOTM)... 4
Figure 2.1: Cell oven EB01 from Elastocon.. ... 9
Figure 2.2: Cabinet Oven ... 10
Figure 3.1: PVC band wrapped with tape A. ... 17
Figure 3.2: Dionex ASE 200 Accelerated solvent Extractor. ... 20
Figure 3.3: Perkin Elmer Spectrum One ... 21
Figure 3.4: Extracted samples prepared for the the GC-MS analyses... 23
Figure 3.5: GC-MS 6890 Hewlett Packard 5973N with MSD. ... 24
Figure 3.6: Thermal stability equipment ... 25
Figure 3.7: DSC Perkin Elmer 7.0 ... 26
Figure 3.8: OIT-measurement in DSC time-based thermogram. ... 26
Figure 3.9: Instron CRE ... 27
Figure 4.1: PVC bands aged without tape... 28
Figure 4.2: A-PVC band un-aged. B- PVC bands that were wrapped with tape A ... 29
Figure 4.3: A- PVC band un-aged. B- PVC bands that were wrapped with tape C. C- PVC band wrapped with tape C (4 week of ageing). ... 29
Figure 4.4: A-PVC band un-aged. B- PVC bands that were wrapped with tape B... 30
Figure 4.5: A-PVC band un-aged. B- PVC bands that were wrapped with tape A without adhesive. ... 30
Figure 4.6: PVC bands aged at 125°C, untapped and taped ... 32
Figure 4.7: Tapes that were in contact with PVC bands ... 32
Figure 4.8: IR-spectra for PVC (un-aged and aged 3 weeks with tape A) and spectra for extract from tape A (un-aged and aged 3 weeks on PVC bands)... 33
Figure 4.9: IR-spectra for PVC band (un-aged and aged 3 weeks with tape B) and extract from tape B (un-aged and aged 3 weeks on PVC-band). ... 34
Figure 4.10: IR-spectra for PVC band (un-aged and aged 3 weeks with tape C) and extract from tape C (un-aged and aged 3 weeks on PVC-band). ... 35
Figure 4.11: IR-spectrum for PVC-band ... 37
Figure 4.12: Relative concentration of plasticizer in the PVC bands. ... 37
Figure 4.13: Chromatogram for PVC-band aged with and without tape A. ... 39
Figure 4.14: Thermal stability on PVC bands that were aged with and without tape... 39
Figure 4.15: Strain at break for PVC bands ... 41
Figure 4.20: Weight changes for PEHF bands aged at 125°C, untaped and taped ... 44
Figure 4.21: Weight change for the tape that was in contact with the PEHF bands ... 45
Figure 4.22: FTIR-spectrum extract from the PEHF-bands (un-aged and aged 3 and 6 weeks with tape A) and from the tape A aged 3 weeks on PEHF-bands. ... 46
Figure 4.23: OIT for PEHF bands with and without tape. ... 47
Figure 4.24: Strain at break for PEHF bands ... 48
Figure 4.25: Stress at break for PEHF bands ... 48
Figure 8.1: FTIR-spectra from the PVC-bands (un-aged and aged 3/6 weeks without tape). . 52
Figure 8.2: FTIR-spectra from the PVC-bands (un-aged, aged 3 and 6 weeks with tape A without adhesive) and from the tape A without adhesive aged 3 weeks on PVC-band... 52
Figure 8.3: FTIR-spectra extract from the PEHF-bands (un-aged, aged 1 and 3 weeks with tape A) and from a phenolic antioxidant. ... 53
Figure 8.4: FTIR-spectra from the PEHF-bands un-aged and aged 3 weeks with tape A without adhesive... 53
Figure 8.5: FTIR-spectra extract from the PEHF-bands (un-aged and aged 3 weeks with tape A) and from the tape A aged 3 weeks on PEHF-bands... 54
Figure 8.6: FTIR-spectra extracts from the tape A (un-aged, aged 3 and 6 weeks on the PVC-bands). ... 54
Figure 8.7: FTIR-spectra extracts from the tape B (un-aged, aged 3 and 6 weeks on the PVC-bands). ... 55
Figure 8.8: FTIR-spectra extracts from the tape C (un-aged and aged 3 weeks on the PVC-bands). ... 55
Figure 8.9: ATR spectra for tape A (un-aged). ... 56
Figure 8.10: ATR spectra for tape B (un-aged). ... 56
Figure 8.11: ATR spectra for tape C (un-aged). ... 57
Figure 8.12: Chromatograms for PVC band un-aged and PVC-band aged 3 weeks without tape. ... 58
Figure 8.13: Chromatograms for PVC band aged 3 weeks without tape and PVC-band aged 3 weeks with tape A. ... 58
Figure 8.14: Chromatograms for PVC band aged 3 weeks without tape and PVC-band aged 3 weeks with tape B. ... 59
Figure 8.15: Chromatograms for PVC band aged 3 weeks without tape and PVC-band aged 3 weeks with tape C. ... 59
Figure 8.16: Chromatograms for PEHF band un-aged and PEHF-band aged 3 weeks without tape. ... 60
Figure 8.17: Chromatograms for PEHF band aged 3 weeks without tape and PEHF-band aged 3 weeks with tape A. ... 60 Figure 8.18: Chromatograms for tape A aged 3 weeks on PVC band and for tape A unaged. 61 Figure 8.19: Chromatograms for tape C aged 3 weeks on PVC band and for tape C unaged. 61 Figure 8.20: Chromatograms for tape B aged 3 weeks on PVC band and for tape B unaged. 62
1.
...
I
ntroduction
1.1.
Objective
The objective of this Master Thesis project is to increase the knowledge of how taping with different wire tapes affects the durability of wire insulations consisting of polyvinyl chloride (PVC) and a halogen free polyethylene (PEHF) compound respectively.
1.2.
Automotive Harness
Complete cable harness systems in cars consist of several harnesses assembled one by one at different points in the production flow, and connected together with intermediate connectors. Each harness contains different number of cables depending on the number of functions it shall realize, and also different types of electric boxes, containing electronics, fuses, relays, etc.
Harnesses are mainly built in a main cable stem with secondary branches. Depending on how the harnesses is routed and exposed to different surrounding environment, it needs to be protected and fixed in different ways. One of the different types of protections is the tape; in the automotive harness wire tapes are wrapped around the wires in order to get the wires fixated, see Figure 1.1.
The wrapping shall be performed in such a manner that the cable harness obtains the smallest possible diameter. Correct application of tape is obtained by stretching it 10-20 %. The winding shall be completed by winding the tape without stretching it over a length 2-4 times that of the tape width. This shall be done to secure the tape properly and to prevent so-called "flagging". When winding tape tightly, the correct procedure is to wind it so that it overlaps itself by at least 50 % of the tape width. [1]
Cables and wires are commonly used in long-term applications and are subjected to a wide range of temperatures and environments during service. The main materials in the complete harness design are different types of polymers / plastics.
Automotive industry has the experience that these wire tapes used for wires fixation have a negative impact on the wires. It might be chemical interactions between the tapes and the wire material but also physical mechanisms could influence the wires, like encapsulation of the wires. The influence of the tapes on these different polymers, especially at elevated temperatures, is investigated in this Master Thesis project "Compatibility of automotive wire compounds and wire tapes".
Polyvinyl chloride (PVC), polyethylene (PE), polypropylene (PP), olefin copolymers, thermoplastic elastomers and rubber are examples of polymers used in wire insulations. The most common polymer material in vehicle harness wires is PVC plasticized since it has good thermal stability. Halogen free compounds with PE or PP need to be filled with flame retardants. The PE compounds are limited in usage at high temperatures (PE becomes soft close to the melting temperature). In this project a PVC and a polyethylene compounds (PEHF) have been studied and these materials are briefly described below. Figure 1.2 shows two pieces of a PVC wires used in automotive harness.
1.3.
Polyvinyl chloride (PVC) Wires
Repeat unit of PVC:
Polyvinyl chloride is the material that is most used in wire and cable applications. Typical compounds contain from 50-60% PVC resin, with the balance in fillers, plasticizers, stabilizers and lubricants. Rigid PVC has a glass transition, Tg, at 80ºC and PVC containing
plasticizers are made to depress the Tg below the installations temperature. [2].
PVC is considered to be almost amorphous and has no melting point, Tm. PVC is used by
itself for primary insulation with good electrical properties, or more typically as a jacketing material over polyethylene materials in cases where the electrical resistance of PVC is inadequate.
Phthalates are widely used as general-purpose plasticizers because they offer the advantage of low cost and increased production efficiency. There are ester bonds in the phthalates that could be broken by hydrochloric acid and cause changes of the properties of PVC compounds during ageing [3].
Trimellitate plasticizers, Figure 1.3, have become the first choice for high temperature applications, such as for wiring that will be used in close proximity to vehicle engines. The extraction and migration resistance of these materials are significantly improved relative to the phthalates.
Figure 1.3: Chemical structure of trioctyltrimellitate (TOTM), a common trimillitate plasticizers. [4]
Phosphate ester plasticizers are used in certain demanding applications where flame-retardant and smoke-depressing properties are very important. PVC itself is normally enough flame resistent.
Polymeric plasticizers are ideal for use in cables where oil resistance is necessary or where plastics susceptible to stress cracking can make contact with the cable [6].
It is important to note that pure PVC is a very rigid and brittle material, which is why plasticizers are often added. When PVC is dissolved, plasticizers migrate into the solution. In such cases, the IR-spectrum shows the peaks from PVC mixed up with those from the plasticizer. Phthalates, e.g. dioctylphthalate (DOP), are frequently used as plasticizers.
Heat stabilisation in flexible PVC has historically been dependent on lead. Today there are several stabilised compounds without lead available. The use of calcium/zinc stabilizer systems has been common in PVC applications for over 20 years. Today the calcium/zinc stabiliser systems have successively been introduced in whole Europe and have been used in Sweden for about 10 years. These stabilizers are generally based on metal carboxylates and will sometimes incorporate other elements to boost the performance such as aluminium or magnesium. Because the heat stability in some applications may require some enhancement when using calcium/zinc, organic co-stabilisers will also often be added to this type of formulation. These materials include polyols, epoxydised soya bean oil, antioxidants and
organic phosphites [5]. As UV-stabiliser is it common to use titanium oxide (TiO2) and also
carbon black.
•
PVC degradation
PVC is degraded by dehydrochlorination, chain scission and crosslinking of macromolecules. The C-Cl bond is weaker than C-H and C-C which is the reason why the PVC degradation occurs due to dehydrochlorination. The main dehydrochlorination process of PVC degradation yields a corrosive gas, HCl, and leads to highly reactive polyenes absorbing light in the UV and visible region [3]. Furthermore, HCl does catalyse the degradation reaction.
Discoloration observed during PVC degradation is due to the formation of conjugated polyene sequences (>4 double bonds). Another phenomenon known in PVC degradation is chain scission and cross-linking. This step is likely to occur in presence of oxygen (autooxidation) or during the ultimate steps of thermal degradation, leading to a dramatic change in PVC mechanical and rheological properties of the polymer. The degradation rate for PVC is strongly influenced by structural defects concentration, HCl formation or any strong Lewis acid or base and oxygen-induced autooxidation.
Another degradation process is mass loss of the plasticizer, which occurs linearly with time when the rate is controlled by an evaporation process [8]. Diffusional desorption of the plasticizer is believed to be dominant process in ageing of plasticized PVC at low temperatures. For most applications, desorption or evaporation is believed to be the rate controlling factor, being dependant on the temperature and the vapour pressure over the surface of the material. The degradation of PVC is observed by that hydrochloric acid is set free or by discoloration.
1.4.
Polyethylene Halogen Free (PEHF) Wires
The use of polyethylene compounds in cables is growing. Most wire and cable products are compounded with additives such as heat and light stabilizers, slip agents, anti-blocks, flame-retardants, pigments, anti-static’s and carbon black.
Repeat unit of PEHF:
Phenolic antioxidants are the most common antioxidants used in polyolefins. They function as primary antioxidants and are often used in combination with secondary antioxidants. Phenolic antioxidants are effective during both processing and long-term heat ageing. Phosphites function as secondary antioxidants and often used in combination with a primary antioxidant. Organosulphuric compounds are well known as hydroperoxide decomposers and are often used in medium and high voltage cables.
Hindered Amine Light Stabilizers, HALS, are the most effective additives for light stabilization of polyolefins and are used as UV-stabilizers [9]. The antioxidants in common use for polyolefins are usually compounded in at 0.1-0.5% by weight levels [10].
•
PEHF degradation
The degradation of polyolefins takes place, under common environmental conditions such as elevated temperatures and UV-light, via free radical processes, commonly called autooxidation [11]. Autoxidation is initiated by heat, light (high energy radiation), mechanical stress, catalyst residues, or reaction with impurities. Free radicals are formed and react in the
presence of oxygen to form peroxy radicals, which further react with organic material leading to hydroperoxides (ROOH). Oxidation of polyethylene can result in crosslinking and/or molecular weight reduction consistent with chain scission. Carbonyl formation is common in degradation of high-density polyethylene. [10].
Thermal degradation of polymers occurs in an autocatalytic process, at lower temperatures, when oxygen is present in the environment. For most polymers in oxygen-containing environments, oxidation reactions are the dominant factor in ageing [12] [13]. It is an acceleration process. The hydroperoxide, ROOH, is decomposing by light, heat or metals (e.g. Cu, Cr, Co or Fe) and form two radicals. The metals need to be transitions metals. Aluminium does not decompose hydroperoxide.
Oxidizing polymeric material often have an induction period for aging, then they exhibit abrupt changes in both chemical (oxygen consumption rate, carbonyl index, weight loss, gel fraction) and mechanical (density, viscosity, elongation, tensile strength, impact index) properties leading to failure [12]. This induction period is generally a linear function of antioxidant concentration in polyolefins.
2.
Methodology
2.1.
Heat ageing
In order to study the compatibility of PVC bands and PEHF bands with different tapes it was necessary accelerate the chemical reactions underlying the polymer degradation by ageing at elevated temperature in ovens. One of the most influencing factors of the environment on a material or a component is the Temperature. Ageing affects not only the polymer but also the additives and their interaction with the polymer. It can render the material more sensible to further degradation.
The performance of the stabilizers depend on the temperature and this will influence the results from the accelerating ageing. Hindered amines give a long-term thermal stability (up to 140°C), hindered phenols aim for both long term thermal stability and melt processing stability (>150 °C), thiosynergists give a long-term thermal stability (up to 160°C) and phosphate, hydroxylamine and lactones give melt processing stability (>150 °C). In order to obtain reliable accelerated data, tests must be performed at temperatures not too far from those expected in the end-use application. This reduces the importance of any differences caused by the acceleration on changes in the morphology of the polymer, the diffusion rate of oxygen, and the consumption of stabilizers.
The main factors contributing to poor reproducibility when performing heat-ageing tests in ovens are air speed and temperature [14]. These two parameters should be taken into consideration when choosing oven for heat ageing. Three kinds of equipments can be used for heat ageing of polymers, namely cell ovens, cabinet ovens and oxygen or air bombs. The last one will not be considered here since ageing in oxygen bombs at high pressure does not give any possibility to do any correlation with natural ageing.
•
Cell Oven
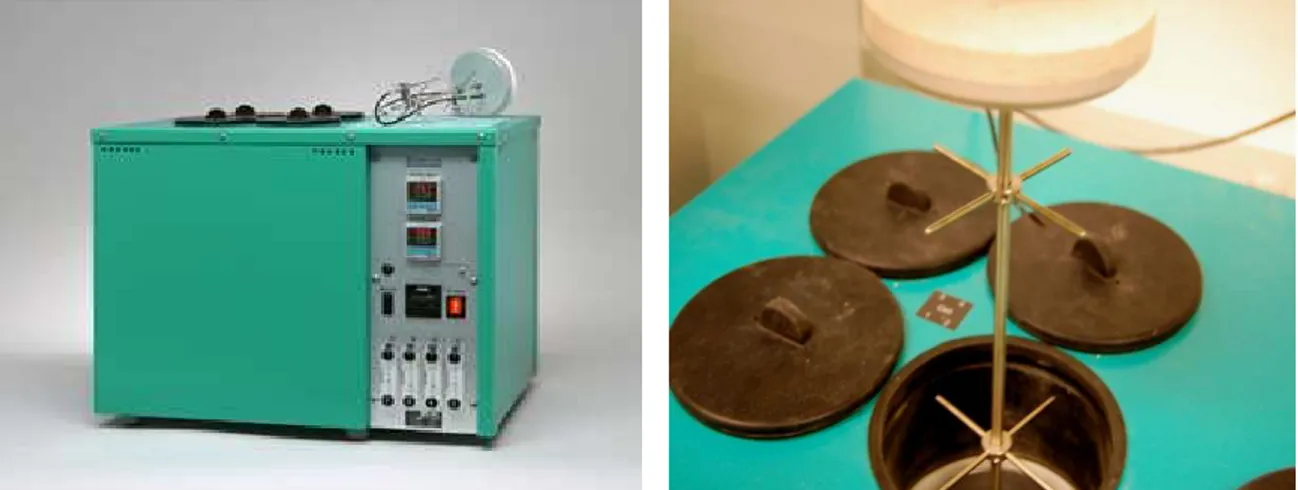
The cell oven is used for precision ageing of rubber and plastic materials. This type of oven gives a steady temperature by using a large block of aluminium with channels for preheating of the air, and separates the samples by using one cell for each material. The air is exchanged by using an air pump with a flow meter. The EB01 cell oven is equipped with four cells, each having separate control of the air-exchange rate, see Figure 2.1. [15]
Figure 2.1: To the left: Cell oven EB01 from Elastocon. To the right: 4 oven cells.
•
Cabinet Oven
The cabinet oven is a standard oven and is available with or without fan, Figure 2.2. The ovens without a fan normally can exhibit quite large variations of the temperature in space, up to 10°C is not unusual. This type of oven is often used by the cable industry since the standard, IEC 60811, states that no fan is allowed in the oven. To get an acceptable temperature tolerance of ±1°C the ovens are measured in order to find a usable area with this tolerance. Normally an area of a few liters is found in the middle of the ovens where the samples can be placed [14].
With increased air speed the oxidation will increase. In a cell oven flow is laminar and in a cabinet oven it is a mixture of laminar and turbulent flow. One should aim for the same air speed and air exchange as in real life. Most important is to have as controlled conditions as
possible. It is important to age only one material in same oven in order to avoid transportation of different materials.
Figure 2.2: Cabinet Oven
2.2.
Fourier Transform Infrared Spectroscopy (FTIR)
Infrared spectroscopy (IR) is an analytical method where functional groups and molecules can be detected. Infrared spectroscopy is one of the most used tools for identification and characterization of polymers. Molecules consist of atoms held together by valence forces. The atoms vibrate by thermal energy, giving every molecule a set of resonance vibrations. A test sample is irradiated with infrared light which excite molecules to higher vibrational energy levels and the detector collect the reflected light [16]. Therefore, the material absorbs infrared light at frequencies corresponding to the molecular modes of vibration, and a plot of transmitted radiation intensity versus frequency shows a spectrum of absorption bands (peaks). The nature of the absorption is related to the type of atoms present in the molecule and to their arrangement.
IR spectroscopy measures the vibrational energy levels of molecules and the characteristic band parameters measured are frequency (energy), intensity (polar character), band shape (environment of bonds).
The wave numbers of electromagnetic radiation that a molecule or group in a molecule can absorb are characteristic for that group or molecule. This is used to determine which molecules or groups are present in a sample by sending electromagnetic radiation of known
composition through the sample. Infrared rays have wavelengths in the range 1µm to 1000µm. They are expressed as wave numbers in cm-1 (the reciprocal of wave length in cm). This principle is used in Fourier Transform Infrared Spectroscopy, FTIR. [17]
In summary, IR spectroscopy is based on the fact that the rotation-vibration modes of chemical bonds give absorption at specific wavelengths in the infrared region. The wavelength at which the absorption maximum appears is furthermore dependent on the chemical species present in the vicinity of the bond considered. [7] A dispersive infrared spectrophotometer scans the compound by means of monochromator and gives the absorption for each wave number; as a result, so-called functional groups give rise to characteristic absorption patterns - IR spectrum. A spectrophotometer based on Fourier transformation determines the absorption for each wave number at the same time. Chemical entities such as sulphate, carbonate, phosphate, silicate and hydroxide groups are readily detected. [16]
It is possible to perform quantitative analyses with FTIR. The quantitative relation between the concentration, c, of a component in a sample and its absorbance, A, is given by the Bouguer – Beer law:
A = abc = log (I0/I) Equation 2.1
where I0/I is the transmittance, the constant a is the absorptivity, and b is the thickness of the
sample (path length). This law assumes photometric linearity and accuracy of the spectrometer. When two components are involved, absorbance measurements at two frequencies are necessary to estimate the relative concentration between the components. The concentration is proportional to the peak area and this area or the peak height can be used to calculate the relative concentration of two components. [17]
FTIR-analysis can be performed with different sampling techniques: Transmission analysis and reflection analysis techniques like total internal reflection diffuse reflection and ATR (Attenuated Total Reflection). The reflection technique enables samples to be examined directly on the surface without sample preparation.
2.3.
Gas Chromatography-Mass Spectrometry (GC-MS)
Gas chromatography with mass spectrometer is a complement to the FTIR analysis. The main purpose of this method is to separate different compounds and with a mass spectrometer identify the respective compounds.
Gas chromatography is one type of chromatography used in organic chemistry to separate components of a mixture. This technique involves a sample being vaporized and injected at the head of the chromatography column. In this kind of chromatography the sample is transported through the column by the moving phase that is carried by the flow of an inert gas. A small amount of the sample to be analyzed is drawn up into a syringe. In order to inject the sample, the syringe needle is placed into a hot injector port of the gas chromatograph. The injector is set to a higher temperature than the components’ boiling points. Therefore the components of the mixture inside the injector evaporate into the gas phase, usually an inert gas such as hydrogen, helium or an unreactive gas such as nitrogen. However helium has advantages when compared to the other ones. It is non-flammable, works with more number of detectors. Therefore, helium is the most common carrier gas used. The stationary phase is a microscopic layer of liquid or polymer on an inert solid support, inside a flexible silica tube called a column. The instrument used to perform gas chromatography is simply called gas chromatograph. [18]
The components reach a detector, when they move through the GC. Normally, the mixture of the components will reach the detector at different times due to differences in molecular size, structure and polarity of the compounds. A signal is sent to the detector, giving the results as a peak (on the computer). The number of molecules generating the signal is proportional to peak area. [19]
2.4.
Tensile testing
In order to measure the mechanical properties of the PVC and PEHF bands after ageing, tensile testing was performed. The equipment used for the tensile testing was Instron CRE. The tensile testing machine pulls the sample at both ends and measures how much the sample is stretched before breaking (strain at break) and the force per unit area (MPa) required to break a material (tensile strength at break or stress at break). [20]
2.5.
Thermal stability
Like many other intrinsic properties, the thermal stability of polymers is a function of their structure and that of any additives present. In the absence of any aggressive environment, thermal degradation occurs at elevated temperatures. The initial step in thermal degradation is the cleavage of the weakest bonds present in the polymer. The critical bond is the aliphatic CH, which permits a number of facile radical reactions that lead to cross-linking (occur in the amorphous phase and result in a more brittle material, but an increase in molecular weight) or chain degradation (result in a more brittle material and decrease in molecular weight) [21].
•
PVC bands
General descriptionPVC degrades by dehydrochlorination, which involves elimination of HCl from the polymer. The residual thermal stability of a PVC-material at elevated temperature is the induction time for formation of HCl (the time until formation of HCl starts). The thermal stability is proportional to the amount of active stabilizers in the material. Residual thermal stability was measured for the PVC bands, before and after ageing, with the different tapes in order to evaluate their effects on the thermal stability and the durability of the PVC-compound.
•
PEHF bands
General descriptionOIT, Oxidative Induction Time, can be measured for polyolefin materials such as polyethylene, polypropylene and polybutylene. The OIT was measured for the PEHF bands to evaluate the influence of the taping on the thermal stability. The DSC (Differential Scanning Calorimeter) was used to measure the Oxidative Induction Time. OIT, the induction time (beginning time) for oxidative degradation reactions is proportional to the amount of oxidative protecting antioxidants in the material tested.
3.
Experimental Performance
The experimental work in this project was performed as a model experiment since the experiments were not performed on real automotive wires but on wire compounds that were extruded into bands.
3.1.
Material
Two different commercial automotive wire compounds were selected: one PVC compound and one halogen free polyethylene (PEHF) compound. Both compounds are class III which means that they should withstand a temperature of 125 °C for long time. [19] The composition of the bands is shown in table 3.1.
Three different commercial wire tapes were selected: two class III tapes: A and C and one class II tape: B (is widely used in the wires even for the class III wires), the tape properties are given in table 3.2. The class II tape should withstand 105 °C for long time.
All the tapes are recommended and used for automotive PVC wires in cars and trucks. The tape C is recommended for PVC-wires for continuous use at 125 °C in the German automotive standard LV 112. Only the tape A is recommended for polyethylene wires. The tape A was thus used for taping of both the PVC bands and the PEHF bands, whereas the tapes C and B were used only with the PVC bands.
Table 3.1: Band composition
Bands Composition
PVC – Compound class III PVC, trimellitic ester, calcium carbonate, Ca/Zn stabilisers and phenolic antioxidants
PEHF – Compound class III PEHF, mineral filler, phenolic and amine antioxidants
Table 3.2: Tape composition
Tapes Composition
A Acrylic adhesive, PP-copolymer
B Synthetic rubber adhesive and acrylic
adhesive, polyolefin
C Acrylic adhesive, PVC-film
3.2.
Sample preparation
All samples were prepared as follows: cut 12 cm of length and 3,5 cm width from the extruded bands of PVC and PEHF compound, respectively. The thickness of the samples was approximately 35 mm. The sample dimension were important because of the limited space in the oven cells. It is important that the samples have enough space to hang freely in the oven cells.
With the PVC compound 120 samples were prepared because 3 samples were removed each week (one for visual and documentation, the second to measure the weight, for FTIR analysis and GC analysis respectively and the third for residual thermal stability tests). Furthermore 3 samples were prepared for tensile testing after 3 and 6 weeks of ageing.
With PEHF 37 samples were prepared, because 2 samples each week were removed for visual observation, OIT measurements, FTIR and GC-MS analysis. Furthermore 3 samples were prepared for tensile testing after 3 and 6 weeks of ageing.
After the samples had been cut and weighed, they were wrapped with the different tapes and then weighed again. The following different samples were prepared:
1. 24 samples for untaped PVC band;
2. 24 samples for PVC band wrapped with tape A; 3. 24 samples for PVC band wrapped with tape B; 4. 24 samples for PVC band wrapped with tape C;
5. 24 samples for PVC band wrapped with tape A without adhesive;
1. 15 samples untaped PEHF band;
2. 7 samples for PEHF band wrapped with tape A;
3. 15 samples for PEHF band wrapped with tape A without adhesive;
In order to remove the adhesive from the tape, tape A was put in glass flasks with 250 ml of acetone for a few minutes (5 min) and then put in an ultrasonic bath (to remove the adhesive) during almost 30 minutes (try to observe when the adhesive leave the tape, do not let pass so much time after this because properties will then be affected). The best way to fixate the bands with the tape without the adhesive was to use 2 glass plates and between these glass plates put the band with the tape on both sides. The glass plates were fixed with 4 clamps.
It was important to wrap the bands in such a way that the overlapping and any air bubbles were minimized. The best way is as shown in the Figure 3.1.
3.3.
Heat ageing in oven
The heat ageing in oven was performed at 125 °C; this temperature was selected since it is the maximum service temperature for class III wires and tapes. The untaped samples and the samples taped with A, B and C were aged in a Cell oven. All these samples were aged at 125°C ± 1°C. The ovens have four separate cells (4×2,4 dm3), one for each material. Every sample was hanging freely. The air exchange rate in the ovens was 14 changes per hour.
The samples taped without adhesive were aged in a Cabinet oven. The temperature in the oven was the same (125°C). The samples wrapped with tape A without adhesive could not be hanging freely in the oven. It is important not to forget that the air circulation may affect the results from the Cell oven and the Cabinet oven, but it was not possible to put all the samples in the same oven, as explain earlier.
3.4.
Sample analysis
The PVC and PEHF samples were subjected to several analyses. Measurements performed with the PVC bands and PEHF bands were weighing, FTIR and GC-MS analyses, tensile testing and thermal stability tests. For the tapes that have been wrapped around the bands: tapes A, B and C weight measurements were performed and after extraction, FTIR and GC-MS analyses were performed.
3.4.1. Weight loss
The weight loss was calculated by weighing all the samples before the ageing and after the ageing. Before the ageing, the samples were weighed before and after taping. After the ageing time, the samples were weighed with tape and after removing the tape. After removing the tapes from some samples (PVC band that were wrapped with A, B and C) it was necessary to remove the adhesive that remained on the bands with acetone, and after this the samples were
weighed. It is important to measure only the band (without tape and any adhesive left) in order to obtain the correct weight loss of the bands.
The weight loss of the bands was calculated as
Band weight loss (%) = 100
) ( ) ( ) ( × − unaged band m aged band m unaged band m Equation 3.1.
The weight loss of the tapes was calculated as
Tape weight loss (%) = 100
) ( ) ( ) ( × − unaged tape m aged tape m unaged tape m Equation 3.2.
3.4.2. FTIR
Fourier Transform Infrared Spectroscopy (FTIR) was used to analyse the chemical composition of the materials (bands and tapes). The aims of this analysis were to understand the migration of different compounds between the bands and tapes, such as migration of plasticizer, and chemical changes in the bands and the tapes (e. g. degradation of the compounds) and to find out the composition of the tapes.
•
Sample preparation
The PVC and PEHF bands was analysed with FTIR in the transmission mode. Pieces of 1x1 cm were cut out from the samples and pressed with a load of 15 tonnes at 180°C during 2 min into thin films. The films were then analysed in the transmission mode with a Perkin Elmer Spectrum One. The bands were analysed after 0, 1, 2, 3, 4, 5 and 6 weeks of ageing. Two samples from each week were analysed.
Extracts from the bands and from the tapes were also analysed. The aim of the extraction was to extract low molecular compounds, like plasticizer from the polymeric material, to be
analyzed with FTIR. The equipment used was a Dionex ASE 200 Accelerated solvent Extractor, see Figure 3.2.
Figure 3.2: Dionex ASE 200 Accelerated solvent Extractor.
Extracted material:
1. PVC bands un-aged;
2. PVC bands aged with tapes A, B and C tapes; 3. PEHF bands un-aged;
4. PEHF bands aged with tape A; 5. Tape A un-aged;
6. Tape B un-aged; 7. Tape C un-aged;
8. Tapes A,B and C aged with PVC bands; 9. Tape A with PEHF bands.
Approximately 0, 5 g of the material (PVC bands, PEHF bands and tapes) was cut out from each sample. The samples were extracted with a Dionex ASE system using solvents at high pressure and temperature in closed vessels. The samples were extracted with hexane at 120 °C and 13790 KPa. Two cycles of 15 min each were used and the total volume of the solvent was approximately 30 ml.
After the extraction, remaining tape material in the extract was filtered off and the hexane was evaporated in a rotational evaporator. The extracts with some solvent remaining was put on potassium bromide tablets. When the last solvent had evaporated, the FTIR analysis was performed on the tablets in transmission mode.
FTIR-ATR analyses were performed on the surface of the tapes, on both sides (the adhesive and the backing material respectively). A pressure was applied on the samples in order to have good contact.
Figure 3.3 shows the FTIR equipment used in this Master Thesis project. The instrument was set to 10 scans in the range from 400 to 4000 cm-1. After the measurement a transmission or reflection spectrum of the sample was obtained.
•
Analysis of the PVC
The analyses were performed on the bands, pressed into thin films, in the transmission mode. The relative loss of plasticizer was calculated. To follow the migration of plasticizer from the PVC-bands, the relative carbonyl content in the PVC bands was calculated using
R= HCarbonyl/HPVC Equation 3.3.
The height of the absorption band (peak) at 1726 cm-1 is assumed to be linearly related, according to Lamber-Beers low, to the concentration of carbonylic material (e.g. plasticizer) and the absorption band at 620 cm-1 to the concentration of PVC in the material. The absorption band at 1726 cm-1 is related to the vibration of the carbonyl group. The absorption band at 620 cm-1 is assigned to the vibration of the bonds between C and Cl in PVC.
Chemical changes of the material due to the ageing with different tapes were investigated, like e. g. degradation. The bands were also extracted in hexane and the extracts were analysed with the purpose to identify compounds that had migrated from the tapes to the bands.
•
Analysis of the PEHF bands
The analyses were performed on the bands, pressed into thin films, in the transmission mode. Chemical changes in the PEHF bands due to the ageing with tape were investigated, like migration of antioxidants. The bands were also extracted in hexane and the extracts were analysed with the purpose to identify compounds that migrates from the tape to the band.
•
Analysis of the tapes
The un-aged tapes were analysed with ATR (Attenuated Total Reflectance) on both sides, the adhesive side and the backing side, with the purpose to identify the composition of the tapes. The un-aged tapes and those aged on the bands were extracted in hexane and the extracts were analysed with the purpose to identify compounds that had migrated from the bands to the tapes.
3.4.3. GC-MS
The analyses were performed on extracts from bands and from tapes with the purpose to identify compounds migrating from the bands to the tapes and vice-versa. The extracts, see Figure 3.4 were transferred into Gas Chromatography (GC) sampling vials, an internal standard solution was added and the GC-MS analysis was performed.
Figure 3.4: Extracted samples prepared for the the GC-MS analyses.
The equipment used was a Gas Chromatography – Mass Spectrometer (GC-MS) 6890 Hewlett Packard 5973N with Mass Selective Device (MSD), quadrupole, see Figure 3.5. The Zebron 2B-5 Column (dimensions: 30 cm by 0, 25 mm) was a 5 % phenyl methyl siloxane column for MS and the carrier gas was helium. The injector temperature was 250 °C and the injection volume was 1µl. The flow rate was 1, 0 ml/min. The temperature of the GC was increased from 50 to 320 °C with a ramp of 15 %/min. The samples were injected with a splitless injector. Data was collected in a scan modem, scanning from mass 35 to 400. Collected mass spectra were compared with Nist library in the computer to identify the compounds. [19]
Figure 3.5: GC-MS 6890 Hewlett Packard 5973N with MSD.
3.4.4. Thermal stability
•
PVC
The residual thermal stability (time to onset of dehydrochlorination at 200 °C) is proportional to the amount of active stabilizer in the PVC. Hydrochloric acid is generated when PVC degrades and the stabilizers are then consumed.
The PVC bands were cut down into small pieces. Test tubes with approximately 3 mm diameter were filled up with material to a given level and the tubes were placed into an Al-block at 200ºC. Strips of universal indicator paper were inserted into the top of the tubes. The time for the pH indicating paper to change from a pH value of 5 to 3 is measured; this time is the time for the colour to change to red (onset of dehydrochloronation). An average value of the thermal stability time of at least two samples was calculated. The dehydrochlorination times at 200ºC for the heat aged samples, t, were compared to that of the unaged sample, t0.
Figure 3.6: Thermal stability equipment
The measurements were performed according to standard IEC 811-3-2.
•
PEHF
A Differential Scanning Calorimetry, Perkin Elmer 7.0 was used, see Figure 3.7 and the measurements were performed according to standard IEC 60811-4-2. The test temperature was 220 ºC, instead of 200 ºC as in standard due to the long oxidative induction time. The OIT was measured for the halogen free bands (PEHF) at 220 ºC in oxygen atmosphere. OIT (220 °C) is proportional to the amount of active phenolic antioxidants in the halogen-free material.
Figure 3.7: DSC Perkin Elmer 7.0
The material was cut into small pieces (2 or 3 mg/sample). The samples were put in aluminum pans and were heated in nitrogen atmosphere until the specified test temperature was reached. Once temperature equilibrium has been established, the purge gas was changed to oxygen. This change-over point to oxygen purge is considered as the zero time of the experiment (T0).
The isothermal measurement continued until the exothermal reaction started and OIT was calculated graphically from the thermogram as shown in Figure 3.8.
3.4.5. Tensile testing
Dumbbell samples were punched from the bands with the dimensions: width 4,0 mm, gauge length 10,0 mm and a thickness around 0,35 mm. During the test, the crosshead speed was 50,0 mm/min and the load cell used was 0,1 kN (maximum load). The tensile elongation was measured manually and strain at break as well as the tensile stress at break were calculated. Figure 3.9 shows the specimen (marked by the arrow) during testing and the machine Instron CRE used.
4.
Results and discussion
4.1.
PVC bands
4.1.1. Visual observation
Each week samples were removed and inspected for colour changes, stickiness of the bands, shrinking of the tapes, stiffness of the bands and other changes in the material properties.
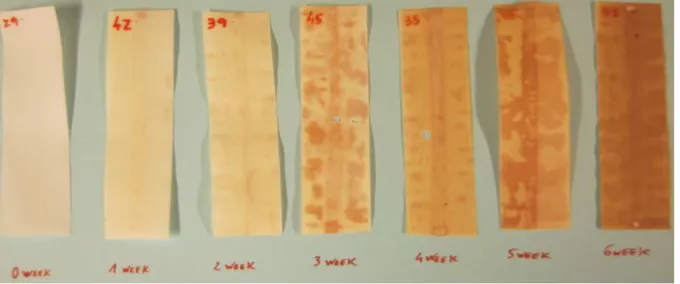
Figure 4.1 shows the colour change of the PVC bands with ageing time (1 to 6 weeks). As can be seen, the white PVC band become more and more yellow the longer the ageing proceeded. The colour change might be due to the additives in the PVC compound since it is known that some combinations of additives changes colour at high temperatures.
Figure 4.1: PVC bands aged without tape
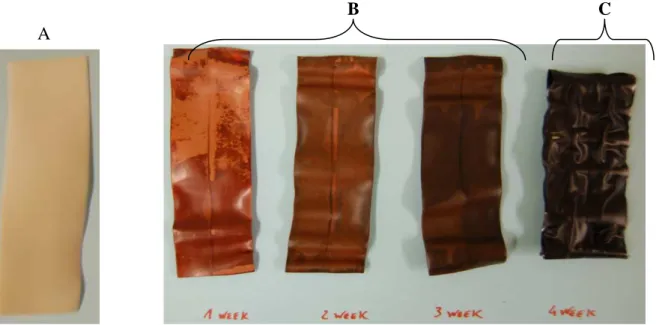
Figure 4.2 shows that the PVC bands that were wrapped with the tape A, changed colour during the first week of ageing (the PVC bands was white before the ageing and after the ageing wrapped with tape A the bands were light-brownish). During the 6 weeks of ageing the bands became darker and darker. The black line that appeared in the middle of the sample was
due to overlapping of the tape. The brownish colour could be due to degradation in the material.
Figure 4.2: A-PVC band un-aged. B- PVC bands that were wrapped with tape A
PVC bands that were wrapped with tape C (Figure 4.3.) were the samples that exhibited the most negative effect by the taping. After 3 weeks of ageing every band that had been wrapped with tape C were removed from the oven because for all of these samples the tape had shrunk a lot and the tapes were no longer in contact with the bands. As shown in Figure 4.3, the bands were dark brown. This indicates degradation of the material. The bands also became stiffer during the ageing.
Figure 4.3: A- PVC band un-aged. B- PVC bands that were wrapped with tape C.
C- PVC band wrapped with tape C (4 week of ageing).
B A
B A
For the first 2 weeks of ageing the PVC bands that were wrapped with tape B (Figure 4.4.) the colour did not change so much. But after this time of ageing, the samples got darker until the last week of ageing, then almost all samples were dark brown. It is interesting to see that with this tape after the first week of ageing the tape had shrunk and during all the last 5 weeks the tape was not in contact with the ends of the bands.
Figure 4.4: A-PVC band un-aged. B- PVC bands that were wrapped with tape B.
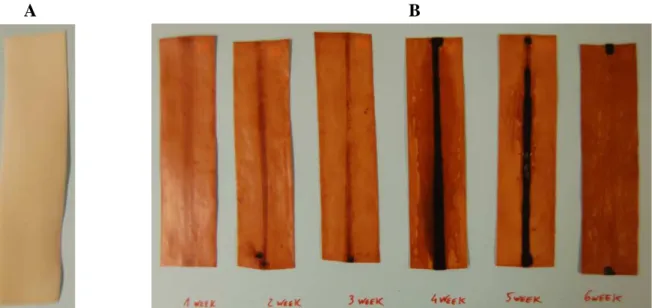
With tape A without the adhesive, Figure 4.5 shows that the PVC bands that were wrapped with this tape did not change colour very much during the first week of ageing. The tape did not shrink and the ageing did not much affect the stiffness of the bands. The black line that appeared in some samples was due to tape overlapping.
Figure 4.5: A-PVC band un-aged. B- PVC bands that were wrapped with tape A without adhesive.
B A
B A
All the taped bands (mainly with tape A) were very sticky after the tape had been removed showing that an amount of adhesive remained on the bands after the tape removal. But it is also probable that the stickiness came from plasticizer that had migrated to the surface of the band. High concentrations of plasticizer were found in the tape adhesives. Based on the colour changes, it is obvious that the taping strongly affected the ageing process of the PVC bands, for instance, compare Figure 4.2.B with Figure 4.1. The taped bands become brownish faster in the ageing experiment than the untaped samples.
The change in colour and brittleness shows that the taped bands started to degrade after a short time compared to the untapped bands. The increased stiffness of the bands aged with tape indicates loss of plasticizer from the bands.
4.1.2. Weight loss
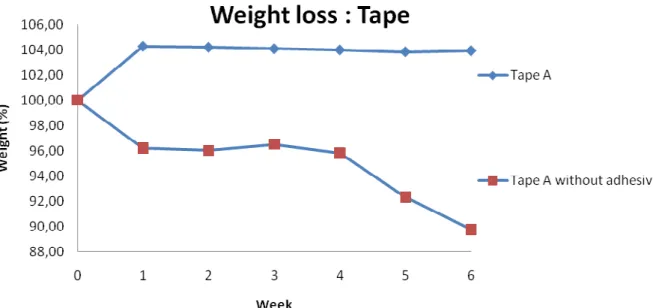
Figure 4.6 and 4.7 shows the weight loss of the PVC bands and the tapes, respectively, as a function of the ageing time at 125°C. It is easy to see that the PVC bands aged without tape lost almost nothing in weight. PVC bands aged with tape A without adhesive had a loss of more or less 4 % weight. Tape A is the tape that caused the largest weight loss in the bands, approximately 10 %. Bands aged with tape C had after 3 weeks of ageing lost 5 % of weight. All the samples aged with tape C were removed after 3 weeks of ageing because the tapes were no longer in contact with the PVC bands. For PVC bands aged with tape B, the weight had increased, something that was not expected. This shows that something migrates from the tape to the band.
All the bands that were taped in the ageing test (exception tape B) lost weight when compared to the untaped bands (that did not lose weight). The weight loss for the PVC bands aged with A and C might correspond to the loss of plasticizer from the PVC bands.
Figure 4.6: PVC bands aged at 125°C, untapped and taped. (STD less than 1,2)
Figure 4.7 shows the corresponding tape weight loss. The results confirm in a sense that the plasticizer migrated from the PVC band to the tape A. In contrast, for the tape B, it is easy to see that the weight loss was almost 15 %, showing that some compound migrated from the tape to the band. The tape A without adhesive did not change very much. This was also the case with tape C (after 3 weeks).
4.1.3. FTIR
The compounds identified with FTIR are not documented in detail in this report, only the family names of the compounds are documented. This project has also been limited by not having full information about the wire compounds and the tapes used.
The FTIR-spectrum shows absorption bands, “peaks” that corresponds to the molecule groups in the material. The FTIR spectra were measured in the transmission mode which implies that the IR-absorption bands, “peaks”, are directed downwards.
After ageing and removing of all the different kinds of tapes from the PVC bands, samples from the bands were analysed with FTIR. Figure 4.8 shows FTIR-spectra of PVC-bands, un-aged and un-aged with tape A, it also shows spectra of the extract from the tape A, un-un-aged and aged on the PVC-bands.
Figure 4.8: IR-spectra for PVC (un-aged and aged 3 weeks with tape A) and spectra for extract from tape A (un-aged and aged 3 weeks on PVC bands).
A peak denoted by A appeared in the tape A-spectrum after 3 weeks of ageing in contact with the band, see Figure 4.8. This peak corresponds most probably to a phenolic compound and might be phenolic antioxidants that migrate from the band to the tape. The tape A un-aged did not show this peak. The notation B indicates two typical plasticizer (trimillitate) peaks. This confirms the migration of plasticizer from the bands to the tape A. Also some plasticizer in the tape A migrated to the PVC-band. FTIR-spectra from other samples and results (not included in the result part) can be found in Appendix 8.1.
The FTIR analyses showed that the weight losses that were explained before were related to the migration of certain compounds. Some compounds migrated from the PVC bands to the tapes, and some other from the tapes to the bands. In case of tape B it is clear that some compound/compounds migrated from the tape to the band. Figure 4.9 shows a peak in the spectrum for the PVC-band that increased with ageing time at 3544 cm-1 (hydroxylic compound, OH-bonding) and a carbonyl peak at 1720-1730 cm-1 that became broader.
Figure 4.9: IR-spectra for PVC band (un-aged and aged 3 weeks with tape B) and extract from tape B (un-aged and aged 3 weeks on PVC-band).
The peak in the spectrum for the un-aged tape at 3544 cm-1 decreased significantly after 3 weeks of ageing, and since the same peak increased in the PVC-band we conclude that it is related to migration from the tape to the band. The carbonyl peak 1720 -1730 cm-1 also became broader in the aged band. It is probably due to a plasticizer in the tape that had migrated. It might also be due to degradation of the PVC-band after 3 weeks ageing, which influenced the spectrum as an increase of the carbonyl peak.
Figure 4.10: IR-spectra for PVC band (un-aged and aged 3 weeks with tape C) and extract from tape C (un-aged and aged 3 weeks on PVC-band).
The peaks in the spectrum became broader on PVC-band aged 3 weeks with tape C, probably due to degradation, Figure 4.10. It is important to see, that the marked peaks at 1610 and 1575 cm-1 in the FTIR-spectrum for the tape C aged 3 weeks, appeared after ageing on the PVC-band, indicating that plasticizer has migrated from the band to the tape.
All the tapes aged on PVC-bands contained trimillitate plasticizer and the plasticizer migrated from the PVC bands to the tapes, see FTIR-spectra in Appendix 8.1 (specific plasticizer peaks at 1610 and 1575 cm-1 in the tape after ageing). Since the weight loss for the bands aged with tape without adhesive was very low only small amounts of plasticizer has migrated in that case.
The PVC tape can also produce HCl which can accelerate the degradation of both the bands and the tapes. FTIR-measurements indicated that the PVC-band was somewhat degraded already after 1 week with the tape C and after 3 weeks it was heavily degraded. Broad peaks (absorption bands) that indicates degradation in the FTIR-spectrum are those at 1700-1740 cm-1, 1700-1800 cm-1 and 3200-3600 cm-1. These peaks show that the polymer contained acid and strong polar hydrogen bonds (OH, COOH, HCl) - degradation products. The loss in residual thermal stability was also large for bands aged with tape C supporting the degradation hypothesis. The tape C is apparently less degraded than the PVC bands after ageing. It seems not good to use this PVC-containing tape on the PVC-bands.
After analysing all the spectra, it was possible to see that all the PVC bands that were wrapped with tapes started to degrade in some respects after 3 week of ageing.
In order to analyze the relative loss of plasticizer from the PVC-bands, the area and the height of the peaks corresponding to plasticizer and PVC were evaluated.
1) Plasticizer peak (carbonyl group) ≈ 1726 cm-1
2) PVC peak (C-Cl bonds) ≈ 620 cm-1
The relative loss was evaluated by dividing the peak area of carbonyl group by the peak area of PVC. The values obtained for the areas of the peaks were not satisfying due to degradation processes. Instead the relative concentration was calculated by using the heights of peaks instead of the areas (in order to get more reliable results). This calculation was done dividing the height peak of carbonyl (peak at 1726 cm-1) by the height peak of PVC (approximately at 620 cm-1), see Figure 4.11.
Figure 4.11: IR-spectrum for PVC-band
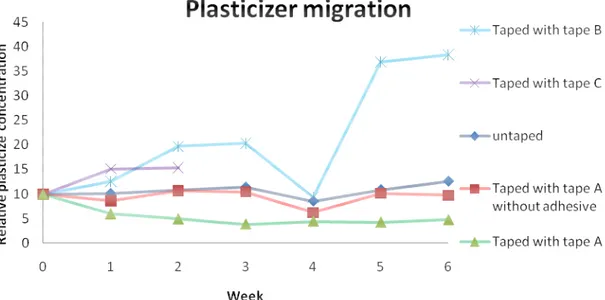
Figure 4.12 shows the approximate relative concentration of plasticizer in the PVC bands as a function of the ageing time.
Figure 4.12: Relative concentration of plasticizer in the PVC bands.
This calculation is not very reliable due to degradation after 2 weeks and it might also be possible that other compounds contain carbonyl groups, but the majority stems probably from the plasticizer. As we previously saw, plasticizers possibly also came from the tapes. It was confirmed that some plasticizers migrated from tape B to the band. In the bands that were wrapped with tape A, plasticizer has migrated from the PVC band to the tape (also confirmed by the weight loss graph, the weight of these bands also decreased with ageing time). For the
PVC bands without tape and bands taped without adhesive only small amounts of plasticizer migrated (almost no weight loss).
Tape C lost plasticizer and had therefore shrunk and became stiff, see Appendix 8.1. After analysing the tape C with FTIR it is possible to say that the tape contained PVC and phthalate plasticizer. This explains the shrinking and stiffness of the tape C after ageing on the PVC bands since the plasticizer migrated from the tape and also possibly evaporated to the air.
All the tapes had acrylic adhesives, but the composition was not the same. The polar molecules in the acrylic adhesives possibly “solve” the polar plasticizer in the PVC-bands and makes the plasticizer migrate over to the tapes. On the other hand, polar compounds like plasticizers in the tape backing material can also migrate to the adhesive. This was the case for the tape B and for the tape A for which plasticizers migrated over to the PVC-bands, transported by the adhesive.
4.1.4. GC-MS
The Gas Chromatography with Mass Spectrometer detector is a complement to the FTIR-analysis. With this method it is possible to separate different compounds and after with MS identify the compounds that had been separated with the GC. All analyses were performed on extract from the bands and the tapes respectively.
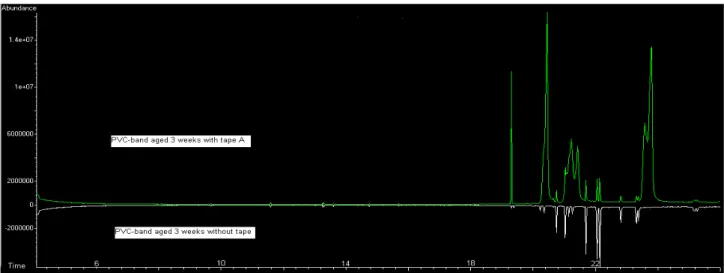
Figure 4.13 shows the chromatogram obtained for the PVC band without tape and for the PVC band aged with tape A after 3 weeks of ageing, in order to compare and to identify the migration of the compounds.
Figure 4.13: Chromatogram for PVC-band aged with and without tape A.
After analysing all the chromatograms (the chromatograms of the samples are in Appendix 8.2), it was possible to see compounds formed by degradation in the bands aged with tapes A, B and C. Also degradation compounds were found in the tapes A and C aged on the PVC-bands, but not in tape B. Phthalate plasticizers were found in the bands aged with tape B and C.
4.1.5.
Residual thermal stability of PVC bands
The residual thermal stability of taped and untaped PVC bands after ageing in oven is shown in Figure 4.14.
The decrease for the PVC band aged untaped is considered a normal ageing result. The loss of thermal stability was much faster for the taped bands than for the untaped bands. It is obvious that the taping of the PVC wires had a significant impact on the insulation material.
For the bands taped with tape A, B and A without adhesive the residual thermal stability decreased in a similar way. The bands that had been taped had no residual thermal stability left after 5 weeks of ageing, but the bands taped with the tape C had no residual thermal stability after 2 weeks. The material was already degraded. This decrease in the thermal stability indicates that the stabilizer had been consumed or inactivated. It is clear that the tape C had the most negative effect on the PVC bands. The taping accelerated the degradation of the PVC bands.
The main reason for these results might be encapsulation of the bands which prevented hydrochoridric acid from evaporating. HCl will then be concentrated in the bands (mostly on the surface) accelerating further degradation of the PVC bands since it cannot evaporate easily to the air from the PVC bands being covered by the tape.
The tape adhesive seems to be less important with regard to the thermal stability of the PVC bands since the tape A with and without adhesive had a similar affect on the thermal stability, the main problem as said before seems to be the encapsulation.
4.1.6. Tensile Testing
The tensile testing aimed at measuring the change in mechanical properties with ageing time. The results documented in these tests were the tensile stress at break and the strain at break. The strain at break corresponds to the elongation of the sample when breaking; this value is given in per cent. The stress at break corresponds to the force per unit area used until breaking the sample.
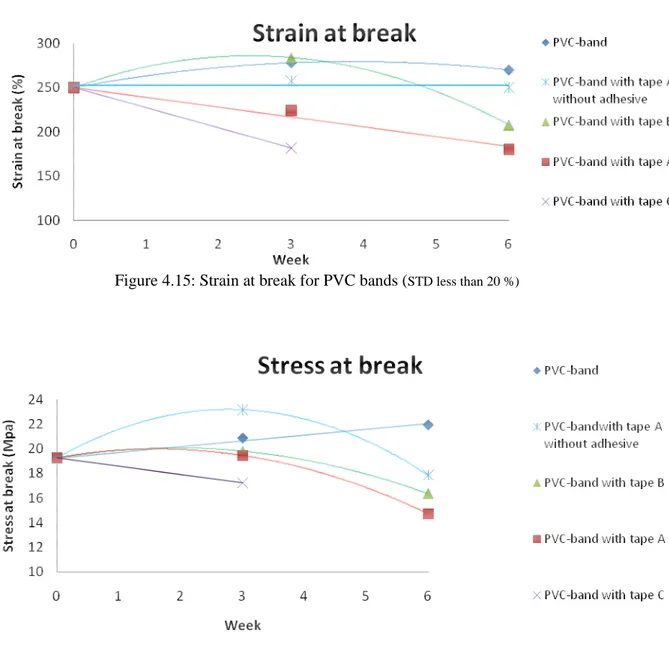
Figure 4.15: Strain at break for PVC bands (STD less than 20 %)
Figure 4.16: Stress at break for PVC bands (STD less than 1,9 MPa) as a function of the ageing time.
Figure 4.15 shows the strain at break for all the samples as a function of the ageing time. For the bands that were wrapped with the tapes A and C, the strain at break had decreased almost 60 % after 6 and 3 weeks, respectively, mainly due to degradation and loss of plasticizer. The increase in strain at break and stress at break for the untaped band and initially also for the bands taped with tape B (refers to the strain at break), see Figures 4.15 and 4.16, was not excepted but might be due to cross-linking. The strain at break for the PVC bands that were wrapped with tape A without adhesive was not significantly affected by the ageing.
4.2.
PEHF
4.2.1. Visual observation
As for the PVC samples, it was important to assess changes in the material, like colour change, brittleness, stiffness and sticky adhesive from the tapes among others, also for the PEHF samples.
Figure 4.17 shows the PEHF bands aged without tape. The colour changed apparently almost not at all during the ageing test. Comparing the unaged sample with the sample after 6 weeks of ageing, there is almost no difference in colour or in stiffness of the bands.
F igure 4.17: PEHF bands ageing without tape
The same behavior was noted for the samples aged with tape A, the colour changed almost not at all, see Figure 4.18. After removing the tape, all the bands did not have any sticky adhesive on their surface; the adhesive still remained on the tapes. The tape in this case, seemed not to have any negative effect (looking only for colour changes).
Figure 4.18: PEHF bands that were wrapped with tape A.
(A sample has been taken from sample 17 for FTIR analysis).
For the PEHF bands that were wrapped with tape A without adhesive (Figure 4.19.), it is possible to see that after 2 weeks of ageing the samples became more brownish. After 6 weeks almost all the bands were brown. The probable explanation is that the tape was affected by the acetone (used to remove the adhesive). This discoloration came perhaps from the tape.
Figure 4.19: PEHF bands that were wrapped with tape A without adhesive.
4.2.2. Weight loss
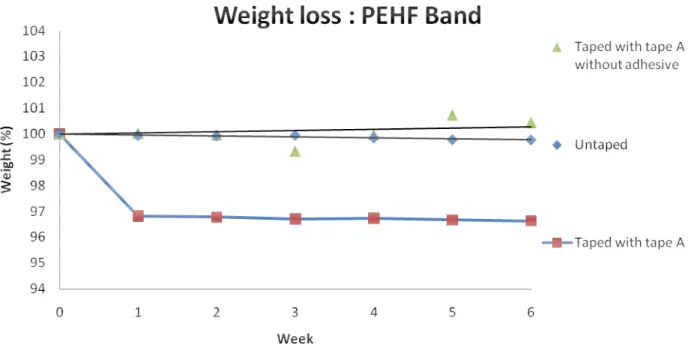
The weight loss for the PEHF bands was calculated in the same way as for the PVC samples. The weight loss is shown for the PEHF bands in Figure 4.20.
Figure 4.20: Weight changes for PEHF bands aged at 125°C, untaped and taped (STD less than 0,74 %)
The PEHF bands that were wrapped with tape A, exhibited a weight loss of approximately 3 %, which corresponds with migration of some compounds from the bands to the tape. It is possible that antioxidants or other compounds with a low molecular weight migrated to the tape. For the bands without tape and bands with tape A without adhesive, the weight stayed almost constant during the entire ageing test.
Figure 4.21: Weight change for the tape that was in contact with the PEHF bands (STD less than 1,4 %)
This result confirmed that something migrated to the tape. The tape A increased almost 4 % in weight during the first week of ageing, indicating migration from the band (weight decrease 3 %) to the tape. After the first week the weight stayed constant. The possible explanation for the weight loss of tape A without adhesive might be the acetone (used in the beginning to remove the adhesive from the tape) that has affected the tape properties or some remaining adhesive.
4.2.3. FTIR
The same procedure was applied to the PEHF bands as for the PVC bands. Figure 4.22 shows FTIR spectra obtained for the unaged PEHF band and for the PEHF aged 3 weeks with tape A. All of the most important spectra for the PEHF samples and the tape A in contact with the PEHF bands are found in Appendix 8.1.
The most important observation from these spectra is that the marked peaks disappeared during the ageing of the bands. The peaks appeared instead in the tape A spectrum after ageing, see marked peaks in Figure 4.22.
Figure 4.22: FTIR-spectrum extract from the PEHF-bands (un-aged and aged 3 and 6 weeks with tape A) and from the tape A aged 3 weeks on PEHF-bands.
This indicates that a phenolic compound has migrated from the band to the tape. After analyzing the spectra, the phenolic compound was identified as a phenolic antioxidant. It was also possible to see that another kind of antioxidant still remained in the PEHF bands.
The tape was not degraded after ageing on the PEHF-bands, according to the GC-MS analysis performed after 3 weeks of ageing on the PEHF-band.
1
3
4.2.4. OIT (Oxidative Induction Time)
Figure 4.23 shows the oxidative induction time for the PEHF bands without tape and for the bands with tape (with and without adhesive).
Figure 4.23: OIT for PEHF bands with and without tape.
A decrease of OIT points to that phenolic antioxidants have been consumed, inactivated or have migrated out of the material. Tape A affected thus the thermal stability dramatically. The oxidative induction time decreased in the beginning of the ageing. It seems like the antioxidants concentration decreased during the first week and then stayed almost constant. Tape A without adhesive did not show this affect, because of the absence of the adhesive (not 100 % without adhesive as said before, but almost without adhesive).
The acrylic adhesives probably made phenolic antioxidants and other polar compounds with low molecular weight migrate from the bands to the tapes, maybe also from the tape to the band. The encapsulation with tape seemed here not to have any negative effect. Oxygen in the air accelerates degradation of polyolefines and perhaps the encapsulation had a good influence by protecting the bands from the oxygen.
It is important to note that the PEHF bands was not degraded after 6 weeks of ageing. The conclusions is that one of the antioxidants, a phenolic antioxidant, migrated from the bands