Research Article
Sucrose Replacement by Sweeteners in Strawberry, Raspberry,
and Cherry Jams: Effect on the Textural Characteristics and
Sensorial Profile—A Chemometric Approach
Alice Vilela,
1Sílvia Matos,
2Ana S. Abraão,
2André M. Lemos,
2and Fernando M. Nunes
1 1CQ-VR, Chemistry Research Centre, Universidade de Tr´as-os-Montes e Alto Douro, 5001-801 Vila Real, Portugal2Universidade de Tr´as-os-Montes e Alto Douro, 5001-801 Vila Real, Portugal Correspondence should be addressed to Alice Vilela; [email protected] Received 11 August 2015; Revised 11 October 2015; Accepted 3 November 2015 Academic Editor: Vassiliki Oreopoulou
Copyright © 2015 Alice Vilela et al. This is an open access article distributed under the Creative Commons Attribution License, which permits unrestricted use, distribution, and reproduction in any medium, provided the original work is properly cited. Sucrose is the main sugar used in jams preparation; however his excessive consumption has been related to several diseases; therefore its replacement by alternative sweeteners is an attractive solution. Nonetheless, substitution of sucrose in jam’s preparation can cause changes in texture, structure, and flavor, making them less attractive to the consumers. Thus, the aim of this work was to develop strawberry, raspberry, and cherry jams with more adequate nutritional profile, maintaining their textural and flavor characteristics in comparison with the traditional formulation. Sucrose was replaced by fructose, sorbitol, or fructooligosaccharides (FOS), given the product different nutritional profiles: potential low glycemic index, reduced calories in the case of sorbitol and FOS, and enrichment with dietary fiber, in the case of FOS. After sensorial and rheological evaluation we found that the sweeteners used interfered, significantly, in the parameters measured. Fructose was the alternative sweetener yielding jams more similar to those of sucrose; however, the use of formulations containing fructose and FOS or sorbitol and FOS resulted in a 51% to 68% decrease of the energy value. Nevertheless, consumer sensorial tests are needed to evaluate, in a more consistent way, the use of these alternative sweeteners for jams production at industrial level.
1. Introduction
It is widely accepted that a diet with high intake of fruits, vegetables, and other nutrient-rich plant foods may reduce the risk of oxidative stress-related diseases [1, 2]. Several economically important and highly appreciated fruits come from the Rosaceae family, including cherries, raspberries, and strawberries. They are important source of nutrients, since they are rich in fibers, various vitamins, minerals and carbohydrates and have a low content of fats, proteins and calories, being highly appreciated due to their delicious flavors and aromas. Additionally they are also rich in natural antioxidants encompassing vitamins, carotenoids, and high content of phenolic compounds, especially anthocyanins [3], and their consumption has been related to potential health benefits [4]. The beneficial properties of phenolic compounds have been attributed to its ability to scavenge free radicals [5].
However, these fruits are perishable and the lack of appropriate techniques for postharvest, transport and storage results in great losses. Fruit preservation techniques like candying, production of jams and fruit preserves extend sig-nificantly their shelf-life allowing their consumption all year. Jams production goes back to ancient times when populations needed to prepare large quantities of food for the winter. They were usually made with a high concentration of sugars, mainly sucrose [6]. However large sucrose consumption has been correlated with adverse effects on health, such as cardiovascular diseases, obesity, diabetes, and hypertension [7]. Therefore the use of sweeteners has been evaluated as an alternative to sucrose. Modern consumers have an increase concerned with the nutritional and caloric value of food’s they consume, looking for healthier, innovative, safe, and easy to use products. Thus an increase in the consumption of diet and light products has been observed, suitable for restrictive
Volume 2015, Article ID 749740, 14 pages http://dx.doi.org/10.1155/2015/749740
caloric diets or for those who are concerned with aesthetics and also healthier eating habits [7].
Sugar has a key technological role in the traditional jam’s confection, as it influences the soluble solids content thereby being essential for the physical, chemical, and sensorial prop-erties of jams and also increasing its microbiological stability and hence safety [8]. In the traditional manufacturing of jams, sucrose binds water inducing pectin gelatinization [9], reducing the water activity to values near 0.8, and thereby inhibiting microbial growth and subsequent deterioration of jams [8]. Simply lowering the sugar content of a jam recipe will not produce an acceptable reduced-sugar jellied product. The amount of sugar required for proper gelling is dependent on the concentration of pectin in the natural fruit or in the commercial pectin added to the recipe. Low-sugar jams and jellies are best prepared with commercial pectin preparations and using the recipes developed specifically for that purpose. Because these contain less sugar than regular jams and jellies, they are more susceptible to mold growth [10].
Sugar-free jams are possible using alternative sweeteners also called low-calorie sweeteners, such as sorbitol, maltitol, and lactitol and/or sweeteners like saccharin and cyclamate. However, the attainment of a suitable texture may be more difficult in sorbitol jams than in jams with other sweeteners [11]. This product was also reported by Kerdsup and Naknean [12]; they refer to the fact that production of low sugar mango jam using sorbitol as a sweetener can be done with 100% substitution without effect on sensorial quality. Nevertheless, hardness decreased with increasing sorbitol concentration because of weaker junction zones in pectin gel network.
To meet the consumer’s demands, the food industry has diversified its product portfolio offering products with a diversified nutritional and sensorial profile, among others. The emergence of new food preservation methods and tech-nological advances, along with the increased knowledge at the nutrition level, contributed to improving the population’s quality of life. This product diversification means that product formulations have to be changed, but sometimes, substitution of an ingredient results in textural, structural, and flavor changes of the new products with a decrease in consumer’s preference due to comparisons with the traditional product [13]. So the new product formulation has to result in a similar texture, flavor, and rheological characteristics of the traditional product [14]. A deeper understanding of the factors that may influence the texture of processed foods is essential for the development of new products. Sensorial analysis in combination with mechanical and rheological measurements (texture) can avoid product rejection by con-sumers as they are useful in determining the functionality of a particular ingredient in the development of new products [8]. In a product such as jam, it is important to understand the relationship between food texture and structure of the gel. The ingredients or a change in their concentration can lead to changes in the gel structure [15], which can be detected in texture analysis or by sensorial analysis [13].
In view of all these issues, the aim of this work was the development of jams formulations with appropriate
nutritional properties, maintaining the characteristics of the jam in terms of texture and flavor. For this purpose, the sucrose used in traditional jams was replaced by other sugars (fructose), alditols (sorbitol), and dietary fibers with oligosac-charides (fructooligosacoligosac-charides, FOS) to obtain products with different nutritional properties, that is, potential low glycemic index, low calories, and enrichment in dietary fiber. Fructose is a simple sugar found in many foods, being one of the sweetest naturally occurring sugars, estimated to be twice as sweet as sucrose, and is often recommended for people with diabetes mellitus or hypoglycemia, because it has a very low glycemic index (GI) relative to sucrose [16]. Sorbitol is slowly absorbed by the organism. Therefore, when sorbitol is used, the rise in blood glucose and the insulin response associated with the ingestion of glucose is significantly reduced. Products sweetened with sorbitol for replacement of sugar may be useful in providing a wider variety of reduced calorie and sugar free choices to people with diabetes [17]. Fructooligosaccharides (FOS) have important beneficial physiological effects such as low cario-genicity, a prebiotic effect, improving mineral absorption, and decreasing the levels of serum cholesterol, triacylglycerols, and phospholipids. Currently FOS are increasingly used in food products and infant formulas due to their prebiotic effect that stimulates the growth of nonpathogenic intestinal microflora [18].
Replacing sucrose by other sugars, alditols or dietary fiber ingredients, in practical terms, are possible, but it is important to maintain the sensorial and rheological characteristics of the traditional jam in order to be well accepted by the consumers.
2. Material and Methods
2.1. Fruit Material and Jams Preparation. Strawberry,
rasp-berry, and cherry samples for jam production were kindly supplied by Douromel (Tabuac¸o, Portugal) company. Sucrose and alternative sweeteners for jams preparation (fructose, sorbitol, and FOS—fructooligosaccharides with a commer-cial name of actilight) used were supplied by Brenntag (Oporto, Portugal).
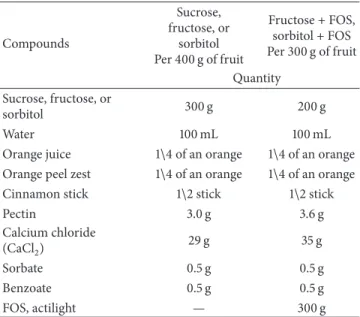
There were tested five sugar formulations, jams with sucrose (traditional formulation), and jams with fructose, with sorbitol, with fructose + FOS, and with sorbitol + FOS. The formulations are described in Table 1.
When FOS is used for jam processing, the amount of pectin added was higher, as well as the amount of calcium; however, in the final product (jam) the pectin content is the same as in jams containing sucrose, fructose, or sorbitol. The calcium content is higher in jam with FOS so that it interacts with pectins promoting a good gel formation (Table 1). While in the jam with sucrose, sorbitol, and fructose the sugars are added at the beginning of the jam confection, in the jams with FOS, this ingredient is only added when the jam
reaches the desired∘Brix (between 65 and 68∘Brix) and only
after removal of the recipient from flame or hot plate, since sugar analysis showed that FOS were degraded at the high temperatures needed for jam’s production.
Table 1: Formulation of strawberry, raspberry, and cherry jams, according to the osmotic dehydration agents used.
Compounds Sucrose, fructose, or sorbitol Per 400 g of fruit Fructose + FOS, sorbitol + FOS Per 300 g of fruit Quantity Sucrose, fructose, or sorbitol 300 g 200 g Water 100 mL 100 mL
Orange juice 1\4 of an orange 1\4 of an orange
Orange peel zest 1\4 of an orange 1\4 of an orange
Cinnamon stick 1\2 stick 1\2 stick
Pectin 3.0 g 3.6 g Calcium chloride (CaCl2) 29 g 35 g Sorbate 0.5 g 0.5 g Benzoate 0.5 g 0.5 g FOS, actilight — 300 g
2.2. Water Activity(𝑎𝑤). Water activity (𝑎𝑤) was measured
using a LabSwift-aw (Novasina, Switzerland) hygrometer.
Measurements were made at room temperature (20∘C).
2.3. Sugar Composition and Energy. For the quantification of
sugars (sucrose, fructose, sorbitol, fructose + FOS, and sor-bitol + FOS) on the final jams, 1.00 g of jam was homogenized (Ultra-Turrax, IKA T25 digital) with 50 mL of water. After diluting the homogenate with water to 200 mL, the content was further diluted and analyzed by high performance anion exchange chromatography with pulsed amperometric detection (HPAEC-PAD, ICS-3000, Dionex). For the analysis of sucrose, glucose, fructose, and sorbitol, the separation
was performed with a CarboPac PA-20 column (150 mm×
3 mm) with a CarboPac PA20 precolumn (Dionex) using an isocratic elution with a 10 mM NaOH solution containing
2 mM Ba(OH)2. The injection volume was 5𝜇L, the flow
rate was 0.3 mL/min, and the column temperature was
maintained at 35∘C during the run. For the analysis of
fructooligosaccharides (FOS) the separation was performed
with a CarboPac PA-100 column (250 mm × 3 mm) with
a CarboPac PA100 precolumn (Dionex) using an isocratic elution with a 60 mM NaOH solution containing 15 mM
sodium acetate and 2 mM Ba(OH)2. The injection volume
was 25𝜇L, the flow rate was 0.7 mL/min, and the column
temperature was maintained at 35∘C during the run. All
eluents were kept under nitrogen to reduce carbonate buildup and biological contamination. The electrochemical detector consisted of an Au working electrode, Ag/AgCl reference electrode, and Ti counter electrode. The ED cell waveform
was +0.1 V from 0.00 to 0.40 s, then−2.0 V from 0.41 to 0.42 s,
and a ramp−2.0 to +0.6 V from 0.42 to 0.43 s, followed by
−0.1 V from 0.44 to 0.50 s (end of cycle). The integration region was from 0.2 s to 0.4 s. For quantification of sucrose, fructose, glucose, and sorbitol a standard curve was used with pure standards. For actilight (FOS) as this ingredient was
composed by a mixture of short chain fructooligosaccharides plus small amounts of glucose, fructose, and sucrose and due to the lack of pure standards for all oligosaccharides, the ingredient was used for calibration, corrected for the amount of glucose, fructose, and sucrose present in actilight.
The caloric value was calculated by using the sugar composition determined by sugar analysis and the energy conversion values of the 2008/100/CE Directive. For FOS, due to the limitations in quantification described previously, the caloric value was calculated by estimating the amount of FOS by subtracting the solid content of fruits, water content, and fructose present to 100%.
2.4. Rheological Properties and Texture Profile Analysis. Stress
and strain at fracture and texture profile analysis (gel strength, rupture strength, fragility, and adhesiveness) were performed using a texturometer equipped with a 30 kg compression cell (TA-XT2i Texture Analyzer, Stable Micro Systems, Godalm-ing, Surrey, UK), connected to a personal computer.
After the jam preparation, a small amount was placed in the container, centrally under the probe-carrying; then the penetration test was performed. After a trigger force of 10 g, the probe penetrates the gel to a depth of 20 mm. During penetration of the probe forces decay at points where there are breaks in the gel. The Maximum Force (gel point of rupture) is recorded as the rupture strength, the distance the probe penetrates the gel before this point gives us an indication of the elasticity of the gel, that is, a short penetration before rupture indicates a weak gel, while a large penetration distance before breakage shows us a more elastic gel. When the probe is removed from the sample, the total force (area under the negative region of the curve) necessary for its withdrawal is measured and recorded as adhesion or
adhesiveness. A measurement of the gel strength is made in the
initial phase of penetration (3 mm) where little deformation of the gel occurs.
2.5. Jams Sensorial Profile. All sensorial analysis took place in
a room with controlled environment and material required for each task, according to ISO [19]. The test sessions took place once a week from 15:00 to 16:30.
The fourteen tasters (4 men and 10 women, ranging from 25 to 50 years of age) had a first theoretical session in which physiology of the senses, location and sensorial acuity, their conditions, environmental conditions, and naming sensorial test were addressed. For training of the panelists standard solutions of the primary tastes were used: sucrose for sweet taste; citric acid to the acid taste; quinine sulphate for bitter taste; and sodium chloride to the salty taste. Subsequently, we tested the perceptions of the panelists concerning sugars and alternative sweeteners (fructose, sorbitol, and FOS) used in jams, for sucrose replacement.
After physicochemical optimization of each jam, for each sugar/alternative sweetener tested, a quantitative descriptive analysis (QDA) was performed. This analysis allows the development of the sensorial profile of each jam with descrip-tors suitable for all evaluated parameters. For the tasting sessions we used a tasting sheath with unstructured scales of 10 cm. The descriptors were chosen according to the literature
[7] The sensorial parameters evaluated were appearance, aroma, texture, taste, flavor, and palatability (color, brightness,
aroma, cooked fruit aroma, sweet taste, acid taste, bitter taste, astringency, characteristic flavor, adhesiveness, cohesiveness, fracturability, chewiness, elasticity, spreadability, lumpiness,
and palatability).
Samples (a tablespoon of each jam) were served at room temperature in white Pyrex dishes. The samples were coded with three-digit codes, and the order of presentation was random. The tasters could rinse the mouth with mineral water between each sample. There were also provided small toasts of bread in order to help the evaluation of some sensorial attributes such as spreadability. The tests took place from 15:00 till 16:30. The jams elaborated with sucrose were used as the reference sample.
2.6. Statistical Data Analysis. The results were submitted to
analysis of variance (ANOVA); Duncan’s test at 5% signifi-cance was used to determine significant differences between the samples. Correlations were performed for all rheological parameters studied; the average of both replicates for each jam were used to calculate Pearson correlation coefficients which were used to model the relationships (∗), (∗∗), and (∗ ∗ ∗) indicating 0.05, 0.01, and 0.001 levels of significance, respectively. For interpreting the results, principal compo-nent analysis (PCA) was applied. PCA is a multidimensional modelling method which gives an interpretable overview of the main information in a multidimensional data table. In such multidimensional modelling methods, scores are esti-mated, carrying information from several variables and con-centrating this information onto a few underlying variables. The score plot may be regarded as a map of samples, showing the locations of the samples along each model component (PC1 and PC2). It can be used to detect sample patterns, groupings, similarities, or differences. Parallel to scores, the estimated loadings may be regarded as a map of variables. The loadings show how well a variable is taken into account by the model components. Loading plots can be used to show how much each variable contributes to the meaningful variation in the data and to interpret variable relationships [20]. Thus a Cov-Principal Components Analysis (Cov-PCA) was carried out to sensorial data and a Corr-PCA to the sensorial and textural data, using STATISTICA 10 software (Stasoft Inc., 2012). Cluster analysis (the average Euclidean distance, method UPGMA—unweighted pair-group average) was also performed using the same software. Sensorial profiles of the samples were obtained using the spider graphic (excel— Microsoft software).
3. Results and Discussion
3.1. Jams Chemical Composition, Energy Density, and𝑎𝑤. Low
calorie foods were originally targeted to specific consumers with health issues like obesity, but their use has expanded to disease prevention and to fit within the pattern of a healthier diet and lifestyle [21]. There is a great demand for food with a reduced sugar content and/or without sugar, but maintaining their sensorial attributes like taste, flavor and texture has been a challenge, this being the case of jams with low caloric value.
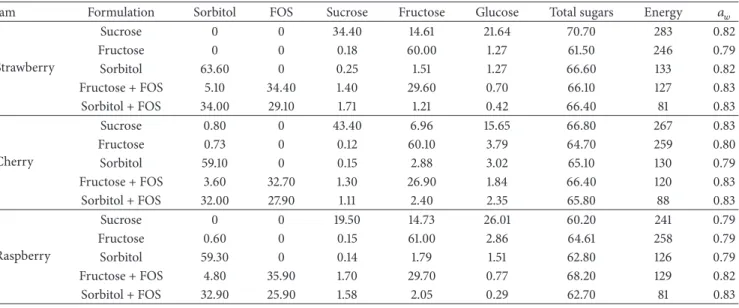
The energy values of the traditional (sucrose) and alternative jams are shown in Table 2. The jams prepared with sucrose and fructose, as expected, contained the higher energy values, in average 260 kcal/100 g for jam produced with sucrose and 250 kcal/100 g for the jam produced with fructose. The jams prepared with sorbitol or fructose + FOS ranged the second in energy values (average values of 127 kcal/100 g) showing that the substitution of sucrose by an alditol (sorbitol) or by the formulation fructose + FOS resulted in a 51% decrease of the energy value in relation to the jams prepared with sucrose. Nevertheless, jams prepared with the formulation sorbitol + FOS presented the lowest values of energy (an average value of 83 kcal/100 g) resulting in a 68% decrease in the energy value of the jams.
Strawberry, cherry, and raspberry jams chemical
compo-sition (g/100 g) and𝑎𝑤with the different sugar formulations
are also shown in Table 2. One important environmental parameter that determines the ability of molds to grow
on food is water activity (𝑎𝑤) [22]. Comparing the sugars
formulations tested, water activity (𝑎𝑤) varies slightly. Only
in strawberry jam made with fructose, cherry jam made with fructose or with sorbitol, and raspberry jam made with
sucrose or sorbitol are𝑎𝑤values lower than 0.80; thus these
fruits/sugars formulations are the ones that can better prevent the growth of microorganisms and subsequent deterioration of jams [8]. As anticipated, the final sugar composition of the jams was dependent on the sugars used (Table 2). Sorbitol and FOS were absent or in concentrations near to one (0.80 and 0.73) in the jams prepared with sucrose and fructose; however, in all the jams, except for the jam prepared with sucrose, fructose, sucrose, and glucose were present in very small values, independently of the sugar formulation used (sucrose, fructose, sorbitol, fructose + FOS, or sorbitol + FOS). The low values of sucrose, fructose, and glucose present are derived from the natural sugars present in the fruits before jam preparation and also from the presence of these sugars in the FOS ingredient used (results not shown).
3.2. Rheological Properties. Understanding the factors that
influence the texture of processed food is essential for future development. Rheological properties are useful in determin-ing determin-ingredient functionality in the product development, quality control, and correlation of food texture to sensorial attributes [23, 24]. Rheological properties of jams have been widely studied [25–28]. It has been established that their rheological properties are mainly affected by the amount and type of sugar added, proportion and kind of gelling agent used, fruit pulp content, and processing temperature. However, optimization of ingredient composition for jams production is rather limited [29, 30]. Furthermore, no infor-mation is available in literature on the variation of rheological and textural properties and microstructure of fruit jams with these compositions.
In order to understand the influence of the sugars formulations used in jam’s preparation, in theirs rheological properties, uniaxial compression tests were performed. The classification of textural terms for solids and semisolids gave rise to a profiling method of texture description (TPA) appli-cable to both sensorial [31] and instrumental measurements
Table 2: Strawberry, cherry, and raspberry jams chemical composition (g/100 g), energy density (kcal/100 g), and𝑎𝑤 with the different sugar/alternative sweeteners formulations.
Jam Formulation Sorbitol FOS Sucrose Fructose Glucose Total sugars Energy 𝑎𝑤
Strawberry Sucrose 0 0 34.40 14.61 21.64 70.70 283 0.82 Fructose 0 0 0.18 60.00 1.27 61.50 246 0.79 Sorbitol 63.60 0 0.25 1.51 1.27 66.60 133 0.82 Fructose + FOS 5.10 34.40 1.40 29.60 0.70 66.10 127 0.83 Sorbitol + FOS 34.00 29.10 1.71 1.21 0.42 66.40 81 0.83 Cherry Sucrose 0.80 0 43.40 6.96 15.65 66.80 267 0.83 Fructose 0.73 0 0.12 60.10 3.79 64.70 259 0.80 Sorbitol 59.10 0 0.15 2.88 3.02 65.10 130 0.79 Fructose + FOS 3.60 32.70 1.30 26.90 1.84 66.40 120 0.83 Sorbitol + FOS 32.00 27.90 1.11 2.40 2.35 65.80 88 0.83 Raspberry Sucrose 0 0 19.50 14.73 26.01 60.20 241 0.79 Fructose 0.60 0 0.15 61.00 2.86 64.61 258 0.79 Sorbitol 59.30 0 0.14 1.79 1.51 62.80 126 0.79 Fructose + FOS 4.80 35.90 1.70 29.70 0.77 68.20 129 0.82 Sorbitol + FOS 32.90 25.90 1.58 2.05 0.29 62.70 81 0.83
Sucrose Fructose Sorbitol
Time (s) Time (s) Time (s) Time (s) Time (s)
1 2 0 20 40 60 1 2 1F 2F 0 20 40 60 1 2 1 F 2 F 0 20 40 60 1 2 1 F 2 F 0 20 40 60 1 2 1F 2F Sorbitol+ FOS Fructose+ FOS F o rce (kg) 0 20 40 60 1F 2F −0,6 −0,4 −0,20,0 0,2 0,4 0,6 0,8 −0,4 −0,2 0,0 0,2 0,4 0,6 −0,4 −0,2 0,0 0,2 0,4 −0,5 −0,3 −0,1 0,1 0,3 0,5 0,7 −0,4 −0,2 0,0 0,2 0,4 0,6 (a) 0 20 40 60 1 2 1F2F 0 20 40 60 1 2 1F 2F 0 20 40 60 1 2 1F 2F 0 20 40 60 1 2 1F2F 0 20 40 60 1 2 1F2F Time (s)
Time (s) Time (s) Time (s) Time (s) −0,6 −1,0 −1,0 −0,2 0,2 0,6 1,0 1,4 F o rce (kg) −0,6 −0,20,2 0,6 1,0 1,8 1,4 −0,4 −0,2 0,0 0,2 0,4 0,6 −0,4 −0,2 0,0 0,2 0,4 0,6 −0,8 −0,4 0,0 0,4 0,8 1,2 (b) 0 20 40 60 0 20 40 60 1 2 1F 2F 1 2 1F2F 1 2 1F2F 1 2 1F 2F 1 2 1F 2F Time (s) Time (s) 0 20 40 60 Time (s) 0 20 40 60 Time (s) 0 20 40 60 Time (s) −0,15 −0,25 −0,050,05 0,15 0,25 0,35 0,45 F o rce (kg) −0,8 −0,4 0,0 0,4 0,8 1,2 1,6 −0,4 −0,2 0,0 0,2 0,4 0,6 −0,6 −0,4 −0,20,0 0,2 0,4 0,6 0,8 1,0 −0,4 −0,2 0,0 0,2 0,4 0,6 0,8 (c)
Figure 1: Penetration graphs of rheological analysis of jams: (a) strawberry; (b) raspberry, and (c) cherry.
[32]. Some sensorial parameters, particularly the mechanical ones, seem to be fairly straight forward. For example, hard-ness, firmhard-ness, and softness are on a scale of resistance of the food to the applied compressive forces. However, as stated by Szczesniak [33] whether the human being reacts to the physical stress or to the pressure and how to simulate with
instruments the high pressure rates experienced in the mouth are still not known exactly.
Fruit and sugar formulations presented a significant effect on the texture profile of jams (Figure 1—penetration graphics of rheological analysis of jams). In Figures 2(a), 2(b), and 2(c) the average values obtained after the rheological analysis of
Fructose Sucrose Sorbitol Gel strength Rupture strength Fragility Adhesiveness Sorbitol+ FOS Fructose+ FOS −1200 −1000 −800 −600 −400 −200 0 200 400 600 800 (a) −1900 −1400 −900 −400 100 600 1100
Fructose Sucrose Sorbitol Gel strength Rupture strength Fragility Adhesiveness Sorbitol+ FOS Fructose+ FOS (b) 0 500 1000 −500 −1000 −1500
Fructose Sucrose Sorbitol Gel strength Rupture strength Fragility Adhesiveness Sorbitol+ FOS Fructose+ FOS (c)
Figure 2: Average values obtained after the rheological analysis (texture) of strawberry (a), raspberry (b), and cherry (c) jams made with the different sugars formulations. Blue bar: gel strength; brown bar: rupture strength; grey bar: fragility; and yellow bar: adhesiveness.
strawberry (a), raspberry (b), and cherry (c) jams made with the different sugars formulations are shown. Strawberry jam prepared with fructose and with the formulation containing sorbitol + FOS was the one that presented the higher rupture
strength and lower fragility values. Regarding the gel strength,
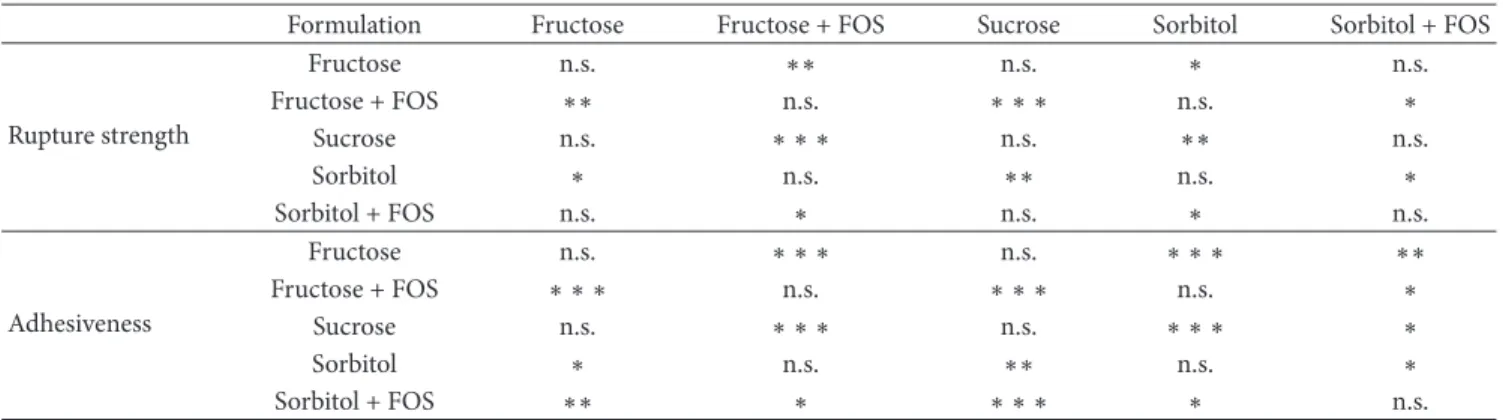
the jam prepared with fructose + FOS presented the lowest value for this parameter. Jams that presented higher adhesion or adhesiveness were the ones prepared with fructose, sucrose, or sorbitol + FOS. When we compare the sugar formulations, we found that for the parameter fragility there were not observed any significant differences (Table 3). There were, however, observed significant differences, for the parameters
gel strength, rupture strength, and adhesiveness, in strawberry
jams prepared with the different sugar formulations. Raspberry jams prepared with fructose and the formu-lation prepared with sorbitol + FOS were those presenting textural similarities, Figure 2(b), though the jam prepared with fructose presented a higher adhesiveness when com-pared with the jam produced with sorbitol + FOS. There were observed significant differences for the rheological
parameters tested rupture strength and adhesiveness, in rasp-berry jam prepared with the different sugar formulations. In relation to these rheological parameters and also
adhe-siveness, the jam prepared with sucrose was the one that
presented the highest values. For the parameters gel strength and fragility there were not found any significant differences between the sugar and alternative sweeteners (Table 4).
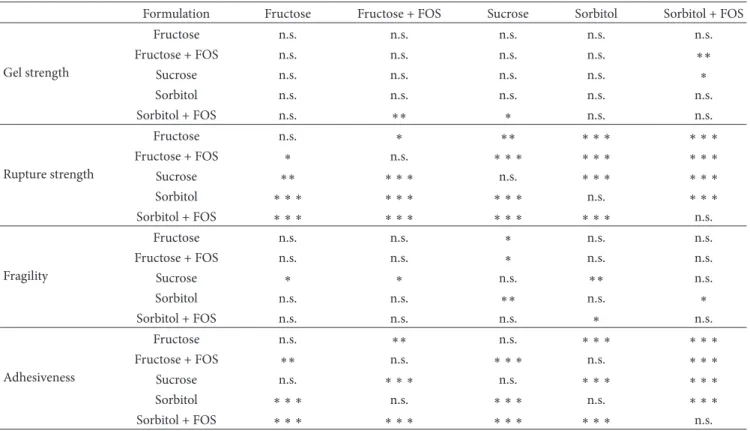
When cherries were used in jam’s preparation, jams with fructose or fructose + FOS were more similar (Figure 2(c)). In this jam, that prepared with sucrose had lower values for all rheological parameters evaluated. Nevertheless, there were observed significant differences between the sugars formula-tions; the jams prepared with sorbitol + FOS and prepared with sucrose presented significant differences concerning the
gel strength (Table 5). There were also observed significant
differences between the jams prepared with fructose + FOS, prepared with sucrose, and prepared with fructose, for the
rupture strength, and between jams prepared with fructose
and sucrose and sucrose and sorbitol + FOS in relation to
Table 3: Differences between various sugars tested for the rheological parameters evaluated: gel strength, rupture strength, and adhesiveness, in strawberry jam with the different sugar formulations. For the parameter fragility there were not found any significant differences.
Formulation Fructose Fructose + FOS Sucrose Sorbitol Sorbitol + FOS
Gel strength Fructose n.s. ∗ n.s. n.s. n.s. Fructose + FOS ∗ n.s. n.s. ∗ n.s. Sucrose n.s. n.s. n.s. n.s. n.s. Sorbitol n.s. ∗ n.s. n.s. n.s. Sorbitol + FOS n.s. n.s. n.s. n.s. n.s. Rupture strength Fructose n.s. ∗ ∗ ∗ ∗ ∗ ∗ ∗ ∗ ∗ n.s. Fructose + FOS ∗ ∗ ∗ n.s. ∗∗ ∗ ∗ ∗ ∗ Sucrose ∗ ∗ ∗ ∗∗ n.s. n.s. ∗∗ Sorbitol ∗ ∗ ∗ ∗ n.s. n.s. ∗ ∗ ∗ Sorbitol + FOS n.s. ∗ ∗ ∗ ∗∗ ∗ ∗ ∗ n.s. Adhesiveness Fructose n.s. ∗ ∗ ∗ ∗ ∗ ∗ ∗ ∗ ∗ ∗∗ Fructose + FOS ∗ ∗ ∗ n.s. ∗ ∗ ∗ n.s. ∗ ∗ ∗ Sucrose ∗ ∗ ∗ ∗ ∗ ∗ n.s. ∗ ∗ ∗ n.s. Sorbitol ∗ ∗ ∗ n.s. ∗ ∗ ∗ n.s. ∗ ∗ ∗ Sorbitol + FOS ∗∗ ∗ ∗ ∗ n.s. ∗ ∗ ∗ n.s.
Values with∗, ∗∗, or ∗ ∗ ∗ are significantly different, respectively, for 𝑃 ≤ 0.05; 𝑃 ≤ 0.01; and 𝑃 ≤ 0.001. n.s.: there are no significant differences.
Table 4: Differences between various sugars tested for the rheological parameters evaluated: rupture strength and adhesiveness, in raspberry jam with the different sugar formulations. For the parameters gel strength and fragility there were not found any significant differences.
Formulation Fructose Fructose + FOS Sucrose Sorbitol Sorbitol + FOS
Rupture strength Fructose n.s. ∗∗ n.s. ∗ n.s. Fructose + FOS ∗∗ n.s. ∗ ∗ ∗ n.s. ∗ Sucrose n.s. ∗ ∗ ∗ n.s. ∗∗ n.s. Sorbitol ∗ n.s. ∗∗ n.s. ∗ Sorbitol + FOS n.s. ∗ n.s. ∗ n.s. Adhesiveness Fructose n.s. ∗ ∗ ∗ n.s. ∗ ∗ ∗ ∗∗ Fructose + FOS ∗ ∗ ∗ n.s. ∗ ∗ ∗ n.s. ∗ Sucrose n.s. ∗ ∗ ∗ n.s. ∗ ∗ ∗ ∗ Sorbitol ∗ n.s. ∗∗ n.s. ∗ Sorbitol + FOS ∗∗ ∗ ∗ ∗ ∗ ∗ n.s.
Values with∗, ∗∗, or ∗ ∗ ∗ are significantly different, respectively, for 𝑃 ≤ 0.05; 𝑃 ≤ 0.01; and 𝑃 ≤ 0.001. n.s.: there are no significant differences.
significant differences were found for all the formulations sugars in relation to the formulation prepared with sorbitol + FOS, probably due to the increase in compactness of jam microstructure when prepared with FOS, as it was also reported by Renuka et al. [34].
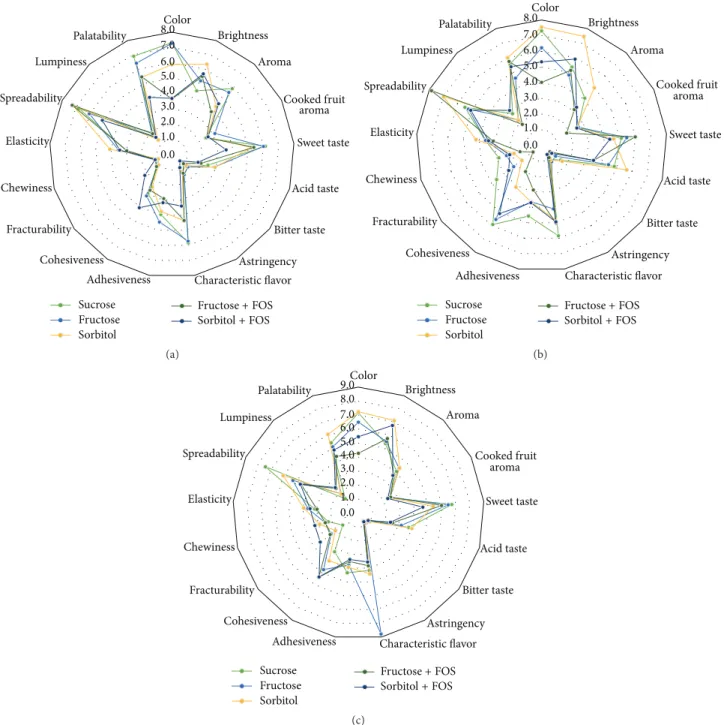
3.3. Jams Sensorial Profile and Cov-PCA Analysis. The
senso-rial profile of each jam/sugar/alternative sweetener formula-tion is shown graphically in Figures 3(a), 3(b), and 3(c) where the average values assigned by the panelists for each attribute is marked on the corresponding axis. The sensorial profile reveals itself when the dots are connected. In strawberry jams significant differences are found for several attributes (Table 6). Fructose enhanced the attributes color, brightness,
aroma, and sweet taste (Figure 3(a) and Table 6). For this
last attribute, the formulation prepared with sorbitol + FOS showed the significant lowest value. However, the presence of
fructose was also important for the strawberry characteristic
flavor (fructose + FOS) and palatability (fructose and fructose
+ FOS). Jams prepared with sorbitol presented the higher
spreadability.
Sensorial attributes of raspberry jams also presented significant differences (Figure 3(b) and Table 6). Sorbitol enhanced significantly the color, brightness, acid taste,
palata-bility, and spreadability of jams, while jams prepared with
sucrose present significantly higher values for the attributes
characteristic flavor, cohesiveness, fracturability, and chewi-ness. The formulation prepared with fructose + FOS was the
one that produced jams with less lumps.
Concerning cherry jams (Figure 3(c)), sucrose and sor-bitol are the sugars that intensified jams spreadability; sorsor-bitol also intensified their brightness, alone or in combination with FOS (Table 6). The jams that were significantly less sweet were those prepared with the combination of sorbitol
Table 5: Differences between various sugars/alternative sweeteners tested on the rheological parameters evaluated: gel strength, rupture
strength, fragility, and adhesiveness, in cherry jam with the different sugar/alternative sweeteners formulations.
Formulation Fructose Fructose + FOS Sucrose Sorbitol Sorbitol + FOS
Gel strength Fructose n.s. n.s. n.s. n.s. n.s. Fructose + FOS n.s. n.s. n.s. n.s. ∗∗ Sucrose n.s. n.s. n.s. n.s. ∗ Sorbitol n.s. n.s. n.s. n.s. n.s. Sorbitol + FOS n.s. ∗∗ ∗ n.s. n.s. Rupture strength Fructose n.s. ∗ ∗∗ ∗ ∗ ∗ ∗ ∗ ∗ Fructose + FOS ∗ n.s. ∗ ∗ ∗ ∗ ∗ ∗ ∗ ∗ ∗ Sucrose ∗∗ ∗ ∗ ∗ n.s. ∗ ∗ ∗ ∗ ∗ ∗ Sorbitol ∗ ∗ ∗ ∗ ∗ ∗ ∗ ∗ ∗ n.s. ∗ ∗ ∗ Sorbitol + FOS ∗ ∗ ∗ ∗ ∗ ∗ ∗ ∗ ∗ ∗ ∗ ∗ n.s. Fragility Fructose n.s. n.s. ∗ n.s. n.s. Fructose + FOS n.s. n.s. ∗ n.s. n.s. Sucrose ∗ ∗ n.s. ∗∗ n.s. Sorbitol n.s. n.s. ∗∗ n.s. ∗ Sorbitol + FOS n.s. n.s. n.s. ∗ n.s. Adhesiveness Fructose n.s. ∗∗ n.s. ∗ ∗ ∗ ∗ ∗ ∗ Fructose + FOS ∗∗ n.s. ∗ ∗ ∗ n.s. ∗ ∗ ∗ Sucrose n.s. ∗ ∗ ∗ n.s. ∗ ∗ ∗ ∗ ∗ ∗ Sorbitol ∗ ∗ ∗ n.s. ∗ ∗ ∗ n.s. ∗ ∗ ∗ Sorbitol + FOS ∗ ∗ ∗ ∗ ∗ ∗ ∗ ∗ ∗ ∗ ∗ ∗ n.s.
Values with∗, ∗∗, or ∗ ∗ ∗ are significantly different, respectively, for 𝑃 ≤ 0.05; 𝑃 ≤ 0.01; and 𝑃 ≤ 0.001. n.s.: there are no significant differences.
+ FOS. Fructose is the sugar that seems to preserve cherries characteristic flavor in the cherry jam (Table 6).
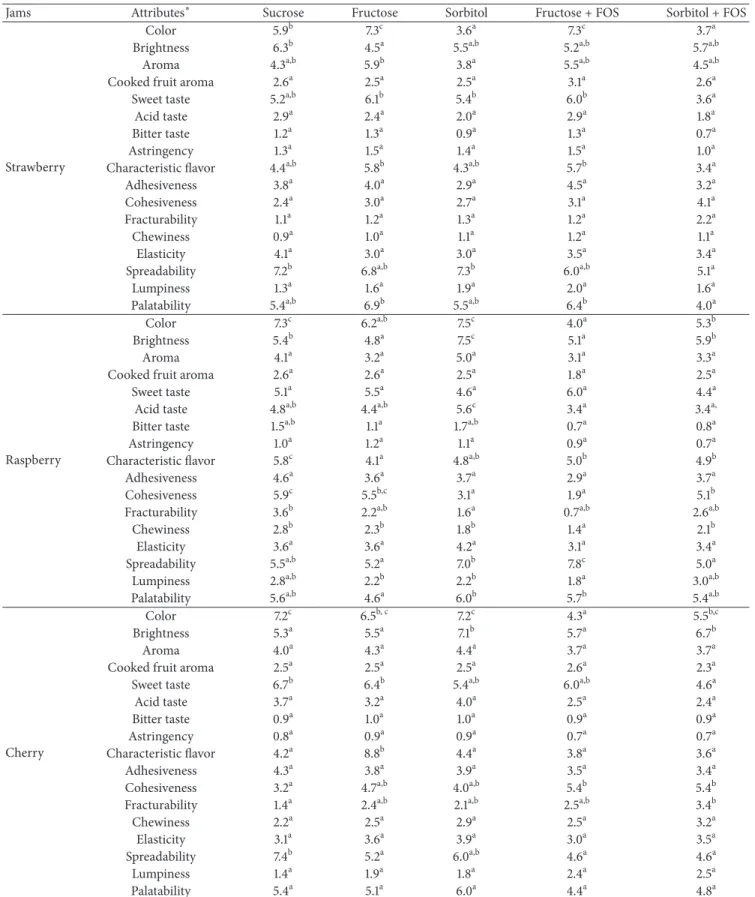
In all the Cov-PCAs performed to sensorial data (Figures 4(a) to 4(f)), the first two factorial axes (PC1 and PC2) represented a percentage higher than 70% of the original variability, so according to Mardia et al. [35] they satisfactorily explain the variability among the samples tested. From Cov-PCA analysis it can be inferred that strawberry jams made with fructose shared some similarities with the traditional strawberry jam (jams produced with sucrose); these two jams shared attributes such as color, aroma, sweet taste, strawberry
characteristic flavor, adhesiveness, and palatability (upper left
quadrant of Cov-PCA projection, Figures 4(a) and 4(b)). Strawberry jams produced with sorbitol and with fructose + FOS, positioned in the lower right Cov-PCA quadrant (Figures 4(a) and 4(b)), were similar mostly in the attribute
spreadability while for the strawberry jams produced with
the formulation sorbitol + FOS the sensorial attribute that distinguishes it from the others is fracturability and chewiness. Raspberry jam made with sorbitol is located alone in the lower right Cov-PCA quadrant and is better characterized by the attribute spreadability (Figures 4(c) and 4(d)). The jams produced with the formulation fructose + FOS are located in the upper right quadrant of the graphic and the attributes that distinguish this sample are brightness and cohesiveness. One group is formed by the jams produced with sorbitol + FOS and with fructose (upper left Cov-PCA quadrant); however,
after performing cluster analysis (data not shown) the jam produced with sucrose also clustered in this group. So the attributes that better characterize this major group are color,
aroma, characteristic flavor, adhesiveness, and palatability.
In cherry jams (Figures 4(e) and 4(f)) FOS seems to be the ingredient responsible for the group on the lower left
Cov-PCA quadrant (jams produced with sorbitol + FOS and
fructose + FOS). The attributes that better characterize this group are cohesiveness, fracturability, and lumpiness. Cherry jams made with sorbitol and with sucrose also form a group on the upper right Cov-PCA quadrant and this group is better characterized by the attributes spreadability, color and
palatability. The jams produced with fructose is in the lower
right quadrant of the graphic and is characterized by the attribute characteristic flavor.
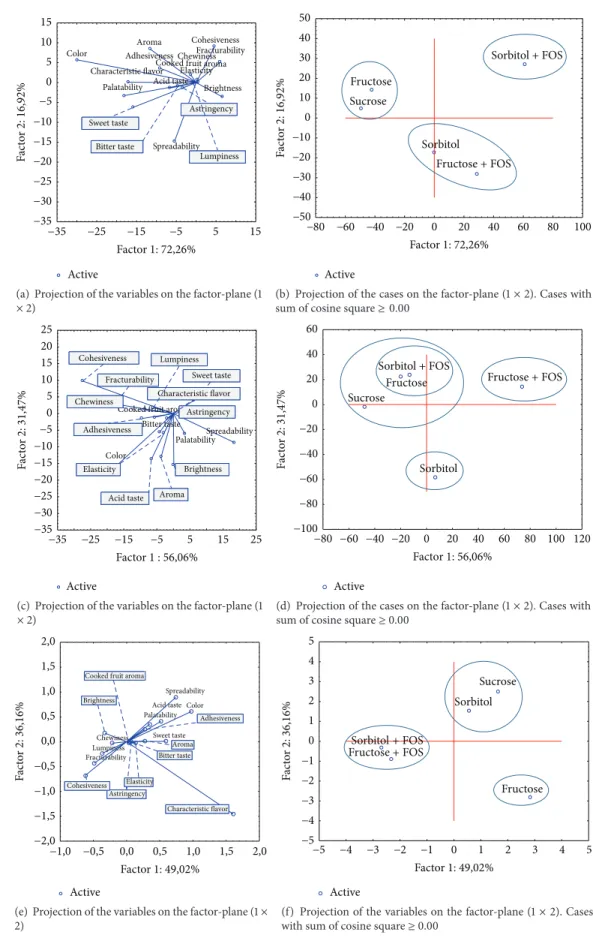
3.4. PCA Correlation between Sensorial and Textural Param-eters. Variations in the jam’s formulation produced evident
differences in the physical and sensorial properties of the final products and these differences can influence consumer acceptance. An attractive color is one of the most important quality characteristics for the strawberry, raspberry, or cherry jams processing industry, besides the typical characteristic flavor and convenient jam consistency [15]. Measurement of color and consistency are a complex subject since it depends on consumer appreciation. For this reason, it is important to carry out a sensorial analysis and establish the possible
0.0 1.0 2.0 3.0 4.0 5.0 6.0 7.0 8.0Color Brightness Aroma Cooked fruit Sweet taste Acid taste Bitter taste Astringency Characteristic flavor Adhesiveness Cohesiveness Fracturability Chewiness Elasticity Spreadability Lumpiness Palatability Sucrose Fructose Sorbitol Sorbitol + FOS Fructose + FOS aroma (a) 0.0 1.0 2.0 3.0 4.0 5.0 6.0 7.0 8.0Color Brightness Aroma Cooked fruit Sweet taste Acid taste Bitter taste Astringency Characteristic flavor Adhesiveness Cohesiveness Fracturability Chewiness Elasticity Spreadability Lumpiness Palatability aroma Sucrose Fructose Sorbitol Sorbitol + FOS Fructose + FOS (b) 0.0 1.0 2.0 3.0 4.0 5.0 6.0 7.0 8.0 9.0Color Brightness Aroma Cooked fruit Sweet taste Acid taste Bitter taste Astringency Characteristic flavor Adhesiveness Cohesiveness Fracturability Chewiness Elasticity Spreadability Lumpiness Palatability aroma Sucrose Fructose Sorbitol Sorbitol + FOS Fructose + FOS (c)
Figure 3: Sensorial profile of strawberry (a), raspberry (b), and cherry (c) jams made with five different OD agents or combinations.
relationships between the instrumental measurements of the physical properties and sensorial characteristics.
As reported above, both instrumental and sensorial approaches detected significant differences among the jams produced with sucrose or the alternative sweeteners. To explore the relationships between them, Corr-PCA was used to establish links between the perceived oral texture and the measured rheological parameters.
In Figures 5(b), 5(d), and 5(f) it is possible to see the spatial distribution of samples (jams) with different sugar formulations in the PCA projection. It is clear that taking into account the rheological parameters in the PCA analysis
changed the spatial distribution of some of the samples when compared with those of Figures 4(b), 4(d), and 4(f). This is the case of strawberry jam. In this jam, the attribute
spreadability (attribute evaluated by the tasting panel, which
consists in the ability to spread the jam into a toast with the help of a dessert knife) is correlated with the rheological parameter fragility, and rupture strength and gel strength are correlated with the oral attribute lumpiness (Figure 5(a)). The distribution of raspberry jams in Corr-PCA analysis is similar to the one in Cov-PCA. In this jam, the rheological parameter fragility is inversely correlated with the sensorial attribute cohesiveness but the rheological parameters rupture
Table 6: Average scores for each descriptor after sensorial evaluation of strawberry, raspberry, and cherry jams prepared with the different sugar/alternative sweeteners formulations (sucrose, fructose, sorbitol, fructose + FOS, and sorbitol + FOS).
Jams Attributes∗ Sucrose Fructose Sorbitol Fructose + FOS Sorbitol + FOS
Strawberry
Color 5.9b 7.3c 3.6a 7.3c 3.7a
Brightness 6.3b 4.5a 5.5a,b 5.2a,b 5.7a,b
Aroma 4.3a,b 5.9b 3.8a 5.5a,b 4.5a,b
Cooked fruit aroma 2.6a 2.5a 2.5a 3.1a 2.6a
Sweet taste 5.2a,b 6.1b 5.4b 6.0b 3.6a
Acid taste 2.9a 2.4a 2.0a 2.9a 1.8a
Bitter taste 1.2a 1.3a 0.9a 1.3a 0.7a
Astringency 1.3a 1.5a 1.4a 1.5a 1.0a
Characteristic flavor 4.4a,b 5.8b 4.3a,b 5.7b 3.4a
Adhesiveness 3.8a 4.0a 2.9a 4.5a 3.2a
Cohesiveness 2.4a 3.0a 2.7a 3.1a 4.1a
Fracturability 1.1a 1.2a 1.3a 1.2a 2.2a
Chewiness 0.9a 1.0a 1.1a 1.2a 1.1a
Elasticity 4.1a 3.0a 3.0a 3.5a 3.4a
Spreadability 7.2b 6.8a,b 7.3b 6.0a,b 5.1a
Lumpiness 1.3a 1.6a 1.9a 2.0a 1.6a
Palatability 5.4a,b 6.9b 5.5a,b 6.4b 4.0a
Raspberry
Color 7.3c 6.2a,b 7.5c 4.0a 5.3b
Brightness 5.4b 4.8a 7.5c 5.1a 5.9b
Aroma 4.1a 3.2a 5.0a 3.1a 3.3a
Cooked fruit aroma 2.6a 2.6a 2.5a 1.8a 2.5a
Sweet taste 5.1a 5.5a 4.6a 6.0a 4.4a
Acid taste 4.8a,b 4.4a,b 5.6c 3.4a 3.4a,
Bitter taste 1.5a,b 1.1a 1.7a,b 0.7a 0.8a
Astringency 1.0a 1.2a 1.1a 0.9a 0.7a
Characteristic flavor 5.8c 4.1a 4.8a,b 5.0b 4.9b
Adhesiveness 4.6a 3.6a 3.7a 2.9a 3.7a
Cohesiveness 5.9c 5.5b,c 3.1a 1.9a 5.1b
Fracturability 3.6b 2.2a,b 1.6a 0.7a,b 2.6a,b
Chewiness 2.8b 2.3b 1.8b 1.4a 2.1b
Elasticity 3.6a 3.6a 4.2a 3.1a 3.4a
Spreadability 5.5a,b 5.2a 7.0b 7.8c 5.0a
Lumpiness 2.8a,b 2.2b 2.2b 1.8a 3.0a,b
Palatability 5.6a,b 4.6a 6.0b 5.7b 5.4a,b
Cherry
Color 7.2c 6.5b, c 7.2c 4.3a 5.5b,c
Brightness 5.3a 5.5a 7.1b 5.7a 6.7b
Aroma 4.0a 4.3a 4.4a 3.7a 3.7a
Cooked fruit aroma 2.5a 2.5a 2.5a 2.6a 2.3a
Sweet taste 6.7b 6.4b 5.4a,b 6.0a,b 4.6a
Acid taste 3.7a 3.2a 4.0a 2.5a 2.4a
Bitter taste 0.9a 1.0a 1.0a 0.9a 0.9a
Astringency 0.8a 0.9a 0.9a 0.7a 0.7a
Characteristic flavor 4.2a 8.8b 4.4a 3.8a 3.6a
Adhesiveness 4.3a 3.8a 3.9a 3.5a 3.4a
Cohesiveness 3.2a 4.7a,b 4.0a,b 5.4b 5.4b
Fracturability 1.4a 2.4a,b 2.1a,b 2.5a,b 3.4b
Chewiness 2.2a 2.5a 2.9a 2.5a 3.2a
Elasticity 3.1a 3.6a 3.9a 3.0a 3.5a
Spreadability 7.4b 5.2a 6.0a,b 4.6a 4.6a
Lumpiness 1.4a 1.9a 1.8a 2.4a 2.5a
Palatability 5.4a 5.1a 6.0a 4.4a 4.8a
Color
Aroma
Cooked fruit aroma Acid taste Characteristic flavor Adhesiveness Cohesiveness Fracturability Chewiness Elasticity Spreadability Palatability Brightness Sweet taste Bitter taste Lumpiness Astringency Active −25 −15 5 15 −35 −5 Factor 1: 72,26% −35 −30 −25 −20 −15 −10 −5 0 5 10 15 F ac to r 2: 16,92%
(a) Projection of the variables on the factor-plane (1 × 2) Active Sucrose Fructose Sorbitol Sorbitol + FOS Fructose + FOS −50 −40 −30 −20 −10 0 10 20 30 40 50 F ac to r 2: 16,92% 60 40 20 0 80 100 −40 −60 −20 −80 Factor 1: 72,26%
(b) Projection of the cases on the factor-plane (1× 2). Cases with sum of cosine square≥ 0.00
Color Brightness Aroma Sweet taste Acid taste Characteristic flavor Adhesiveness Cohesiveness Fracturability Chewiness Elasticity Spreadability Lumpiness Palatability Cooked fruit aromaAstringency
Active Brightness Aroma Sweet taste Acid taste Characteristic flavor Adhesiveness Cohesiveness Fracturability Chewiness Elasticity Lumpiness Astringency −35 −30 −25 −20 −15 −10 −5 0 5 10 15 20 25 F ac to r 2: 31,47% −5 5 15 25 −35 −25 −15 Factor 1 : 56,06% Bitter taste
(c) Projection of the variables on the factor-plane (1 × 2) Active Sucrose Fructose + FOS −100 −80 −60 −40 −20 0 20 40 60 F ac to r 2: 31,47% −60 −40 −20 −80 0 20 40 60 80 100 120 Factor 1: 56,06% Sorbitol + FOS Sorbitol Fructose
(d) Projection of the cases on the factor-plane (1× 2). Cases with sum of cosine square≥ 0.00
−2,0 −1,5 −1,0 −0,5 0,0 0,5 1,0 1,5 2,0 F ac to r 2: 36,16% 2,0 1,5 0,5 0,0 −0,5 1,0 −1,0 Factor 1: 49,02% Active Color Acid taste Fracturability Spreadability Lumpiness Palatability Chewiness Brightness Aroma Cooked fruit aroma
Sweet taste Bitter taste Astringency Characteristic flavor Adhesiveness Cohesiveness Elasticity
(e) Projection of the variables on the factor-plane (1× 2) Sucrose Fructose Sorbitol Active −5 −4 −3 −2 −1 0 1 2 3 4 5 F ac to r 2: 36,16% 3 2 1 0 4 5 −2 −3 −4 −1 −5 Factor 1: 49,02% Sorbitol+ FOS Fructose+ FOS
(f) Projection of the variables on the factor-plane (1× 2). Cases with sum of cosine square≥ 0.00
Figure 4: Cov-PCA samples projection of attributes and jam samples ((a) and (b) strawberry; (c) and (d) raspberry; (e) and (f) cherry) made with the sugars sucrose, fructose, sorbitol, sorbitol + FOS, and fructose + FOS, after sensorial data analysis.
Active Sweet taste Bitter taste Palatibility Color Brightness Aroma Cooked fruit aroma
Sweet taste Acid taste Bitter taste Astringency Characteristic flavor Adhesiveness Cohesiveness Fracturability Chewiness Elasticity Spreadability
LumpinessGel strength
Rupture strength Fragility Adhesiveness Palatability −0,5 0,0 0,5 1,0 −1,0 Factor 1: 44,64% −1,0 −0,5 0,0 0,5 1,0 F ac to r 2: 27,98%
(a) Projection of the variables on the factor-plane (1× 2)
Sucrose Fructose Sorbitol Sorbitol+ FOS Fructose+ FOS 3 2 1 0 4 5 −1 −3 −4 −5 −6 −7 −2 −8 Factor 1: 44,64% −5 −4 −3 −2 −1 0 1 2 3 4 5 F ac to r 2: 27,98% Active
(b) Projection of the variables on the factor-plane (1× 2). Cases with sum of cosine square≥ 0.00
Color
BrightnessAroma Sweet taste
Acid tasteBitter taste
Astringency Characteristic flavor Elasticity Spreadability Gel strength Rupture strength Fragility Adhesiveness Palatability Active −1,0 −0,5 0,0 0,5 1,0 F ac to r 2: 26,63% −0,5 0,0 0,5 1,0 −1,0 Factor 1: 49,28% Cohesiveness Adhesiveness Cooked fruit aroma
FracturabilityChewiness
Lumpiness
(c) Projection of the variables on the factor-plane (1× 2)
Sucrose Sorbitol Active Fructose + FOS Sorbitol Fructose+ FOS −6 −5 −4 −3 −2 −1 0 1 2 3 4 F ac to r 2: 26,63% −6 −4 −8 −2 −10 0 2 4 6 8 Factor 1: 49,28%
(d) Projection of the cases on the factor-plane (1× 2). Cases with sum of cosine square≥ 0.00
Color
Brightness Aroma
Cooked fruit aroma Sweet taste Acid taste Bitter taste Astringency Characteristic flavor Adhesiveness Cohesiveness Fracturability Chewiness Elasticity Spreadability Lumpiness Gel strength Rupture strength Fragility Adhesiveness Palatibility Cohesiveness Rupture strength Palatability Active −0,5 0,0 0,5 1,0 −1,0 Factor 1: 55,47% −1,0 −0,5 0,0 0,5 1,0 F ac to r 2: 23,37%
(e) Projection of the variables on the factor-plane (1× 2)
Sucrose Sorbitol
Fructose Sorbitol+ FOS
Fructose+ FOS −6 −4 −2 0 2 4 6 8 −8 Factor 1: 55,47% −4 −3 −2 −1 0 1 2 3 4 5 F ac to r 2: 23,37% Active
(f) Projection of the cases on the factor-plane (1× 2). Cases with sum of cosine square≥ 0.00
Figure 5: Corr-PCA samples projection of attributes and jam samples ((a) and (b) strawberry; (c) and (d) raspberry; (e) and (f) cherry) made with the sugars sucrose, fructose, sorbitol, sorbitol + FOS, and fructose + FOS, after sensorial and textural data analysis.
strength, gel strength, and adhesiveness are correlated with
the sensorial attributes chewiness, lumpiness, and cohesiveness (Figure 5(c)).
Finally, in cherry jams, the sensorial attribute
adhesive-ness is correlated with the instrumental adhesiveadhesive-ness, and
spreadability is correlated with the instrumental parameter
fragility. The instrumental parameters rupture strength and gel strength are correlated with the attributes chewiness, fracturability, and cohesiveness.
4. Conclusions
The jams prepared with sucrose and fructose contained the higher energy values. The substitution of sucrose by sorbitol or by the formulation fructose + FOS resulted in a 51% decrease of the energy value in relation to the jams pre-pared with sucrose, and jams prepre-pared with the formulation sorbitol + FOS resulted in a 68% decrease in energy value of jams.
Only in strawberry jam made with fructose, cherry jam made with sorbitol, and raspberry jam made with sucrose,
fructose, or sorbitol were𝑎𝑤values lower than 0.80. Thus,
these fruits/sugars formulations are the ones that can better prevent the growth of microorganisms and subsequent prod-uct deterioration.
Sugar formulation affects both sensorial and rheological parameters of jams. Fructose was important for the straw-berry and cherry characteristic flavor, alone or associated with FOS (in the strawberry jam). The formulations containing sucrose or sorbitol were the easiest to spread. The jams that were significantly less sweet were those prepared with the combination of sorbitol + FOS, independently of the fruit used.
In general, the instrumental parameters rupture strength and gel strength are correlated with the sensorial attributes
chewiness, fracturability, and cohesiveness. However, in
straw-berry jam, chewiness, fracturability, and cohesiveness are correlated with rheological parameter lumpiness.
Spreadabil-ity, in strawberry and cherry jams, is correlated with the
instrumental parameter fragility. Nonetheless, only in cherry jams was the sensorial attribute adhesiveness correlated with the instrumental adhesiveness.
Conflict of Interests
The authors declare that there is no conflict of interests regarding the publication of this paper.
Acknowledgments
The authors want to acknowledge QREN, ADI, Programa Operacional do Norte and FEDER for the financial support of the Project Nutridouro no. 13311. The authors also would like to thank the entire tasting panel that participated in this work (Ana Abra˜ao, Ana Alice Santos, Andr´e Lemos, Ant´onio Inˆes, Ant´onio Lage, Berta Gonc¸alves, Carla Amaral, Edna Cabecinha, Eunice Areale, Fernanda Cosme, Fernando Nunes, Paula Ribeiro, Ros´ario Anjos, and Teresa Pinto).
References
[1] World Cancer Research Fund/American Institute for Cancer Research, Food, Nutrition, Physical Activity and the Prevention
of Cancer: A Global Perspective, American Institute of Cancer
Research, Washington, DC, USA, 2007.
[2] I. T. Johnson, “New approaches to the role of diet in the preven-tion of cancers of the alimentary tract,” Mutapreven-tion Research, vol. 551, no. 1-2, pp. 9–28, 2004.
[3] K. Thaipong, U. Boonprakob, K. Crosby, L. Cisneros-Zevallos, and D. Hawkins Byrne, “Comparison of ABTS, DPPH, FRAP, and ORAC assays for estimating antioxidant activity from guava fruit extracts,” Journal of Food Composition and Analysis, vol. 19, no. 6-7, pp. 669–675, 2006.
[4] S. Tachakittirungrod, S. Okonogi, and S. Chowwanapoonpohn, “Study on antioxidant activity of certain plants in Thailand: mechanism of antioxidant action of guava leaf extract,” Food
Chemistry, vol. 103, no. 2, pp. 381–388, 2007.
[5] Y. Xing and P. J. White, “Antioxidants from cereals and legumes,” in Natural Antioxidants: Chemistry, Health Effects, and
Applica-tions, F. Shahidi, Ed., pp. 25–55, AOCS Press, Champaign, Ill,
USA, 1996.
[6] WHO/FAO, “Diet, nutrition and the prevention of chronic diseases,” Report of a Joint WHO/FAO Expert Consultation, World Health Organization, Geneva, Switzerland, 2003. [7] C. R. Mendonc¸a, R. C. Zambiazi, M. A. Gularte, and G. G.
Granada, “Caracter´ısticas sensoriais de compotas de pˆessego light elaboradas com sucralose e acesulfame-k,” Ciˆencia e
Tecnologia de Alimentos, vol. 25, no. 3, pp. 401–407, 2005.
[8] S. Basu and U. S. Shivhare, “Rheological, textural, micro-structural and sensory properties of mango jam,” Journal of
Food Engineering, vol. 100, no. 2, pp. 357–365, 2010.
[9] M. Suutarinen, Effects of pre-freezing treatments on the structure
of strawberries and jams [Ph.D. thesis], VTT, Helsinki University
of Technology, Espoo, Finland, 2002.
[10] W. C. Morris, “Low or no sugar in jams, jellies and preserves,” Tech. Rep. SP325-F, Agricultural Extension Service, University of Tennessee, Knoxville, Tenn, USA, 2004.
[11] L. Hyv¨onen and R. T¨orm¨a, “Examination of sugars, sugar alcohols, and artificial sweeteners as substitutes for sucrose in strawberry jam. Product development,” Journal of Food Science, vol. 48, no. 1, pp. 183–185, 1983.
[12] P. Kerdsupa and P. Nakneana, “Effect of sorbitol substitution on physical, chemical and sensory properties of low-sugar mango jam,” in Science and Engineering Symposium: 4th International
Science, Social Science, Engineering and Energy Conference, pp.
12–18, 2013.
[13] D. Renard, F. Velde, and R. W. Visschers, “The gap between food gel structure, texture and perception,” Food Hydrocolloids, vol. 20, no. 4, pp. 423–431, 2006.
[14] S. Basu, U. S. Shivhare, T. V. Singh, and V. S. Beniwal, “Rheolog-ical, textural and spectral characteristics of sorbitol substituted mango jam,” Journal of Food Engineering, vol. 105, no. 3, pp. 503– 512, 2011.
[15] T. Wicklund, H. J. Rosenfeld, B. K. Martinsen et al., “Antioxidant capacity and colour of strawberry jam as influenced by cultivar and storage conditions,” LWT—Food Science and Technology, vol. 38, no. 4, pp. 387–391, 2005.
[16] S. S. Elliott, N. L. Keim, J. S. Stern, K. Teff, and P. J. Havel, “Fructose, weight gain, and the insulin resistance syndrome,”
The American Journal of Clinical Nutrition, vol. 76, no. 5, pp.
[17] Calorie Control Council, February 2015, http://polyol.org/facts-about-polyols/sorbitol/.
[18] S. King, J. Glanville, M. E. Sanders, A. Fitzgerald, and D. Varley, “Effectiveness of probiotics on the duration of illness in healthy children and adults who develop common acute respiratory infectious conditions: a systematic review and meta-analysis,”
British Journal of Nutrition, vol. 112, no. 1, pp. 41–54, 2014.
[19] ISO, “General guidance for the design of test rooms,” ISO 8589:2007, 2007, http://www.iso.org/iso/catalogue detail .htm?csnumber=36385.
[20] H. J. Rosenfeld and A. Nes, “Prediction of sensory quality of strawberry jam by means of sensory quality attributes of fresh fruits,” Journal of the Science of Food and Agriculture, vol. 80, no. 13, pp. 1895–1902, 2000.
[21] D. K. Sandrou and I. S. Arvanitoyannis, “Low-fat/calorie foods: current state and perspectives,” Critical Reviews in Food Science
and Nutrition, vol. 40, no. 5, pp. 427–447, 2000.
[22] S. Mar´ın, V. Sanchis, A. J. Ramos, I. Vinas, and N. Magan, “Environmental factors, in vitro interactions, and niche overlap between Fusarium monoliforme, F. proliferatum, and F.
gramin-earum, Aspergillus and Penicillium species from maize grain,” Mycological Research, vol. 102, no. 7, pp. 831–837, 1998.
[23] J. L. Kokini and G. J. Plutchok, “Viscoelastic properties of semisolid foods and their biopolymers components,” Food
Technology, vol. 41, no. 3, pp. 89–95, 1987.
[24] P. Dervisi, J. Lamb, and I. Zabetakis, “High pressure processing in jam manufacture: effects on textural and colour properties,”
Food Chemistry, vol. 73, no. 1, pp. 85–91, 2001.
[25] E. Carbonell, E. Costell, and L. Duran, “Rheological behaviour of sheared jams. Relation with fruit content,” Journal of Texture
Studies, vol. 22, no. 1, pp. 33–34, 1991.
[26] E. Carbonell, E. Costell, and L. Duran, “Rheological indices of fruit content in jams: influence of formulation on time-dependent flow of sheared strawberry and peach jams,” Journal
of Texture Studies, vol. 22, no. 4, pp. 457–471, 1991.
[27] D. Gabriele, B. De Cindio, and P. D’Antona, “A weak gel model for foods,” Rheologica Acta, vol. 40, no. 2, pp. 120–127, 2001. [28] E. ´Alvarez, M. A. Cancela, and R. Maceiras, “Effect of
temper-ature on rheological properties of different jams,” International
Journal of Food Properties, vol. 9, no. 1, pp. 135–146, 2006.
[29] A. Abdullah and T. C. Cheng, “Optimization of reduced calorie tropical mixed fruits jam,” Food Quality and Preference, vol. 12, no. 1, pp. 63–68, 2001.
[30] O. Acosta, F. V´ıquez, and E. Cubero, “Optimisation of low calorie mixed fruit jelly by response surface methodology,” Food
Quality and Preference, vol. 19, no. 1, pp. 79–85, 2008.
[31] M. A. Brandt, E. Z. Skinner, and J. A. Coleman, “Texture profile method,” Journal of Food Science, vol. 28, no. 4, pp. 404–409, 1963.
[32] A. S. Szczesniak, M. A. Brandt, and H. H. Friedman, “Devel-opment of standard rating scales for mechanical parameters of texture and correlation between the objective and sensory methods of texture evaluation,” Journal of Food Science, vol. 28, no. 4, pp. 397–403, 1963.
[33] A. S. Szczesniak, “Texture is a sensory property,” Food Quality
and Preference, vol. 13, no. 4, pp. 215–225, 2002.
[34] B. Renuka, M. Prakash, and S. G. Prapulla, “Fructooligosac-charides based low calorie gulab jamun: studies on the texture, microstructure and sensory attributes,” Journal of Texture
Stud-ies, vol. 41, no. 4, pp. 594–610, 2010.
[35] L. V. Mardia, J. T. Keni, and J. M. Bibby, Multivariate Analysis, Academic Press, London, UK, 1st edition, 1979.
Submit your manuscripts at
http://www.hindawi.com
Hindawi Publishing Corporation
http://www.hindawi.com Volume 2014
Anatomy
Research International
Peptides
Hindawi Publishing Corporation
http://www.hindawi.com Volume 2014
Hindawi Publishing Corporation http://www.hindawi.com
International Journal of
Volume 2014
Zoology
Hindawi Publishing Corporation
http://www.hindawi.com Volume 2014
Molecular Biology International
Genomics
International Journal of Hindawi Publishing Corporation
http://www.hindawi.com Volume 2014
The Scientific
World Journal
Hindawi Publishing Corporation
http://www.hindawi.com Volume 2014
Hindawi Publishing Corporation
http://www.hindawi.com Volume 2014
Bioinformatics
Advances inMarine Biology
Journal of Hindawi Publishing Corporationhttp://www.hindawi.com Volume 2014 Hindawi Publishing Corporation
http://www.hindawi.com Volume 2014
Signal Transduction
Journal ofHindawi Publishing Corporation
http://www.hindawi.com Volume 2014
BioMed
Research International
Evolutionary Biology International Journal of
Hindawi Publishing Corporation
http://www.hindawi.com Volume 2014
Hindawi Publishing Corporation
http://www.hindawi.com Volume 2014
Biochemistry Research International
Archaea
Hindawi Publishing Corporation
http://www.hindawi.com Volume 2014
Hindawi Publishing Corporation
http://www.hindawi.com Volume 2014 Genetics
Research International
Hindawi Publishing Corporation
http://www.hindawi.com Volume 2014
Advances in
Virology
Hindawi Publishing Corporation http://www.hindawi.com
Nucleic Acids
Journal ofVolume 2014
Stem Cells
International
Hindawi Publishing Corporation
http://www.hindawi.com Volume 2014
Hindawi Publishing Corporation
http://www.hindawi.com Volume 2014
Enzyme
Research
Hindawi Publishing Corporation
http://www.hindawi.com Volume 2014
International Journal of