The Use of Eco-Labels on
Packaging Communication:
Investigating the Impact of
Colour and Claim on Purchase
Intention
Beatriz Neto
152116131
Dissertation written under the supervision of
Prof. Paulo Romeiro
Dissertation submitted in partial fulfilment of requirements for the MSc in
Business, at the Universidade Católica Portuguesa, 05.04.2019.
ABSTRACT
The Use of Eco-Labels on Packaging Communication: Investigating the Impact of Colour and Claim on Purchase Intention
Beatriz Neto
Environmental friendly products are becoming a preference choice among consumers, since they’re becoming more environmentally concerned and aware of the impact of their consumption habits on the Environment. To identify environmental friendly products there are labels established by the International Organization for Standardization: the eco-labels. These eco-labels are a mark or a logo awarded to communionate to consumers the fulfilment of several environmental criteria, usually regarding ethical qualities about products, like fair-trade, labor practices, animal rights, environmental orientation, energy efficiency, among others.
Generally, eco-labels are well received by consumers and generate positive perceptions of environmental friendliness, especially for low-involvement products. Furthermore, a review of the existent literature indicates that eco-labels are an important element affecting purchase intention and that the attitude towards eco-labels may vary according to several factors, such as consumer awareness of eco-labels, the demographic profile of consumers and their environmental motivations.
This thesis aims at understanding what elements impacts more purchase intention when communicating eco-labels: colour or claim. Additionally, the impact of consumers’ eco-label awareness on purchase intention was study.
To test the hypotheses drawn on the present study, a survey based on literature review was conducted. Respondents were exposed to a eco-label assigned to them randomly and asked about several questions not only regarding the eco-label it-self, but also about eco-labels in general.
Findings indicate that claim is the eco-label element that impacts more purchase intention, followed by consumer awareness of eco-labels and in third place by green colour, whenever associated with emotional and environmental concepts.
Keywords: Eco-label; Purchase Intention; Packaging Communication; Colour; Claim; Awareness.
SUMÁRIO
The Use of Eco-Labels on Packaging Communication: Investigating the Impact of Colour and Claim on Purchase Intention
Beatriz Neto
Os consumidores estão cada vez mais preocupados com o ambiente e conscientes do impacto do seu consumo nele. Assim, os produtos amigos do ambiente estão a tornar-se uma escolha de preferência entre os consumidores. Para os identificar, existem logos estabelecidos pela Organização Internacional de Normalização, os eco-labels, que comunicam ao consumidor o preenchimento de vários requisitos ambientais associados a qualidades éticas dos produtos, como o comércio justo, práticas laborais, direitos dos animais, orientação ambiental, eficiência energética, entre outros.
Geralmente, os eco-labels são bem recebidos pelos consumidores, gerando perceções positivas quanto à orientação ambiental dos produtos, sobretudo nos de low-involvement. Ademais, a literatura existente indica que os eco-labels impactam a intenção de compra e que a atitude perante eles pode variar mediante vários fatores, como a notoriedade dos eco-labels, o perfil demográfico dos consumidores e as suas motivações ambientais.
Esta tese procura entender quais os elementos que mais impactam a intenção de compra quando se comunica um eco-label: cor ou claim (conteúdo escrito do eco-label). Adicionalmente, foi estudado o impacto da notoriedade dos eco-labels na intenção de compra. Para testar as hipóteses levantadas neste estudo, foi aplicado um questionário baseado numa revisão da literatura existente. Os participantes, expostos a um eco-label atribuído aleatoriamente, responderam a várias questões sobre o label mostrado e sobre os eco-labels em geral.
Os resultados indicam que o claim é o elemento dos eco-labels que mais impacta a intenção de compra, seguido pela notoriedade dos eco-labels e pela cor verde, quando associada a emoções e conceitos ambientais.
Palavras-chave: Eco-label; Intenção de Compra; Packaging Communication; Cor; Claim; Notoriedade; Awareness.
ACKNOWLEDGEMENTS
I would firstly like to express my gratitude to my parents, who have constantly supported me through my academic journey and provided me with the best educational opportunities so that I can later achieve what I aim both at a professional and personal level. Along with my sister, they were unwearied in supporting and encouraging me to complete this dissertation, the final stage of my Master’s degree.
I would like to extend my sincere thanks to my supervisor Paulo Romeiro, for his advices, orientation and valuable feedback. His guidance throughout the dissertation process was important to finish this thesis.
I would also like to thank all the respondents of this thesis’ survey for their responses and time. It allowed me to collect the data I needed and finish this dissertation.
Finishing this thesis means starting a new chapter in my life. Thank you to all who accompanied me here.
TABLE OF CONTENTS
ABSTRACT ... III SUMÁRIO ... IV ACKNOWLEDGEMENTS ... V TABLE OF CONTENTS ... VI TABLE OF FIGURES ... VIII TABLE OF TABLES ... IX TABLE OF APPENDICES ... X GLOSSARY ... XI
CHAPTER 1: INTRODUCTION ... 1
1.1 BACKGROUND AND PROBLEM STATEMENT ... 1
1.2PROBLEM STATEMENT ... 2
1.3RELEVANCE ... 3
1.4RESEARCH METHODS ... 4
1.5DISSERTATION OUTLINE ... 4
CHAPTER 2: LITERATURE REVIEW AND CONCEPTUAL FRAMEWORK ... 5
2.1PURCHASE INTENTION ... 5
2.2PACKAGING COMMUNICATION: THE USE OF ECO-LABELS ... 6
2.2.1 Packaging ... 6
2.2.2 Eco-labels ... 8
2.2.2.1 Visual and Informational Elements of Eco-Labels ... 10
2.3CONSUMER AWARENESS OF ECO-LABELS ... 12
2.4CONCEPTUAL FRAMEWORK ... 13
CHAPTER 3: METHODOLOGY ... 14
3.1RESEARCH APPROACH ... 14
3.2SECONDARY DATA... 15
3.3PRIMARY DATA ... 15
3.3.1 Pilot Study: Survey Questionnaire ... 15
3.3.2 Main Study: Survey Questionnaire ... 16
CHAPTER 4: RESULTS AND DISCUSSION ... 21
4.1SAMPLE CHARACTERIZATION ... 22
4.2MEASURE RELIABILITY ... 25
4.3VARIABLES IN STUDY ... 28
4.4RESULTS FROM THE HYPOTHESES TESTING ... 29
4.4.1 Differences of colour and claim by Eco-label ... 29
4.4.2 The Impact of Colour, Claim and Awarenes of Eco-labels on Purchase Intention ... 30
4.4.3 Hypotheses Testing Overview ... 35
CHAPTER 5: CONCLUSIONS AND LIMITATIONS ... 37
5.1MAIN FINDINGS &CONCLUSIONS ... 37
5.2MANAGERIAL /ACADEMIC IMPLICATIONS ... 37
5.3LIMITATIONS AND FURTHER RESEARCH ... 38
REFERENCE LIST ... I APPENDICES ... IX APPENDIX 1:MAIN SURVEY QUESTIONNAIRE ... IX BLOCK 1:CONTROL QUESTION ... IX
BLOCK 2:QUESTION RELATED TO THE ECO-LABEL RANDOMLY ASSIGNED (12 DIFFERENT
BLOCKS, EACH WITH A DIFFERENT ECO-LABEL) ... IX BLOCK 3:COMMON QUESTIONS TO ALL RESPONDENTS ... XV APPENDIX 2:REGRESSIONS’OUTPUTS ... XVIII
TABLE OF FIGURES
Figure 1: Conceptual Framework ………... 13 Figure 2: Eco-labels presented to respondents ... 17 Figure 3: Eco-labels’ numbering ……... 21
TABLE OF TABLES
Table 1: Measurement Model …………... 19
Table 2: Distribution of Respondents by Eco-label ... 22
Table 3: Characteristics of Respondents in the Demographic Variables ... 23
Table 4: Characterization of Consumers’ Perception of Eco-labels. 7-items likert scale ... 24
Table 5: Characterization of Consumers Awareness of Eco-labels. Dichotomus Scale ... 25
Table 6: Cronbach´s Alpha by Eco-label and Total ……… 27
Table 7: Cronbach’s Alpha of Awareness of Eco-labels ... 28
Table 8: Variables in Study …………... 29
Table 9: Paired t-test between Colour and Claim in each Eco-label ... 30
Table 10: Pearson Correlations between Predictors and Purchase Intent ... 31
Table 11: Linear Regression Models’ Table ... 35
TABLE OF APPENDICES
Appendix 1: Main survey questionnaire ... IX Appendix 2: Regressions’ Outputs ... XVIII
GLOSSARY
GEN Global Ecolabelling Network PI Purchase Intention
CHAPTER 1: INTRODUCTION 1.1 Background and problem statement
Nowadays environmental issues have become increasingly important. Consumers began to make their purchase decisions according to their environmental and ethical concerns because they realized that their purchase behavior and consumption have a direct impact on the Environment (De Chiara, 2015; Laroche, M., Bergeron, J., & G.Barbaro-Forleo, 2001; Mei, Ling, & Piew, 2012; Rundh, 2005).
The ecologically conscious marketplace has thus increased since consumers are becoming more environmental concerned and aware of the impact of their consumption on the Environment (Laroche et al., 2001). Therefore, products that are environmental friendly - green products as they are called in literature (Mei, et al., 2012; Tanner & Kast, 2003) - are becoming a preference choice among consumers. Environmental motivations are one of the reasons for consumers to buy green products. For example, ecologically conscious consumers are more likely to buy green products (Cai et al., 2017; Roberts & Bacon, 1997). Consumers who prefer this type of products because of environmental issues are commonly called green consumers (Laroche et al., 2001).
To identify green products there are labels established by the International Organization for Standardization: the eco-labels. These eco-labels are a mark or a logo awarded that attest the fulfilment of several environmental criteria. Usually, eco-labels signal ethical qualities about products, like fair-trade, labor practices, animal rights, environmental orientation, energy efficiency, among others (Pancer, McShane, & Noseworthy, 2015).
Atkinson and Rosenthal (2014) noted that eco-labels are typically well received by consumers and generate positive perceptions of environmental friendliness (mostly for low-involvement products). Furthermore, there are consumers who like to think themselves as environmentally conscious and because of that they prefer to buy eco-labeled products as a reflection of this ideal (Stokes & M. Turri, 2015). Despite all this, some literature suggests that there is some skepticism about green products among consumers (Cai et al., 2017).
Still, a review of the existent literature indicates that the attitude towards eco-labels may vary according to several factors, such as consumer awareness of eco-labels and the demographic profile of consumers (Cai et al., 2017; D’Souza, Taghian, Lamb, & Peretiatko, 2006; Teisl,
Rubin, & Noblet, 2008), as well as environmental motivations (Cai et al., 2017; Roberts & Bacon, 1997).
Thereby, considering that eco-labels and packaging are important elements affecting purchase intention (Butkeviciené, Stravinskiené, & Rutelioné, 2008; Clement, 2007; Jerzyk, 2016; Kuvykaite, Dovaliene, & Navickiene, 2009; Silayoi, Pinya; Speece, 2004; Underwood, Klein, & Burke, 2001), this thesis will try to understand what elements have more influence on purchase intention when communicating eco-labels: colour or claim.
1.2 Problem Statement
The scope of this research is to understand how the use of eco-labels on packaging influences purchase intention. For this purpose, the use of eco-labels as a way of communicating environmental orientation or concern will be studied as a determinant of purchase intention. Moreover, eco-labels will be analyzed in its visual (colour) and informational (claim) elements in order to understand if there is any difference on the purchase intention between eco-labels that contains more visual elements related to environmental issues or more informational elements. Furthermore, it will be also study the impact of eco-label awareness on purchase intention.
Hence, the problem statement of this thesis is:
When using eco-labels on packaging communication (visual vs informational), what elements impacts more consumer’s purchase intention?
It can be expressed through the following research questions:
RQ1: What is the impact of the use of eco-labels on consumers’ purchase intention? RQ1a: How does the visual elements (colour) impact the consumers’ purchase intention? RQ1b: How does the visual elements (green colour) impact the consumers’ purchase intention?
RQ1c: How does the informational elements (claim) impact the consumers’ purchase intention?
1.3 Relevance
As mentioned before, the market of environmentally friendly products is increasing over the years. Because of that and because results from several studies indicate that the use of eco-labels have impact on consumers purchase intention, this thesis has both academic and managerial relevance, particularly because this type of labels are increasing their influence among different products. Research indicates that adding an eco-label to a product generates positive reactions from consumers, especially in low-involvement products (Atkinson & Rosenthal, 2014), being an effective lead to purchase intention (Mei et al., 2012; Rashid, 2009). According to Silva, Bioto, Efraim, & Queiroz (2017), in 2012 the influence of eco-labels for coffee was 40% comparing to the world’s overall production.
Packaging conveys descriptive and persuasive information that allows consumers to know more about the product (Bassin, 1988). This way, eco-labels are used on packaging to convey a message that the product is environmentally friendly. As Atkinson and Rosenthal (2014) argued, eco-labels are often the way to consumers identify a green product, communicating the fulfilment of several environmental criteria.
In terms of academic relevance, this study will aggregate theory about packaging communication, the use of labels, visual and verbal elements, purchase intention and eco-label awareness, so that new conclusions can be drawn.
In a managerial perspective, the relevance of this subject lies in the growing consumer awareness of environmental issues, as mentioned before (Cai et al., 2017). As Banerjee & Solomon (2003) noted, environmental claims and eco-labels have been increasingly used since 1980’s. Furthermore, the results obtained in this study can help companies that are creating new eco-labels, to create a logo that communicates better the environmental friendly nature of their products.
In a marketing point of view, the use of eco-labels is a way to communicate the environmentally friendly dimension of the product to consumers (Atkinson & Rosenthal, 2014; Cai et al., 2017). Thus, studying the impact of eco-labels is important because its usage has grown among marketers, since it is a way to promote the identification of green products (D’Souza et al., 2006). As Testa, Iraldo, Vaccari, & Ferrari (2013) stated, environmental marketing is getting more and more importance. Consequently, and because of the ecologically conscious marketplace’s growth, it is important to integrate a “green marketing”
perspective into business, specifically in the marketing field. Additionally, and in order to reinforce the importance of the subject, Laroche et al. (2001) found that the number of consumers willing to pay more for environmentally friendly products is large enough to call marketers’ attention.
The aim of this thesis is to understand what elements of eco-labels impacts more purchase intention: colour or claim. The impact of consumers’ awareness of eco-labels on purchase intention will be studied as well.
1.4 Research methods
To collect the necessary data for this thesis both primary and secondary data were used. Secondary data was collected by making a literature review of the presented topics in study, such as packaging communication, purchase intention, eco-labels, visual and informational elements and awareness of eco-labels.
Primary data was collected through an online survey questionnaire, tested previously on a pilot questionnaire. After, data was analyzed, conclusions were drawn and this thesis’ hypotheses were answered.
1.5 Dissertation outline
The next chapter presents a literature review that explains and describes the relevance of the variables used to investigate what elements of eco-labels impacts more purchase intention: colour or claim. Still in this chapter, the development of the hypotheses that guides this study is displayed.
The third chapter presents the methodology used to answer the research questions. For this purpose, the chapter is composed by the constructs that constitute the questionnaire and the procedure.
The fourth chapter contains the results and findings obtained with the questionnaire conducted.
Finally, the fifth chapter presents conclusions and dissertation’s limitations and indications for further research in this area of study.
CHAPTER 2: LITERATURE REVIEW AND CONCEPTUAL FRAMEWORK
The following chapter is a literature review about the relevant topics of this thesis. For this purpose, findings, definitions and arguments of previous studies were summed up, compared and criticized so that a theoretical framework for the research questions of this thesis could be built.
Foremost, there’s a presentation and literature review of this thesis’ main concepts, such as purchase intention – as dependent variable -, packaging communication, eco-labels, visual and informational elements of eco-labels – as independent variables.
At last, a conceptual framework is drawn along with the hypotheses synthesized in the model. Therefore, this part gives an overview about the construct of the study considering the interdependencies between the variables and all the hypotheses stated.
2.1 Purchase Intention
Before buying a product, consumers idealize and have an expectation on products’ use. Thus, the level of satisfaction of these expectations is crucial for consumer’s purchase intention (Kupiec & Revell, 2001). As Spears & Singh (2004:56) defined, purchase intention is “an individual’s conscious plan to make an effort to purchase a brand”.
According to Kotler & Keller (2009), consumer decision making process is generally composed by five stages: problem identification, search for information, evaluation of alternatives, decision to purchase and post-purchase behavior. This way, purchase decision is a result of an evaluation of the product and competitors’ products, and so it can either be a plan or be an immediate reaction.
For the purpose of this thesis, it is important to understand that there are people who prefer to buy products that don’t have a serious negative impact on the Environment – green products – over the conventional ones, which according to Rashid (2009) and Aman, Harun, & Hussein (2012) can be named as green purchase intention.
In addition, it is also important to note that sometimes there’s a gap between intention and behavior: sometimes people say they want to buy something not because they want it genuinely, but because they are expressing a self-ideal or the ideal they think society accept (Hawkins, Farrington, & Catalano, 1998).
2.2 Packaging Communication: the use of Eco-Labels 2.2.1 Packaging
Packaging is a product container (Kotler & Keller, 2009), a protection cover that provides information about the product to costumers (Nickels & Jolson, 1976). It has also a logistic function, since it allows product handling and storing (Bassin, 1988; Nickels & Jolson, 1976; Prendergast & Pitt, 1996).
Nevertheless, packaging has a significant role in marketing, since it is a vehicle for communication and branding (Garber, Burke, & Jones, 2000; Kotler & Keller, 2009; Rettie, Ruth; Brewer, 2000). It gives symbolic cues to consumers about product’s benefits and its difference from competitors (Nickels & Jolson, 1976), as well as it communicates brand identity (Gómez, Martín-Consuegra, & Molina, 2015). Moreover, packaging conveys descriptive and persuasive information that allows consumers to know more about the product and to identify it with a brand (Kotler & Keller, 2009; Bassin, 1988). This way, package can highlight the uniqueness and originality of a product (Silayoi & Speece, 2007), being an important element for consumer decision making process, since it allows to distinguish between products (Clement, 2007; Nickels & Jolson, 1976).
As Nickels & Jolson (1976) argued, packaging is not only a way to communicate product’s features but also to broaden consumer perceptions of the product’s benefits. Furthermore, packaging is important in terms of a company’s brand image, because it enhances recognition of the company (Rundh, 2005), especially if it is distinctive from competitors.
According to Kotler & Keller (2009), product choice at the point of purchase is encouraged by packaging, as it is the first encounter between consumer and product. Package is a way to attract consumers to buy a certain product by improving its brand image and influencing consumer’s perception about the product (Kuvykaite et al., 2009). This way, packaging is a way to influence consumer decision-making process at the store, since the communication elements in the package influences the choice (Butkeviciené et al., 2008; Jerzyk, 2016; Silayoi & Speece, 2007). Furthermore, packaging is the last moment to persuade consumers to buy the product rather than competitors’ product (Jerzyk, 2016; McDaniel & Baker, 1977). A literature review on this topic also indicates that package and its elements have impact on consumer’s overall purchase decision (Butkeviciené et al., 2008; Clement, 2007; Jerzyk, 2016; Kuvykaite et al., 2009; Silayoi & Speece, 2007; Underwood et al., 2001; Ares &
Deliza, 2018), although this impact may be different depending on the consumer’s involvement level, time pressure and/or individual characteristics (Butkeviciené et al., 2008; Silayoi & Speece, 2007). Here, Butkeviciené et al. (2008) argue that the more time consumers have to make a decision, the less the impact of the package.
All these considerations reveal the importance of packaging in purchase decision and therefore the importance of packaging research as a way of maximizing the effectiveness of package in a store (Kuvykaite et al., 2009). Besides, packaging is a powerful tool capable to change product perception and create a new market position (Rundh, 2005).
Regarding packaging elements, there is no agreement in literature about its classification and importance. Silayoi & Speece (2004) separate visual and informational elements. Graphics, colour, shape and size are considered as visual elements, related to the affective side of the decision-making process, while informational elements are associated to information and the cognitive side of the decision and thus it is expressed by conveying information about producer, country of origin, brand and technology. Differently, Underwood et al. (2001) don’t consider verbal elements of package, but distinguish graphic elements such as colour, typography, shape and images, from structural elements, including form, size of containers and material. To Vladić, Milica, Kašiković, Magdolna, & Mladen (2015) graphic design, material, colour and shape are the most important packaging elements. For Spence & Velasco (2018), colour is the most important packaging element, especially on online sales. Accordingly, (Garber et al., 2000) have chosen to study colour because they consider it as the dominant visual feature because if it is changed it doesn’t affect package’s function, unlike package shape. On the other hand, Kotler & Keller (2009) pointed out six different packaging elements - size, shape, material, colour, text and graphics - although they give more prominence to colour, since it is an “important aspect of packaging”, according to them. In turn, Kuvykaite et al. (2009) summarizes all this different points of view in two main blocks of packaging elements: visual and verbal elements. The first ones are graphic, colour, size, shape and material, while the second ones are information about the producer, country-of-origin and brand. Besides, Ares and Deliza (2010) as well as Ampuero & Vila (2006) reveal the importance of shape and colours in package design. Magnier & Schoormans (2017) differentiate packaging elements into tree main categories: structure, graphics and textual informational/claim. Structure includes shape, weight and materials, while graphics includes colours, photographs, images and logos. At the informational level, all the textual information
that describes the product and package, either claims or scientific description, is included. Thus, Magnier & Schoormans (2017) defend that to communicate environmentally friendly attributes, it is crucial to consider all this elements, particularly graphical and textual elements, since sometimes structure elements may sometimes be not so explicit as the other ones. In addition, these authors indicate that prior studies show that shapes and colours send cues for consumers to evaluate brands. For instance, Becker, Rompay, Schifferstein, & Galetzka (2011) concluded through their study that consumers with higher sensitivity to design rate differently yoghurt’s taste regarding the its package form, being the angular shape more associated with an intense flavour when compared to rounded shape package yoghurt. All in all, packaging has multiple purposes and because of that it is a source of interest not only in terms of research but also from a managerial point of view, starting forthwith because packaging can have strong impact on sales (Twedt, 1968) specially because it is a crucial factor in communication at the point of sale (Silayoi & Speece, 2007).
2.2.2 Eco-labels
In physical terms, a label can be either a simple attached tag or a designed graphic that constitutes the package and might describe the product (Kotler & Keller, 2009). As part of package, labels are an important tool to consider when thinking about increasing consumers’ purchase intention, since food product expectations can be generated from packaging, labelling and product information (Silayoi & Speece, 2007).
According to the international standards established by the International Organization for Standardization (Secretariat, 2012), the ISO 14020:2000 is the international standard that sets the general principles for the development and use of environmental labels and declarations. There are three types of environmental labelling: Type I – eco-labels; Type II – self-declared environmental claims; Type III – environmental declarations.
Hence, Type I environmental labelling (eco-labels) can be defined as a mark or a logo awarded based on the fulfilment of various environmental criteria. According to International Standard Organization, the eco-labels’ purpose is to educate and increase consumer awareness of environmental impacts of a product, encouraging them to buy products with lower environmental impact. Thereby, eco-labels are often a way for consumers to identify a green product (Atkinson & Rosenthal, 2014).
ISO 14024 provides the requirements for operating an ecolabelling scheme with several principles that must be fulfilled for awarding the eco-label. This standard was adopted by the Global Ecolabelling Network (GEN), the international network of ecolabelling organizations, that currently works to promote, develop and consolidate all the ecolabelling programs around the world (GEN POSITION ON THE ISO 14024 STANDARD: Type I Environmental
Labelling, 1999).
From a marketing point of view, eco-labels can be also defined as a tool used to communicate that a product is environmentally friendly and that has socially desirable characteristics to the final consumer (Cai et al., 2017). As Rotherham (1999) wrote, eco-labels are designed to help consumers in their judgement and choice between similar products. In other words, eco-labels can help consumers to make well-informed decisions at the moment of the purchase (Stokes & M. Turri, 2015). It is a way to influence consumers to have environmentally friendly behaviors (Delmas & Lessem, 2015).
Summing up, eco-labels give information about the environmental impact of the product, both in its production and in its usage (Rotherham, 1999). It also signals various ethical qualities about products, such as fair-trade, labour practices, animal rights, environmental orientation, energy efficiency, among others (Delmas & Grant, 2014; Pancer et al., 2015).
In addition, GEN consider that eco-labels are preferable to any “green” symbols or claim statements used by manufacturers and/or services providers because the attribution of eco-labels is dependent on impartial third parties that will verify all the requirements determined according to life-cycle considerations of the product (GEN POSITION ON THE ISO 14024
STANDARD: Type I Environmental Labelling, 1999). As D’ Souza et al. (2006) stated, this
process confers credibility to the label itself since it involves an independent third-party assessment of a firm’s environmental standards.Similarly, De Chiara (2016) affirmed that the perceived credibility of environmental claims is essential to build strong environmental associations. In fact, purchase intention of consumers that trust in a given environmental information that it is conveyed on the packaging is affected if their attitude towards the message is favourable (Jerzyk, 2016). In terms of credibility, there is literature showing that consumer perceived credibility of eco-labels impacts purchase intention (Cai et al., 2017; Teisl et al., 2008), even though this credibility varies according to certification agencies and domestic markets (Sønderskov & Daugbjerg, 2011). In addition, consumers use labels in their decision-making process only when they trust them (Bui, 2005; Mei et al., 2012).
Although Atkinson & Rosenthal (2014) noted that eco-labels are typically well received by consumers and generate positive perceptions of environmental friendliness (mostly for low-involvement products), a review of the existent literature indicates that the attitude towards eco-labels may vary according to several factors, such as consumer awareness of eco-labels and the demographic profile of consumers (Arslanagić, Peštek, & Kadić-Maglajlić, 2014; Cai et al., 2017; D’Souza et al., 2006; Teisl et al., 2008), as well as environmental motivations (Cai et al., 2017; Roberts & Bacon, 1997).
Lastly, according to Testa, Iraldo, Vaccari, & Ferrari (2013) eco-labels knowledge is a significant predictor of green purchasing intention. Nevertheless, sometimes eco-labels may send confusing messages to consumers, so it is important that eco-labels communicate clearly their message, specially what are the environmental attributes and benefits that they are awarding (Delmas & Lessem, 2015).
2.2.2.1 Visual and Informational Elements of Eco-Labels
As stated in the literature review about packaging communication, packaging has two main different elements: visual and informational. As Underwood et al. (2001) mentioned, visual and verbal information are important to maximize communication effectiveness at the point of purchase. Both are important for consumers to form judgements (Childers, Houston, & Heckler, 1985).
Usually in advertisements visual information attracts more attention than verbal content ( Underwood et al., 2001) and the information presented in pictures is learnt quicker than the information presented in words (Underwood et al., 2001). Additionally, studies indicate that when products or brands are unfamiliar to consumers they generally prefer visual information over verbal (Townsend & Kahn, 2014). Visual information may serve to set expectations for the contents of the verbal elements (Underwood et al., 2001).
For the purpose of this thesis, eco-labels will be considered as a visual element regarding this distinction made by Silayoi & Speece (2004), but they will be studied has having also both visual and informational elements. The scope is to understand in what extent colour and claim impacts purchase intention. Along with this, it will be studied if the green colour impacts purchase intention, since literature support its importance (Cavallo & Piqueras-Fiszman, 2017; Kotler & Keller, 2009; Pancer et al., 2015; Sundar & Kellaris, 2015). Although the elements’ placement is important (in this case the eco-label’s placement), mostly because of
the concept of brain laterality (Silayoi & Speece, 2007; Rettie & Brewer, 2000) it will not be studied in this thesis since it isn’t its purpose.
As a visual elements, the colour will be analysed since studies recognize that using colour as a cue can potentiate a strong association between a given theme/subject and a product. Research about brands logos indicate that consumers’ symbolic associations are generated by a logo’s shape (Becker et al., 2011; Fajardo, Zhang, & Tsiros, 2016; Jiang, Gorn, Galli, & Chattopadhyay, 2016) and colour (Fajardo et al., 2016; Madden, Hewett, & Roth, 2000). Both elements are important to shape consumers’ perception of the brand (Keller, 1993), especially if it is unfamiliar to them (Magnier & Schoormans, 2017; Sundar & Kellaris, 2015). Furthermore, variations in colour influence purchase intention (Babin, Hardesty, & Suter, 2014). Spence & Velasco (2018) have studied the impact of packaging colour regarding its hue (broad colour category), brightness (amount of black/white added to the hue) and saturation (intensity of the hue).
In this case, the usage of green colour on packaging has a strong association with environmentally friendliness and orientation as well as organic or recycled products (Cavallo & Piqueras-Fiszman, 2017; Kotler & Keller, 2009; Pancer et al., 2015; Sundar & Kellaris, 2015). In general, green is connotated positively and it usually stimulates good environmental behaviors (Bock, Pandelaere, & Kenhove, 2013). This way, the presence of green in a logo convey an eco-friendly and a socially responsible message, according to Sundar & Kellaris (2015). In addition, the authors suggested that the connotative meaning of colour green is more powerful in a logo than the verbal word green usually used in branding strategy to evoke environmental responsibility.
Despite all mentioned above, it is important to understand that the colours’ meaning changes regarding consumer’s culture as well as through different market segments (Kotler & Keller, 2009; Madden et al., 2000; Silayoi, Pinya; Speece, 2007). However, as Spence & Velasco (2018) stated, the more abstract the concept, the easier the association of a colour with it. As informational elements the claim written on the eco-label will be analysed in order to understand if the eco-labels’ claim impacts purchase intention.
Furthermore, since Underwood et al. (2001) claimed that visual content has a higher impact on a product’s attention than verbal content, visual elements of an eco-label might thus have a higher impact on purchase intention than informative elements of an eco-label.
Based on the findings described so far, the first hypotheses can be conducted: H1a: Colour positively impacts consumer’s purchase intention.
H1b: Green Colour positively impacts consumer’s purchase intention. H1c: Claim positively impacts consumer’s purchase intention.
H1d: Eco-labels’ green colour have a higher impact on consumer’s purchase intention than eco-labels’ claim on the logo.
Despite the differentiation made above, eco-label awareness will be also studied, since it is identified in literature as a key element for purchase intention (McEachern & Warnaby, 2008; Rashid, 2009; Testa et al., 2013).
2.3 Consumer Awareness of Eco-Labels
According to Banerjee & Solomon (2003), consumer awareness designates to what extent consumers know of the program’s existence. The same authors argue that understanding means “how thoroughly a consumer can interpret the connection between the environmental issue, the label’s meaning, and actions needed to elicit results” (Banerjee & Solomon, 2003: 109).
Despite the difficulty to promote sustainable consumption behavior (Cornelissen, Pandelaere, Warlop, & Dewitte, 2008), environmental awareness has increased since the early 1970’s (Cai et al., 2017; Kilbourne & Pickett, 2008). However, Alwitt & Pitts (1996) argued that regardless of this higher awareness, there is an attitude-behavior gap, which means that the consumers’ motivations to use environmental friendly product or services often conflict with their environmental concerns.
The importance of knowing the eco-labels is indicated by McEachern & Warnaby (2008) as an important factor to influence purchase intention, especially for animal welfare labelled products. In fact, Testa et al. (2013) have indicated that eco-labels knowledge is a significant predictor of green purchase intention and Rashid (2009) has referred that consumer awareness of eco-labels has a positive effect between knowledge of green products and consumer’s intention to purchase.
Purchase Intention At the same time, there are also studies demonstrating that consumers do not always understand environmentally friendly labels attached to products (Kangun & Polonsky, 1995) and that eco-label awareness doesn’t influence automatically purchase intention, mostly because consumers have difficulties in associating environmental problems with products – its production and use (Leire, C., & Thidell, 2005).
Taking into account what’s been said above, the second hypothesis can be drawn: H2: Awareness of eco-labels positively impacts consumer’s purchase intention.
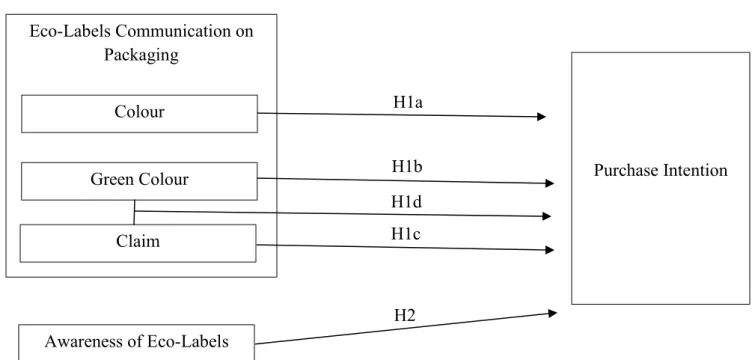
2.4 Conceptual Framework Eco-Labels Communication on Packaging Awareness of Eco-Labels Green Colour H1d H1a H1b H2 Colour H1c Claim
CHAPTER 3: METHODOLOGY
The following chapter presents and justifies the methodology of this thesis. It explains how the research questions are going to be studied and shows how the hypotheses from the previous chapter are addressed.
In the first place, the research approach will be defined, describing how objectives will be achieved, followed by a summary of the primary and the secondary data used for the study. Lastly, the approach of primary data collection will be described and explained in detail, as well as the measurement and data analysis techniques used.
3.1 Research Approach
The eco-labels analyzed in this thesis were selected from the website Eco Label Index1 where there is a list of the 37 eco-labels in Portugal. Among those, the eco-labels chosen were those that are awarded to food products regarding its production and the product itself. The labels awarded to sustainable packaging were not considered, since sustainable and environmentally friendly packaging isn’t the scope of this thesis. To make clear, eco-labels are awarded regarding different areas, fulfilling different specific requirements of each area, reason why a given eco-label aiming to reward the environmentally friendly practices of production is not the same that communicates environmentally friendly practices. Thus, the investigation is rather focused only on food products and its production.
The objective of this study is to understand to what extent the colour and claim of eco-labels affect purchase intention by reviewing literature about the subjects related to this thesis. Plus, the impact of eco-labels’s awareness on purchase intention will be also measured. This way, the eco-labels selected to conduct this study are merely a means to arrive at conclusions, since it is not intended to study exactly the impact of each logo on the purchase intention, but rather to understand the impact of eco-labels' colour, claim, and awareness in general.
To answer the hypotheses stated previously on chapter two, a quantitative approach was applied to investigate whether the hypotheses were confirmed or rejected. Thereafter, an online survey was designed and conducted, followed by an analysis of the data collected.
3.2 Secondary Data
Secondary data was used largely in form of articles from top journals and publications. Other information sources were used, such as websites and reports from the International Organization for Standardization and from The Global Ecolabelling Network (GEN
POSITION ON THE ISO 14024 STANDARD: Type I Environmental Labelling, 1999;
Secretariat, 2012).
This kind of data was fundamental to develop the previous chapter – the literature review – but also to build up the methodology chapter and to contribute for the overall thesis, since it is essential to support concepts, research questions and hypotheses, conceptual model and conclusions.
3.3 Primary Data
To answer this thesis’ hypotheses, primary data was collected through an online survey questionnaire. To better meet the research objetives, a pilot study was conducted, followed by the main study. The survey questionnaire distributed on the pilot study was similar to the main study. With the feedback obtained on the first study it was possible to make improvements to the main test survey questionnaire.
3.3.1 Pilot Study: Survey Questionnaire
Between the 17th January 2019 and the 19th January 2019 the pilot online survey questionnaire has been spread via social media channels and email.
In total 14 responses had been collected but due to exclusions made accordingly to the control question present on the survey, only 12 responses were valid.
Since all the Cronbach’s alpha values were higher than 0.7, the survey was considered reliable and thus had been taken for further analysis.
However, participants gave valuable feedback in order to clarify some aspects of the survey questions. This allowed the final questionnaire to be clearer.
3.3.2 Main Study: Survey Questionnaire 3.3.2.1 Data Collection
Between the 20th February 2019 and the 6th March 2019 an online survey questionnaire has been spread via social media channels and email.
The survey begins with a description of the study, followed by a control question to guarantee that all respondents are people who bought food products during the last year. Respondents who do not fulfil this condition were automatically excluded.
The survey was launched in English so that a large amount of people could understand it since the target of this survey wasn’t based on nationality or/and language.
Data was collected through non‐probability sampling techniques, convenience and snowball sampling, since it was spread essentially via my social media channels and e-mail. However, the techniques used were appropriated for this thesis because as Saunders et al. (2008) stated, non-probability sampling is a reasonable technique whenever the researcher has several resource and time constrains and the population is hard to specify.
In total, 350 fully completed responses were collected, but only 345 were valid. 3.3.2.2 Measurement / Indicators
First of all, a control question was asked “Did you buy any food product during the last year?”.
The survey comprised twelve different blocks of questions regarding each eco-label in study (see Figure 2). Those blocks were randomly assigned to the respondents. Each block included four main groups of questions.
Participants’ familiarity with the eco-label was checked by questioning participants “How familiar are you with this logo?”, with a 7-point scale anchored by “Very Familiar” (1) and “Very Unfamiliar” (7) (Bickart & Ruth, 2012).
Secondly, to understand how green colour impacts consumer perception of logo and its intention to buy a certain product, a question was created. Participants were asked to answer in a 7-point likert scale to what extent they agree with the following sentence: “The green colour is well represented in the following logo”.
To measure consumer perception of colour and claim, a construct from Sundar & Kellaris (2015) was adapted. Accordingly, it was asked how would participants rate the colour and the claim of the logo shown regarding the following items: eco-friendly (anchored: 1 = ‘‘not very eco-friendly,’’ 7 = ‘‘very eco-friendly’’), warm (anchored: 1 = ‘‘cold,’’ 7 = ‘‘warm’’), like (anchored: 1 = ‘‘dislike,’’ 7 = ‘‘like’’), pleasant (anchored: 1 = ‘‘not very pleasant,’’ 7 = ‘‘pleasant’’), strong (anchored: 1 = ‘‘weak,’’ 7 = ‘‘strong’’), and positive (anchored: 1 = ‘‘negative,’’ 7 = ‘‘positive’’). To answer this questions, participants were elucidated on what a claim is, since it was identified in the pilot test, through the participants' feedback, the need to define what is a claim.
Then, adapted from Sundar & Kellaris (2015), participants were asked about ‘‘How eco-friendly do you suppose a product is if it has in its packaging this eco-label?”. All measurements were rated on 7-point scale, (1) Not at all friendly to (7) Very Eco-friendly.
Furthermore, respondents were asked about logo attractiveness using a construct from Magnier & Schoormans (2017) used for packaging attractiveness. It was assessed on four
semantic differential scales (‘poorlooking/nice-looking’, ‘displeasing/pleasing’, ‘unattractive/attractive’, ‘ugly/beautiful’).
In order to assess purchase intention a construct tested previously by Spears and Singh (2004) was used. According to them, purchase intention can be measured at a 7-point semantic differential scale, asking to respondents their probability of buying the product (“I would never buy it – I would definitely buy it”, “I definitely do not intend to buy it – I definitely intend to buy it” and “I have very low purchase interest – I have very high purchase interest”). After the block of questions regarding the eco-label it-self, respondents were all asked about the same questions.
Firstly, to assess participants’ awareness of eco-labels they were asked to tell on a 7-point scale in what extent they agree with the following sentences: I think I have heard of eco-labels; I know eco-eco-labels; I am able to distinguish between products with eco-labels and without eco-labels. This construct was adapted from Kim & Kim, (2016).
To complement consumer awareness of eco-labels measurement, the consumer awareness model used by Silva, Bioto, Efraim, & Queiroz (2017) was also applied and adapted. Participants had to answer yes/no to the following questions: “Do you consider important to know the origin of the raw material used to manufacture the food product you eat?”; “Are you interested in certified products?”; “Do you know that eco-labels are used in food products?”; “Have you ever eat food products with eco-labels?”.
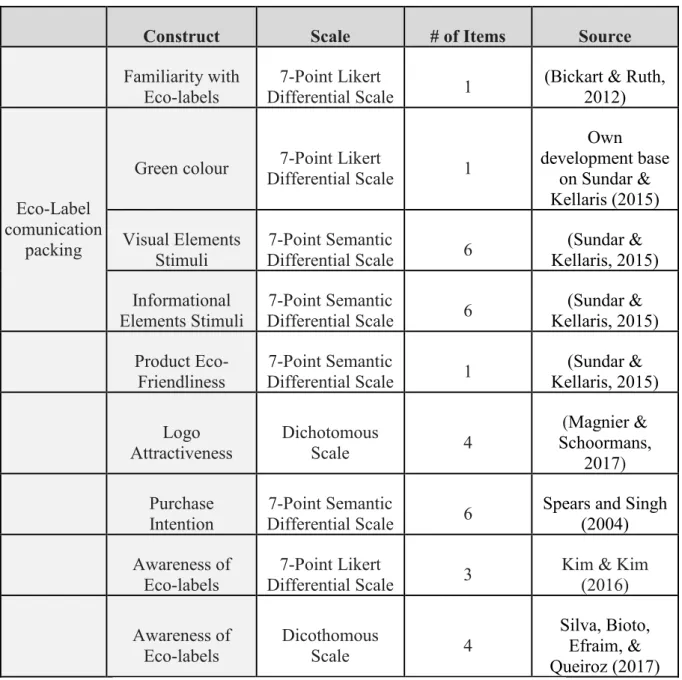
Construct Scale # of Items Source
Familiarity with
Eco-labels Differential Scale 7-Point Likert 1 (Bickart & Ruth, 2012)
Eco-Label comunication
packing
Green colour Differential Scale 7-Point Likert 1
Own development base on Sundar & Kellaris (2015) Visual Elements Stimuli 7-Point Semantic Differential Scale 6 (Sundar & Kellaris, 2015) Informational Elements Stimuli 7-Point Semantic Differential Scale 6 (Sundar & Kellaris, 2015) Product Eco-Friendliness 7-Point Semantic Differential Scale 1 (Sundar & Kellaris, 2015) Logo Attractiveness Dichotomous Scale 4 (Magnier & Schoormans, 2017) Purchase Intention 7-Point Semantic Differential Scale 6
Spears and Singh (2004) Awareness of
Eco-labels
7-Point Likert
Differential Scale 3
Kim & Kim (2016) Awareness of Eco-labels Dicothomous Scale 4 Silva, Bioto, Efraim, & Queiroz (2017) 3.3.2.3 Data Analysis
All quantitative data collected was analyzed using SPSS version 25.0.
In order to compare the packaging information in the eco-labels shown on the survey questionnaire, paired t test was used to identify if there is more informational content on the eco-label than colour, or if the information carried by the eco-label have both characteristics. Correlation analysis made through linear regression models were conducted in order to analyze the impact on purchase intention of the main predictors: colour, claim and awareness of eco-labels. The green colour on the eco-label was highly related with the emotions carried by the 6 items of colour (see Appendix 1, Block 2) which created a multicollinearity problem
in the regression model. Thus, an interaction variable was produced resulting from the product of green by eco-friendly colour. So, six linear regression models were estimated by OLS (Ordinary Least Squares is the estimation method of parameters in the regression models). The first four were created using only simple linear regression models with purchase intention as the dependent variable and each of the important variables in study (green colour, colour, claim and awareness of eco-labels) as predictors. The fifth model was estimated using purchase intention as dependent variable and all the previous variables as predictors. However, due to the high relation between green and colour, an interaction variable was used. Finally, the last model introduced, besides the previous variables, used all the demographic variables and familiarity with eco-label as predictors.
CHAPTER 4: RESULTS AND DISCUSSION
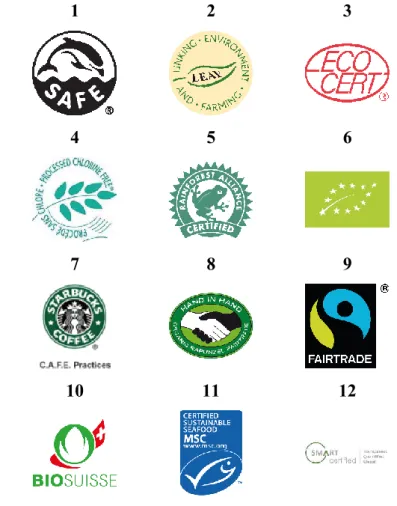
The next chapter is about the main results obtained in the data analysis described previously. First, the research sample will be analyzed and characterized, followed by a validation of the online survey and a description of the results obtained from the hypotheses testing. To close this chapter, a connection is made between the results presented and the research questions. To facilitate the interpretation of the data presented in this chapter, the figure below assigns a number to each logo used on the study. The eco-labels analyzed were selected among the 37 eco-labels present in Portugal. The ones that were selected were those that are awarded to food products regarding its production and the product itself.
This way, in the following tables of this chapter will only be mentioned the number, being always referred to the logo attributed below.
1 2 3
4 5 6
7 8 9
10 11 12
4.1 Sample characterization
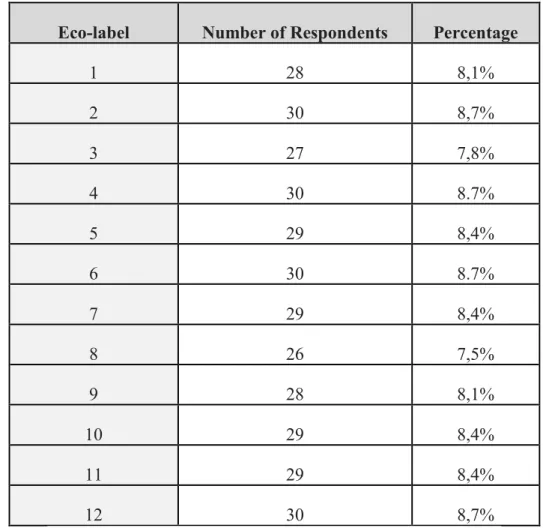
The online survey gathered 350 fully completed answers, being the sample size N=350. However, 5 respondents (1,4%) where excluded since they answered in the control question that they did not make purchases in the last year. Moreover, it was possible to verify that the sample distribution by eco-label is almost 1/12 of the total sample which can be seen by Table 2. Here, it is important to point out that all the respondents were randomly allocated to the twelve eco-labels, which ensured that all groups were homogenous.
Eco-label Number of Respondents Percentage
1 28 8,1% 2 30 8,7% 3 27 7,8% 4 30 8.7% 5 29 8,4% 6 30 8.7% 7 29 8,4% 8 26 7,5% 9 28 8,1% 10 29 8,4% 11 29 8,4% 12 30 8,7%
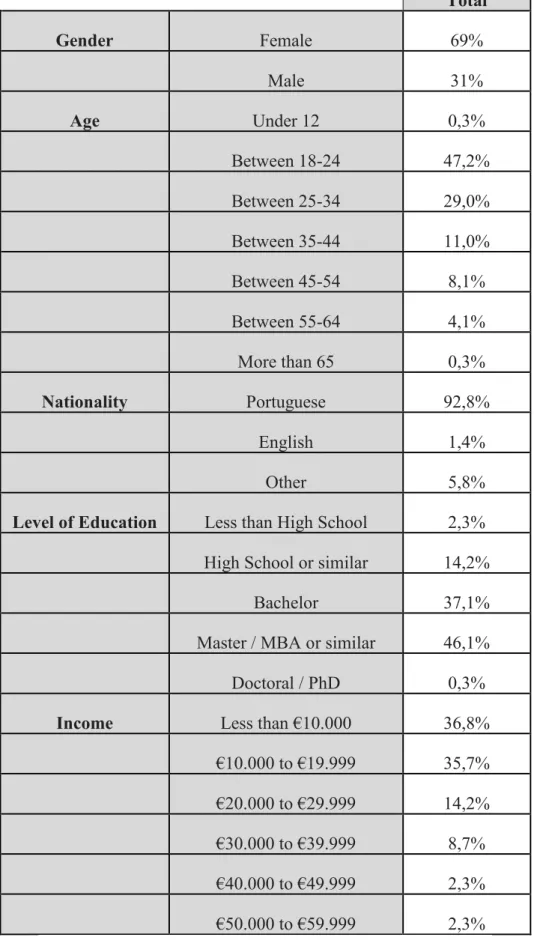
The demographic characteristics of the 345 respondents are presented in the Table 3 below, where it is possible to see the sample characterization by gender, age, nationality, level of education and income:
Total Gender Female 69% Male 31% Age Under 12 0,3% Between 18-24 47,2% Between 25-34 29,0% Between 35-44 11,0% Between 45-54 8,1% Between 55-64 4,1% More than 65 0,3% Nationality Portuguese 92,8% English 1,4% Other 5,8%
Level of Education Less than High School 2,3%
High School or similar 14,2%
Bachelor 37,1%
Master / MBA or similar 46,1%
Doctoral / PhD 0,3%
Income Less than €10.000 36,8%
€10.000 to €19.999 35,7%
€20.000 to €29.999 14,2%
€30.000 to €39.999 8,7%
€40.000 to €49.999 2,3%
€50.000 to €59.999 2,3%
Due to non-probability sampling, the large majority of respondents were Portuguese, aged between 18 and 24 and had an yearly income smaller than €10.000. Additionally, 69% of the respondents were female and 31%were male. Since the population of the respondents was not demographically restricted, the sample can’t be considered representative.
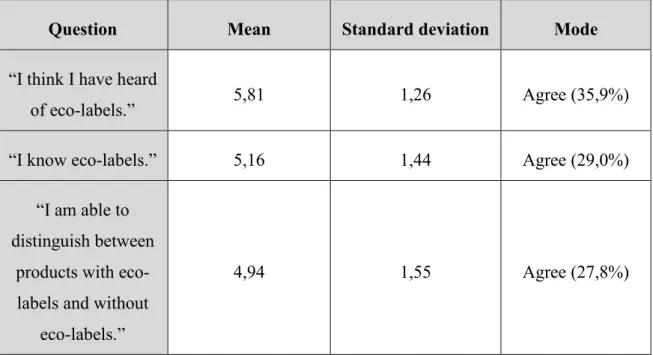
To analyze the consumers’ perception of eco-labels, a descriptive statistic of the questions present in Table 4 was made. Below, it is possible to see that more than half of the respondents think they heard of labels (mean of 5,81 on a 1-7 likert scale) and know eco-labels (mean of 5,16 on a 1-7 likert scale). Furthermore, the majority of respondents consider to be able to distinguish between products with eco-labels and without them, being the mean 4,94 on a 1-7 likert scale.
Question Mean Standard deviation Mode
“I think I have heard
of eco-labels.” 5,81 1,26 Agree (35,9%)
“I know eco-labels.” 5,16 1,44 Agree (29,0%)
“I am able to distinguish between
products with eco-labels and without
eco-labels.”
4,94 1,55 Agree (27,8%)
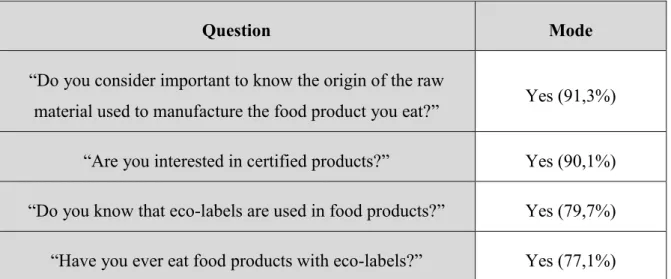
To complement the sample characterization, a descriptive statistic of the questions “Do you consider important to know the origin of the raw material used to manufacture the food product you eat?”; “Are you interested in certified products?”; “Do you know that eco-labels are used in food products?” and “Have you ever eat food products with eco-labels?” was made. Results can be seen in Table 5. Overall, the majority of respondents consider important to know the origin of the raw material usaed to manufacture the food products they eat, are interested in certified products, knows that eco-labels are used in food products and already have ate food products with eco-labels.
Question Mode “Do you consider important to know the origin of the raw
material used to manufacture the food product you eat?” Yes (91,3%)
“Are you interested in certified products?” Yes (90,1%) “Do you know that eco-labels are used in food products?” Yes (79,7%)
“Have you ever eat food products with eco-labels?” Yes (77,1%)
4.2 Measure reliability
Even though all items used in the survey were approved by previous literature and by the pilot test, the reliability of all constructs with more than 1 item used among this sample was checked.
Cronbach’s alpha is a measure usually used to verify the internal consistency of a construct answered in a likert scale and it is pointed out as the most important coefficient to measure accuracy (Maroco, 2010). The value of the coefficient allow us to verify the homogeneity of the constructs. The values above 0,70 show a satisfactory consistence.
Items 2, 3 and 5 of Purchase Intention question were recoded to a positive point of view by taking the difference of the actual answer to eight.
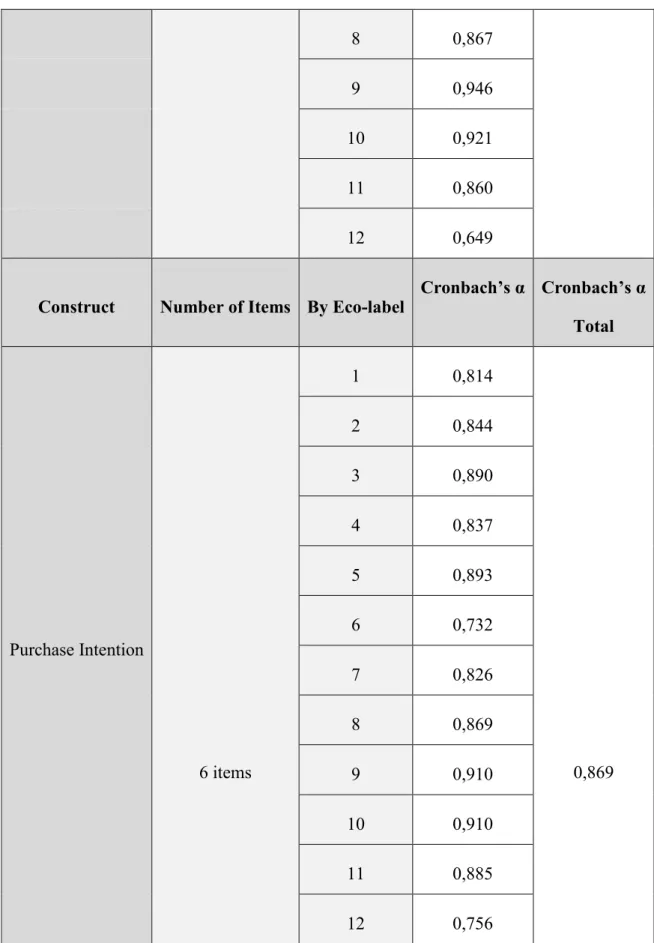
Construct Number of Items By Eco-label Cronbach’s α Cronbach’s α Total Colour 6 items 1 0,895 0,863 2 0,872 3 0,673 4 0,886 5 0,756 6 0,755 7 0,768 8 0,802 9 0,945 10 0,901 11 0,887 12 0,721 Claim 6 items 1 0,904 0,887 2 0,752 3 0,886 4 0,912 5 0,875 6 0,898 7 0,769
8 0,867
9 0,946
10 0,921
11 0,860
12 0,649
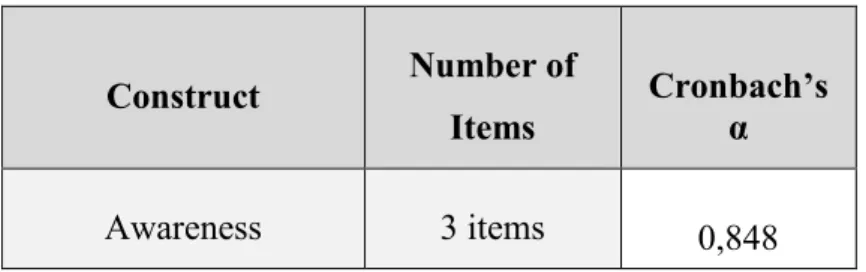
Construct Number of Items By Eco-label Cronbach’s α Cronbach’s α Total Purchase Intention 6 items 1 0,814 0,869 2 0,844 3 0,890 4 0,837 5 0,893 6 0,732 7 0,826 8 0,869 9 0,910 10 0,910 11 0,885 12 0,756
Construct Number of Items
Cronbach’s α
Awareness 3 items 0,848
In general and by eco-label, all constructs have good validity since Cronbach’s alpha is above 0,70. So, the data can be used to investigate the hypotheses of the present study.
4.3 Variables in Study
To use as regressors in the regression models, the following variables were created as the mean of the answers in each item: purchase intention, colour, claim and awareness of eco-labels. Demographic variables (nationality, education level and income) were recoded into dummy variables (see Table 8).
Variable Description
Dependent Variable
Purchase Intention (PI)
Composite measure of the 6 items, taking the mean of the answers in each item,
Metric Independent Variables Pr ed ict or s Green (G)
Item: “The green colour is well represented in the logo” in a Likert 1 to 7
scale, Interval
Colour (CO)
Composite measure of the 6 items, taking the mean of the answers in each item,
Metric
Claim (CL)
Composite measure of the 6 items, taking the mean of the answers in each item,
Metric Green Colour
(GCO)
Product of Green by ecofriendly colour, Metric
Awareness of Eco-labels (AWAR)
Composite measure of the 3 items, taking the mean of the answers in each item,
Metric
Contr
ol Var
iab
les
Gender (GENDER) 0 – female; 1 – male, Dummy Nationality (NAT) 0-Portuguese; 1- otherwise, Dummy
Age (AGE) 0- Under 24; 1- Above 25, Dummy Education level
(EDUC)
0-Under High School; 1 – Above or equal to Bachelor, Dummy
Income (INC) 0 – under 30000; 1- above 30000, Dummy Familiarity with
Eco-labels
Item: “How familiar are you with this logo?” in a Likert 1 to 7 scale, Interval
4.4 Results from the Hypotheses Testing
4.4.1 Differences of colour and claim by Eco-label
A paired-sample t-test was performed to check if in each eco-label shown there was “more colour than packaging information”. Overall, the results indicate that the majority of eco-labels were considered by respondents with equal colour and claim or more claim than colour (see Table 9).
Below, it is also indicated the familiarity of participants with the eco-labels (remembering, each participant viewed an eco-label that was assigned to him randomly), being most of the eco-labels “very unfamiliar”.
Eco-label Colour (mean, std dev) Claim (mean, std dev) t-test (sig) Claim vs Colour Familiarity (Mode) 1 4,185 (1,650) 5,137 (1,501) -3,553 (0,001) More Claim Very Unfamiliar 2 4,628 (1,144) 4,889 (0,912) -1,695 (0,101) Equal Very Unfamiliar
3 3,605 (1,150) 4,191 (1,456) -3,011 (0,006)
More Claim Very
Unfamiliar 4 4,883 (1,161) 5,061 (1,358) -1,295 (0,205) Equal Very Unfamiliar 5 5,282 (0,904) 5,213 (1,218) 0,412 (0,684)
Equal Very Familiar
6 5,989 (0,745) 5,206 (1,089) 4,662 (0,000)
More Colour Very Unfamiliar 7 5,259 (0,806) 4,453 (0,922) 3,894 (0,001)
More Colour Very Familiar
8 5,532 (0,785) 5,135 (0,915) 2,780 (0,010)
More Colour Very Unfamiliar 9 4,310 (1,783) 4,571 (1,823) -2,467 (0,020)
More Claim Very
Unfamiliar 10 4,621 (1,643) 4,563 (1,630) 0,780 (0,442) Equal Very Unfamiliar 11 4,489 (1,467) 4,943 (1,430) -3,932 (0,001)
More Claim Very
Unfamiliar 12 4,539 (0,924) 4,644 (0,917) -0,712 (0,482) Equal Very Unfamiliar
4.4.2 The Impact of Colour, Claim and Awarenes of Eco-labels on Purchase Intention The Hypotheses H1a, H1b, H1c and H2 propose that colour, green colour, claim and awareness of eco-labels (respectively) positively impacts purchase intention. In order to identify the impact of these predictors, several regression models were built.
Firstly, Pearson’s correlations between predictors and purchase intention were made (see Table 10). Variables Green Colour by Colour
Colour Claim Awareness Green Colour
Green Colour by Colour 1 Colour ,557*** 1 Claim ,290*** ,733 *** 1 Awareness ,133* ,134 * ,081 1 Green Colour ,799*** ,741 *** ,437*** ,144** 1 Purchase Intention ,257*** ,553 *** ,603*** ,270*** ,415***
*** Significant at p<0,1% , ** Significant at p<1% , * Significant at p<5%
Table 10: Pearson Correlations between Predictors and Purchase Intent
Analyzing Table 10, it is concluded that claim and colour are the most related predictors with purchase intention. However, ‘colour and claim’ and ‘green and colour’ are highly related, which could create a multicolinearity problem in a regression model if put together.
H1a: Colour positively impacts consumer’s purchase intention.
The linear regression model 1 (𝑃𝐼̂ = 𝛽𝑖 1+ 𝛽2𝐶𝑂𝑖 i=1,...,345), where PI represents purchase Intents and CO the colour in Eco-Label, may answer the hypothesis if the slope of the model 2 is positive.
*** Significant at p<0,1% , ** Significant at p<1% , * Significant at p<5%
Based on the value present above, it is possible to say that 30,5% of the purchase intention variation can be explained by the colour of the eco-labels and it has a significant positive impact on purchase intention. Thus, H1a is verified.
H1b: Green Colour positively impacts consumer’s purchase intention.
The linear regression model 2 (𝑃𝐼̂ = 𝛽𝑖 1+ 𝛽2𝐺𝑖 i=1,...,345), where PI represents purchase intention and G the intensity of green colour present on the eco-label, may answer the hypothesis if the slope of the model 2 is positive.
Green 0,148*** Purchase Intention
*** Significant at p<0,1% , ** Significant at p<1% , * Significant at p<5%
As explained above, 6,6% of the purchase intention variation can be explained by green colour on eco-labels. Similar to model 1, this model 2 reveals that green colour has a significant positive impact on purchase intention. Therefore, H1b is verified.
H1c: Claim positively impacts consumer’s purchase intention.
The linear regression model 3 (𝑃𝐼̂ = 𝛽𝑖 1+ 𝛽2𝐶𝐿𝑖 i=1,...,345), where PI represents purchase intention and CL the claim present on the eco-label, may answer the hypothesis if the slope of the model 2 is positive.
Claim 0,538*** Purchase Intention
*** Significant at p<0,1% , ** Significant at p<1% , * Significant at p<5%
Once more, it was verified that 36,4% of the purchase intention variation can be explained by claim. In fact, claim has a significant positive impact on purchase intention (H1c is verified).
H2: Awareness positively impacts consumer’s purchase intention
The linear regression model 4 (𝑃𝐼̂ = 𝛽𝑖 1+ 𝛽2𝐴𝑊𝐸𝑖 i=1,...,345), where PI represents purchase intention and AWE is the consumers’ awareness of eco-labels, may answer the hypothesis if the slope of the model 2 is positive.
*** Significant at p<0,1% , ** Significant at p<1% , * Significant at p<5%
Based on the value present above, it is possible to say that 7,3% of the purchase intention variation can be explained by consumers’ awareness of eco-labels. Therefore, awareness of eco-labels has a significant positive impact in purchase intention, and thus H2 is verified. This result is in agreement with what the existing literature indicates. To recall what was mentioned in the literature review, Testa et al. (2013) have indicated that eco-labels knowledge is a significant predictor of green purchasing intention. Other findings present in the literature review reveal that the attitude towards eco-labels may vary according to several factors, such as consumer awareness of eco-labels.
Since green colour and the feelings carried by the items of colour (eco-friendliness, warmness, likeliness, pleasantness, strength, positiveness) are highly related, this means that there is an interaction between the two variables. Therefore, it was created a new variable resulting from the product of green colour by colour (GCO).
Consider now the linear regression model 5 (introducing the new variable created above GCO) and linear regression model 6 (introducing demographic variables and familiarity with eco-labels):
Model 5) 𝑃𝐼̂ = 𝛽𝑖 1+ 𝛽2𝐺𝐶𝑂𝑖 + 𝛽3𝐶𝐿𝑖 + 𝛽4𝐴𝑊𝐸𝑖 i=1,...,345,
Model 6) 𝑃𝐼̂ = 𝛽𝑖 1+ 𝛽2𝐺𝐶𝑂𝑖 + 𝛽3𝐶𝐿𝑖+ 𝛽4𝐴𝑊𝐸𝑖+ 𝛽5𝐺𝐸𝑁𝐷𝐸𝑅𝑖 + 𝛽6𝑁𝐴𝑇𝑖+ 𝛽7𝐴𝐺𝐸𝑖 + 𝛽8𝐸𝐷𝑈𝐶𝑖 + 𝛽9𝐼𝑁𝐶𝑖+ 𝛽10𝐹𝐴𝑀𝑖 i=1,...,345,
Through model 5, it is possible to concluded that claim is the most important factor to explain purchase intention, followed by awareness of eco-labels. Yet, by model 6, familiarity with the eco-label has a significant positive impact on purchase intention, although any of other demographic variables has a significant impact on purchase intention.
Variables (1) (2) (3) (4) (5) (6) Constant 2,572*** (0,193) 3,134*** (0,354) 2,243*** (0,193) 3,519*** (0,263) 1,165*** (0,262) 1,314*** (0,346) Colour (CO) 0,476*** (0,039)
Green Colour (G) 0,148*** (0,030) Interaction Green by Colour (GCO) 0,007*** (0,002) 0,008*** (0,002) Claim (CL) 0,538*** (0,038) 0,461*** (0,040) 0,450*** (0,041) Awareness (AWE) 0,254*** (0,049) 0,193*** (0,039) 0,178*** (0,040) Gender (GENDER) -0,140 (0,114) Nationality (NAT) 0,078 (0,223) Age (AGE) 0,082 (0,100) Education Level (EDUC) -0,151 (0,135) Income (INC) 0,114 (0,177) Familiarity (FAM) 0,282** (0,136) R Squared 0,066 0,305 0,364 0,073 0,434 0,447 Adjusted R Squared 0,063 0,303 0,362 0,070 0,429 0,432 F statistic 24,187*** 150,839*** 196,011*** 27,066*** 86,996*** 30,034***