DEVELOPMENT AND APPLICATION OF A
STRATEGIC RAIL NETWORK OPTIMIZATION MODEL
FOR FREIGHT TRANSPORT
Doctoral thesis
Thesis submitted to the Faculty of Engineering of the University of Porto in candidacy for the degree of Doctor of Philosophy in the field of Transportation Systems
Author
Luís Rocha Neves Couto Maia
Supervisors
António José Fidalgo do Couto (University of Porto, Portugal) Paulo Fonseca Teixeira (University of Lisbon, Portugal)
This research work was financed by the Portuguese Science and Technology Foundation (FCT) through a PhD grant with the reference SFRH/BD/60449/2009.
A ideia de fazer um doutoramento foi-me sugerida pelo Professor António Couto, quando ainda estava a concluir a tese de mestrado em Engenharia Civil sob a sua orientação. Foi a partir daí que comecei a sonhar com este projecto, tendo iniciado o doutoramento cerca de um ano depois. Os conselhos e a ajuda do Professor António Couto foram essenciais para dar forma à ideia desta tese e, posteriormente, para me auxiliar durante o desenvolvimento da mesma, como meu orientador. A sua excelente orientação, apoio, incentivo e amizade foram um factor determinante para que concluísse esta tese com sucesso, pelo que lhe estou profundamente grato.
Agradeço também a todos os professores que me acompanharam ao longo deste processo por todos as ideias e conhecimentos que me transmitiram. Gostaria de agradecer em particular aos professores que mais influenciaram o meu trabalho com as suas ideias, sugestões e conselhos. Destaco o meu co-orientador, o Professor Paulo Teixeira, pelo apoio, conselhos e sugestões apresentadas, e os Professores Jorge Pinho de Sousa e António Pais Antunes, pelas suas críticas construtivas e sugestões de melhoria, que muito contribuíram para o aperfeiçoamento deste projecto.
Em termos institucionais, agradeço à Fundação para a Ciência e a Tecnologia pelo apoio financeiro dado, que foi fundamental para que eu pudesse realizar este doutoramento. Gostaria também de agradecer à REFER, em particular ao Engenheiro Francisco Ganhão, pela disponibilidade demonstrada no fornecimento de dados de tráfego que se revelaram fundamentais para a aplicação do modelo desenvolvido à rede da Península Ibérica.
Aos meus companheiros do LAT, com quem partilhei o local de trabalho nos últimos quatro anos, agradeço a companhia, amizade e boa disposição, que tornaram a nossa sala num ótimo local de trabalho. Este agradecimento estende-se tanto aos atuais ocupantes,
visitas habituais, Juliana, Nuno, Luís e Giulio. Agradeço também o apoio e constante boa disposição dos Professores Carlos Rodrigues e José Pedro Tavares, que foram uma presença frequente na nossa sala.
Agradeço aos meus pais a educação que me deram e todas as oportunidades que me proporcionaram ao longo da vida, incluindo a oportunidade de obter os estudos que me levaram até este doutoramento. Agradeço-lhes também o apoio e encorajamento que sempre me souberam dar, assim como o facto de terem sido sempre um modelo para mim. Agradeço também ao resto da minha família pelo apoio e incentivo que me deram ao longo deste longo caminho. Não posso também deixar de referir os meus falecidos avós, a quem também devo muito da pessoa que sou.
Agradeço também a todos os meus amigos pela alegria que me transmitiram e o apoio que me deram ao longo destes anos. Estou particularmente grato aos meus amigos mais próximos pela sua amizade inabalável e por todos os bons momentos porque passamos. Foi nos nossos frequentes e inesquecíveis jantares que vivi alguns dos melhores e mais felizes momentos destes últimos anos.
Por último quero agradecer à minha mulher, Sara, por ter estado ao meu lado em todos os momentos deste longo caminho e por fazer de mim uma pessoa feliz. O seu incondicional apoio e confiança deram-me força e motivação para vencer as dificuldades, e a sua contagiante alegria e efusividade ensinaram-me a valorizar as minhas pequenas vitórias.
ABSTRACT ……….……… xvi
RESUMO ………….………..………..….……… xviii
1. INTRODUCTION ……….……… 1
1.1. Problem statement …………...………….……… 2
1.2. Research objectives …………...………….……… 4
1.3. Description of the thesis ……….……… 5
1.4. Scientific papers ….………..…….………...…..……...……. 7
2. A STRATEGIC FREIGHT TRAFFIC ASSIGNMENT MODEL FOR MULTIMODEL NETWORKS …………...……….………. 8
2.1. Introduction ……… 9
2.2 Literature overview ………..………... 11
2.3. Description of the traffic assignment model .………..………... 26
2.4. Application of the model on a fictional network ………... 33
2.5. Conclusions ……….…………... 40
3. A STRATEGIC RAIL NETWORK OPTIMIZATION MODEL FOR FREIGHT TRANSPORT ………..……….………. 43
3.1. Introduction ………...…...……… 44
3.2. Literature overview ……….………... 45
3.3. Description of the network optimization model ………....…………...…... 50
4. VALIDATING THE NETWORK OPTIMIZATION MODEL: THE CASE
OF THE IBERIAN PENINSULA ………. 76
4.1.Introduction ………...……… 77
4.2. Description of the network ………...………...………...…... 78
4.3. Estimation of the demand matrices ……….………... 86
4.4. Calibration and validation …….……….…………... 94
4.5. Results ………...….……….…………... 98
4.6. Conclusions ………..……….…………... 103
5. ASSESSING THE IMPACT OF RAIL NETWORK IMPROVEMENTS ON FREIGHT TRANSPORT UNDER DIFFERENT SCENARIOS ……….. 105
5.1. Introduction ……… 106
5.2. Description of the network and baseline conditions ………...…... 107
5.3. Scenarios ….……….……….…... 112
5.4. Results and robustness analysis ... 115
5.5. Conclusions ……….………... 123
6. NETWORK OPTIMIZATION PROGRAM ….……… 125
6.1. Introduction ……… 126
7. CONCLUSIONS AND FUTURE DEVELOPMENTS …….………... 132
7.1. Conclusions ……… 133
7.2.Future developments ………..…………... 135
REFERENCES ………...………...……… 139
Table 1 – Summary of freight transport production and attraction models (Jong et
al., 2004) ……...………..………...…. 12
Table 2 – Summary of freight transport distribution models (Jong et al., 2004) ….. 13
Table 3 – Traffic assignment techniques (Jourquin, 2005) – adapted ………...… 20
Table 4 –Link attributes ………... 27
Table 5 – Adopted link characteristics ………..…… 34
Table 6 – Considered scenarios ………..…….. 36
Table 7 – General cargo O/D matrix ……….….…..…. 36
Table 8 – Intermodal cargo O/D matrix ……..……….……...… 36
Table 9 – Passenger trains O/D matrix .………...…. 37
Table 10 – Obtained results ………..………..……..… 38
Table 11 – Link construction and upgrading cost (Santos et al., 2008) ………....… 47
Table 12 – Network structure ………...…… 55
Table 13 – Comparison of different methods for the shaking process …………... 63
Table 14 – Summary of links characteristics ……….…...…..….. 67
Table 15 – General cargo O/D matrix ……….…...… 68
Table 16 – Intermodal cargo O/D matrix ……….……. 68
Table 17 – Passenger trains O/D matrix .………...… 68
Table 18 – Results of the optimization process for network A ………...….... 70
Table 25 – Estimation of the freight input and output for each centroid ...… 90
Table 26 –Structure of the iterative traffic distribution process ………..……. 92
Table 27 –Results after the calibration process ………....… 96
Table 28 –Results for each scenario ………. 98
Table 29 – Rail freight traffic after network improvements for scenario 2 …....… 100
Table 30 – Network structure ……….…… 109
Table 31 – Baseline link characteristics ………..………… 110
Table 32 – Rail link improvement costs ……….……… 110
Table 33 –Scenarios ……… 114
Table 34 –Rail freight traffic and network improvement results ……… 116
Table 35 –Structure of the matrix containing the characteristics of all the links in the network ……….……… 128
Table 36 –Structure of the matrices containing the link improvement costs …….. 128
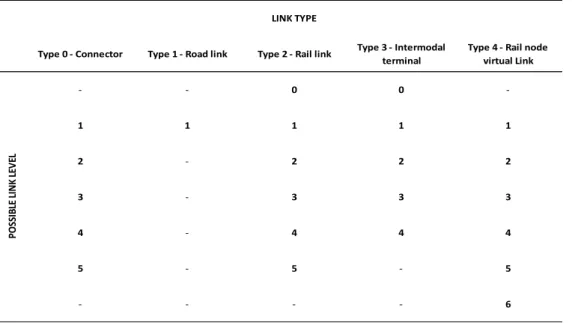
Table 37 –Structure of the matrices containing the general characteristics of the different link types ………...…….…… 129
Figure 1 – Example of a virtual network (Jourquin and Limbourg 2006) ………… 15
Figure 2 – Impact of the distance traveled and frequency of service on the transport cost per km (Janic, 2007) ………...… 18
Figure 3 –Example of a network in STAN (Crainic et al., 1990) ……….…… 24
Figure 4 – Assignment process ……….…… 30
Figure 5 – Fictional network configured for scenarios 1 and 2 ………....… 35
Figure 6 – Network improvement possibilities (Santos et al., 2008) – adapted …... 46
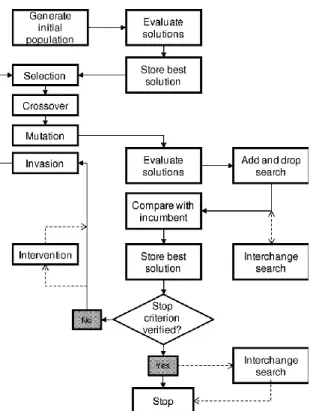
Figure 7 – Enhanced genetic algorithm for a network optimization problem (Santos et al., 2010) ……….………… 49
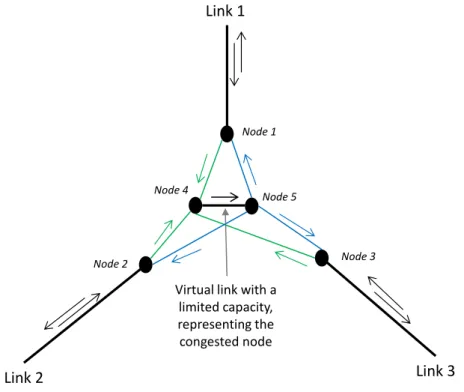
Figure 8 – Example of a congested rail node with 3 rail links converging on it ….. 51
Figure 9 – Optimization process ………...… 56
Figure 10 – Construction algorithm ……….. 57
Figure 11 – Local search algorithm ……….……. 59
Figure 12 – Shaking algorithm ………. 61
Figure 13 – Considered options for starting point of each shaking cycle ………... 62
Figure 14 – Map of network A ………... 65
Figure 15 – Map of network B ………..…… 66
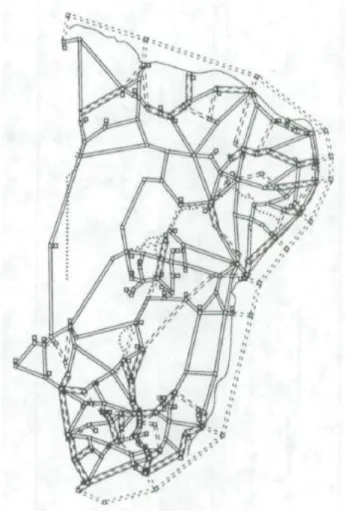
Figure 16 – Representation of the Iberian transport network ……….… 80
Figure 17 –Improvable links ………... 85
Figure 24 –Robust improvement solution for investments up to 20 000M€ …….. 121 Figure 25 –Inserting initial data ……….…. 130
AoN - All or nothing O/D - Origin/destination CO2 - Carbon dioxide
TEU - Twenty foot equivalent unit GDP - Gross domestic product
SCGE - Spatial computable general equilibrium DNDP – Discrete network design problem CNDP - Continuous network design problem
NUTS - Nomenclature of territorial units for statistics
REFER - Rede Ferroviária Nacional - Portuguese rail network administrator
ADIF - Administrador de Infraestructuras Ferroviarias - Spanish rail network administrator
This thesis presents an optimization approach to the long term planning of rail network investments at a strategic level, with the goal of improving the conditions for the transport of freight. The work that was developed along this thesis can be divided in four major areas: development of a strategic freight traffic assignment model; development of a rail network optimization model for freight transport; validation of the network optimization model through its application to the transport network of the Iberian Peninsula; application of the optimization model under different hypothetical future scenarios in order assess how these different circumstances will affect the impact of potential network investments.
The strategic freight traffic assignment model contemplates two different types of cargo, intermodal cargo and general cargo, using different assignment techniques for each of them. Its main innovative feature is the fact that it takes into account both capacity constraints and a variable perception of costs by users, while being much simpler than stochastic equilibrium model.
The rail network optimization model for freight transport is quite flexible and innovative, allowing for both upgrades in the quality of existing links as well as the construction of new ones. The assessment of the quality of each network improvement solution is based on the reduction of the total generalized transport costs and CO2 emissions. As for the optimization process, it uses a local search heuristic which tries to meet a balance between efficiency and effectiveness, by delivering good solutions in a reasonable computing time.
The validation of the network optimization model consisted in its application to the transport networks of the Iberian Peninsula in order to obtain an optimal solution for investing a specific amount of money in the region’s rail network. Th is application served
calibrate and empirically validate the traffic assignment process, by comparing the estimated rail traffic with the actual traffic in the network.
Lastly, the application of the optimization model under different scenarios considered different evolutions for the demand of freight and for the price of oil, in order to study the influence of these changes on the distribution of traffic and on the impact of the network improvements. This included a robustness analysis which helped to identify the network improvement solutions that can best cope with different possible future scenarios.
Keywords: network optimization; traffic assignment; freight transport; Iberian Peninsula.
Esta tese apresenta uma abordagem baseada num método de otimização para o planeamento a longo prazo de investimentos estratégicos em redes ferroviárias, com o objectivo de melhorar as condições para o transporte de mercadorias. O trabalho que foi desenvolvido ao longo desta tese pode ser dividido em quatro grandes áreas: desenvolvimento de um modelo estratégico de afetação de tráfego de mercadorias; desenvolvimento de um modelo de optimização de redes ferroviárias na ótica do transporte de mercadorias; validação do modelo de optimização de redes através da sua aplicação à rede de transporte da Península Ibérica; aplicação do modelo de otimização considerando vários cenários hipotéticos futuros, de modo a avaliar como é que essas diferentes circunstâncias irão afetar o impacto de potenciais investimentos na rede de transporte.
O modelo estratégico de afetação de tráfego de mercadorias contempla dois tipos de carga, carga intermodal e carga geral, usando diferentes técnicas de afectação de trafego para cada uma delas. A sua característica mais inovadora é o facto de considerar restrições de capacidade e uma perceção dos custos variável pelos utilizadores, sendo muito mais simples do que um modelo estocástico de equilíbrio.
O modelo de optimização de redes ferroviárias na ótica do transporte de mercadorias é bastante flexível e inovador, permitindo tanto melhorias na qualidade das ligações existentes como a construção de novas linhas. A avaliação da qualidade de cada solução de melhoria da rede é baseada na redução dos custos generalizados de transporte e das emissões de CO2. O processo de optimização usa uma heurística de pesquisa local que tenta atingir um equilíbrio entre eficiência e eficácia, obtendo boas soluções num período de computação razoável.
A validação do modelo de optimização de redes consistiu na sua aplicação à rede de transporte da Península Ibérica, de modo a obter a melhor solução para investir uma
testar e avaliar a performance do modelo de optimização de redes, bem como para calibrar e validar empiricamente o modelo de afectação de tráfego, comparando o tráfego ferroviário estimado com o tráfego real.
Para finalizar, a aplicação do modelo de otimização considerando vários cenários simula várias evoluções para a procura de transporte de mercadorias e para o preço do petróleo, de modo a estudar a influência que essas alterações têm na distribuição do tráfego e no impacto das soluções de melhoria da rede. Esta aplicação incluiu uma análise de robustez que ajudou a identificar quais as soluções de melhoria da rede capazes de lidar melhor com diferentes cenários futuros.
Palavras-chave: otimização de redes; afetação de tráfego; transporte de mercadorias; Península Ibérica.
DEVELOPMENT AND APPLICATION OF
A STRATEGIC RAIL NETWORK
OPTIMIZATION MODEL FOR FREIGHT
TRANSPORT
Chapter 1
1. INTRODUCTION
1.1. Problem statement
Freight transport plays a crucial role in the day to day life of any modern society, being critical to a large part of the economy. However, it is a subject that has received much less attention by the academia than its passenger counterpart. This is probably due to the fact that freight transport is not as appealing to policy makers as passenger transport and due to the natural complexity of this subject. This complexity is mainly justified by the multiplicity of goods transported, the complexity of the freight supply chain and the difficulty in getting the needed data, which is due to the general lack of complete and up to date databases and the unwillingness of transport companies to share data due to confidentiality reasons. The economic importance of freight transport highlights the importance of thinking of it as a separate part of the transport spectrum, instead of being grouped with passenger transport, as it frequently happens. Therefore, it is important to study this type of transport using models specifically made for it, in order to account for its distinct characteristics.
Furthermore, when planning for improvements in the transport network, the main focus of attention tends to be put on their impact on passenger transport, rather than on freight. This is exacerbated by the fact that the decisions to make big infrastructure investments are always political, with politicians tending to favor passenger transport, which has a greater direct impact on the lives of people. This is a problem due to the fact that although freight transport is not as appealing to the ordinary person as passenger transport, it has an important economic impact which, in the end, will have an important impact on people’s lives. To overcome this problem, it is necessary to study network investments weighting their impact both on freight and on passenger transport, avoiding the common mistake of focusing on passengers and paying little attention to freight. This is
justified not only by the importance of freight in itself, but also because the needs of freight transport are different from those of passenger transport, meaning that the type of network improvements that benefit freight transport can be considerably different from the improvements which benefit passenger transport.
In order to assess the impact of different network improvement solutions on freight transport it is necessary to define the parameters which will be used to assess the value of each improvement solution. There are several different parameters that can be used for this purpose, depending on the goals of the type of analysis being performed. In the case of large scale macro analysis, the parameters are generally related to generalized transport costs and the environmental impact caused by freight transport. These two key factors are able to measure the impact that the improvement operations have, both on the freight operators and on society as a whole: transport costs affect both freight operators and final costumers, and the environmental impact caused by freight transport affects all the people that are harmed by it in any way. Furthermore, there is the possibility that freight carriers may be forced in the future to pay for the pollution they cause, in an effort to internalize the external costs caused by them, making the environmental impact part of the generalized transport costs.
Planning for investments on transport infrastructure is something that inherently has a long term horizon and, as such, has to be carefully thought through. The long term nature of this kind of analysis means that some factors and parameters that today assume a certain value, may suffer significant changes in the long run. As such, it is important to take that into account that there may be fundamental changes in some key factors, such as the
for different parameters, resulting that the most responsible investments will be those that deliver a robust solution, capable of copping with different possible future scenarios.
1.2. Research objectives
The goal of this thesis is to study the impact on freight transport of making significant investments on rail transport networks, namely by studding what kind of investments are most beneficial for this type of transport. Since there is no available network optimization model that is able to cope with the particular demands of this study, this will require the development of a traffic assignment model and a network optimization model made specifically for freight transport.
The first objective of this thesis is to develop a freight traffic assignment model for freight designed to model transport networks at a strategic planning level. The model should simulate land freight transport, by considering both road and rail transport modes, and it must consider two different types of cargo: general cargo and intermodal cargo.
The second objective is to develop a rail network optimization model for freight incorporating the previously developed traffic assignment model. The model should be able to determine how to invest a specific volume of capital on a rail network in order to improve the conditions for freight transport. The quality of the each network optimization solution should be assessed based on the minimization of the generalized costs and of the environmental impact.
The third objective is to apply the network optimization model to a real network, in order to properly validate and calibrate the traffic assignment model and to analyze the results from the network optimization.
The forth objective is apply the network optimization model on a real network considering possible modifications on some key variables that affect freight transport, such
as the demand for freight and the price of oil. This will be done in order to study the influence of these changes on the distribution of traffic and on the impact of the network improvements.
Regarding the divulgation of the work, the objective is to write four scientific papers: a paper about the development of the freight traffic assignment model; a second paper covering the development of the network optimization model; a third paper on the application of the optimization model on a real transport network; a forth paper on the application of the model under various scenarios simulating possible modifications on some key variables.
1.3. Description of the thesis
This Phd thesis is structured in seven chapters. Chapters 2 to 5 are based on scientific papers and can be read separately, containing an introduction, a body and a conclusion. Although this structure can lead to the repetition of some concepts and ideas, there was an effort to avoid unnecessary repetitions.
Chapter 2 presents an innovative freight traffic assignment model for road and rail transport. It considers two different types of cargo, general cargo and intermodal cargo, and uses different assignment techniques for each type. Its main innovative feature is the fact that it takes into account both capacity constraints and a variable perception of costs by users, while being much simpler than stochastic equilibrium model. The model is designed to model macro networks with a high aggregation level and does not require very detailed data inputs, being a strategic planning model. The purpose of the model is to
Chapter 3 is the core of this thesis, presenting a strategic rail network optimization model for freight. The model assesses the best way in which to invest a specific amount of money in a given rail network, with the quality of the improvement solutions being measured by the reduction of the total generalized costs and CO2 emissions. The optimization process is quite flexible and innovative, allowing for both upgrades in the quality of existing rail and intermodal terminal links as well as the construction of new ones, not having a limit on the number or variety of improvement solutions. This is achieved by defining a set of possible link levels for each link type, according to the users’ preferences, including the mere possibility of building a link. The optimization process is based on a heuristic and tries to meet a balance between efficiency and effectiveness, by delivering good solutions in a reasonable computing time.
Chapter 4 is dedicated to the application of the network optimization model on the transport network of the Iberian Peninsula. This is done in order to validate the traffic assignment model and to analyse the results from the optimization process. Two different scenarios are considered: a scenario in which the only goal is the minimization of transport costs and another in which the goal of reducing CO2 emissions given an equal importance. The results validate the traffic assignment model and reveal some critical findings regarding the planning of investments in rail infrastructure.
Chapter 5 features the application of the network optimization model on the transport network of the Iberian Peninsula considering twelve different scenarios. These scenarios simulate possible modifications on some key variables, namely on demand for freight and the price of oil. This is performed in order to study the influence of these changes on the distribution of traffic and on the impact of the network improvements. A robustness analysis is performed on the results obtained for the various scenarios in order to identify robust solutions that can cope with the various possible scenarios.
Chapter 6 is dedicated to the description of the network optimization program that was developed in chapter 3. The main goal of this chapter is to describe how the program works, namely how to insert the input data and how to read the output files.
Chapter 7 is dedicated to the conclusions drawn from this thesis and to the possible future developments. It summarizes the research that was performed in the thesis and presents its main contributions, proposing some possibilities for future developments.
1.4. Scientific papers
The four scientific papers which serve as the base of chapters 2 to 5 of this thesis are the following:
Paper I – Described in Chapter 2: Luís Couto Maia, António Fidalgo
do Couto (2013) ‘An Innovative Freight Traffic Assignment Model For Multimodal Networks’, Computers in Industry, 64(2), pp. 121-127;
Paper II – Described in Chapter 3: Luís Couto Maia, António Fidalgo
do Couto (2013) ‘A Strategic Rail Network Optimization Model For Freight Transport’, Transport Research Record (in press);
Paper III – Described in Chapter 4: Luís Couto Maia, António Fidalgo
do Couto (2013) ‘Validating A Network Optimization Model For Freight: The Case Of The Iberian Peninsula’, Research paper;
Paper IV – Described in Chapter 5: Luís Couto Maia, António Fidalgo
do Couto (2013) ‘Assessing The Impact Of Rail Network Improvements On Freight Transport Under Different Scenarios’, Research paper.
Chapter 2
A STRATEGIC FREIGHT TRAFFIC
ASSIGNMENT MODEL FOR
2. A STRATEGIC FREIGHT TRAFFIC ASSIGNMENT
MODEL FOR MULTIMODAL NETWORKS
2.1. Introduction
Freight transport plays a very important role in the day to day life of any modern society, having a considerable impact in the lives of people and companies. In spite of that, it is a subject that has received considerably less attention by the academia than its passenger counterpart. This is justified, among other reasons, by the fact that freight is a very complex subject being considerably harder to model than passenger transport. Additionally, it is often hard to obtain the data needed to run freight models, due to the reluctance of freight transport companies to share data. Even so, more and more attention has been given to this subject over the years, which has resulted in the development of models that consider freight transport as a separate part of the transport spectrum, instead of being modelled together with passenger transport. This is justified not only by the importance of freight in itself, but also because the reality of freight transport is very different from that of passenger transport, which means that the assignment models need to be different, as well as the type of data that is considered.
The assignment model presented in this chapter contributes to the advance of freight traffic assignment models by including some innovative features, such as the use of different assignment techniques for each type of cargo, and by being relatively light and easy to run in a desktop computer. This is an essential feature of this traffic assignment model, as it will have to be run multiple times in the network optimization model. It is designed to model macro networks with a high aggregation level, namely national or
national or international scale. Therefore, it is designed to be a useful tool for a variety of strategic planning and policy decisions, which are the kind of tasks for which this type of models are more suited for (Wigan and Southworth, 2006).
The model is designed to model land freight transport, considering the road and rail transport modes, as well as the necessary connector links and intermodal terminals. It contemplates two different types of cargo: intermodal cargo, which represents the cargo that can be easily transferred between different transport modes at intermodal terminals, namely containerized cargo; and general cargo, which represents all the remaining cargo. The model uses different assignment techniques for each type of cargo, with its main innovative feature being the fact that it takes into account both capacity constraints and a variable perception of costs by users, while being much simpler than stochastic equilibrium model. This is a characteristic that distinguishes it from the commonly used all or nothing (AoN), equilibrium or stochastic (multi-flow) models, none of which considers these two factors simultaneously (Jourquin, 2005). This traffic assignment model was developed in C++ programing language, which later enabled it to be integrated with the network optimization model, which was developed using the same programing language.
This chapter includes an application of the model to a fictitious transport network that was developed for this purpose, where its results are analyzed and compared to those obtained by using an AoN technique. This application produces satisfactory results which clearly reflect the fact that the model takes into account both capacity constraints and a variable perception of costs, which distinguishes it from the most frequently used models.
This chapter is structured in five sections. The following section is dedicated to a brief literature overview on traffic assignment models. The subsequent section presents a description of the developed freight traffic assignment model. The fourth section is dedicated to the application of the model on a fictitious network, in order to show its
applicability and potentialities. The final section is devoted to the concluding remarks, including suggestions for future research.
2.2. Literature overview
2.2.1. Demand estimation
The demand for freight transport is a necessary input to any freight traffic assignment model and its estimation is a research field that has received considerable attention by the scientific community due to its crucial importance to both planners and operators. Despite being a crucial part of freight transport planning, the scientific knowledge in this area is not consolidated and there are various scientific methods to approach the definition of origin/destination (O/D) tables for freight. The process to estimate the demand for freight transport is usually separated in two steps, following the traditional four step model frequently used to model passenger transport. Those are the production and attraction step and the distribution step (Jong et al., 2004). The production and attraction step is dedicated to the estimation of the amount of freight that is produced and consumed by each generating pole. As for the distribution step, it is the process of estimating where does the freight produced in each pole goes to, and where does the freight attracted by each pole comes from, converting the production and attraction data into an O/D matrix.
The various types of models that have been used to address the production and attraction step are shown in Table 1. These models are divided between those which are based on the observation and analysis of the past reality in order to predict the future, such as time series and system dynamics, and those which try to estimate the production and
when the available data is insufficient. While most demand models resort either to the observation and analysis of past data or to the study of the economic characteristics of each pole to estimate the demand for freight, some models use a combination of both methods (Vilain et al., 2010).
Table 1 – Summary of freight transport production and attraction models (Jong et al., 2004)
Type of model Advantages Disadvantages
Time series Limited data requirements (but for
many years)
Little insight into causality and limited scope for policy effects
System dynamics
Limited data requirements Can give land-use interactions External and policy effects variables can
be included
No statistical tests on parameter values
Trip rates Limited data requirements (zonal data) Little insight into causality and limited scope for policy effects
Input–output
Link to the economy Can give land-use interactions Policy effects if elastic coefficients
Need input–output table, preferably multiregional Restrictive assumptions if fixed coefficients
Need conversion from values to tonnes Need to identify import and export trade flows
When the demand estimation is based on past data, that data is frequently flawed, being incomplete or simply not vast enough to answer to the planners’ needs. Thereby, the missing data has to be estimated using methods such as log-linear modeling or iterative proportional fitting (Peterson and Southworth, 2010). On the other hand, the models based on economic characteristics also face data challenges due to the fact that input-output tables for the desired kind of goods and for the economic conditions under analysis are frequently not available. Therefore, modelers frequently have to resort to models that relate
freight demand with more aggregate economic data such as the gross domestic product (GDP) (Ma et al., 2012; Müller et al., 2012) or the volume of exports (Rao, 1978).
Apart from the more traditional models, there are also some innovative methods that have been used in recent years, including neural networks (Bilegan et al., 2007) or fuzzy methods (Wong et al., 2002). Although these methods have advantages, being well suited for complex and highly dynamic environments, they also have significant shortcomings, being difficult to implement for non-specialist end-users and not mature enough to be used as a widespread method. Another possible way to deal with the problem of production and attraction of freight is a micro approach, which is a suitable option for more detailed micro studies. There are methods which study the generation of freight trips by each firm by establishing the relation between economic factors such as the number of employers in a firm and the amount of freight generated (Iding et al., 2002). The problem with this type of micro approaches is that they are very specific to the type of industry under analysis and cannot be generalized due to the fact that there are large variations between different firms and different sectors of industry.
Table 2 – Summary of freight transport distribution models (Jong et al., 2004)
Type of model Advantages Disadvantages
Gravity
Limited data requirements Some policy effects through transport
cost function
Limited scope for including explanatory factors and policy effects
Limited number of calibration parameters
Input–output
Link to the economy Can give land-use interactions Policy effects if elastic coefficients
Need input–output table, preferably multiregional Restrictive assumptions if fixed coefficients
distance, or other impedance factor, between the origin and destination poles. In input-output models, the distribution is based on the economic characteristics of the generation poles, which makes this kind of models more solid and scientific based than gravity models. The drawback is that they need big amounts of data which makes them impractical and difficult to implement, meaning that they are not frequently used.
There is another class of freight demand estimation models worth mentioning, which are general equilibrium models, namely spatial computable general equilibrium (SCGE) models. These models describe the correlation between the economy and the demand for freight with an elevated degree of detail. This type of models has become more popular due to the progress in computational power over the last decades, having been used in some national freight transport studies (Tavasszy, 2006). Although these models present very good results, they need vast amounts of detailed data in order to be successfully applied. This makes them unfeasible for many situations, although they can be excellent tools in freight studies where there is a refined knowledge of the situation under analysis and large amounts of available data.
2.2.2. Network representation
One of the first aspects that have to be defined when creating a traffic assignment model is how to represent the transport network. Transport networks are usually represented by a graph composed by centroids, nodes and different types of links. The links make the connection between two different nodes which are the points where two or more links converge. Centroids are the points where traffic is generated and consumed, representing cities, regions or any other traffic production points. Links can represent different transport modes, such as road and rail, or be transfer or connector links. Transfer links are used to make the connection between two different modes of transport,
representing points where the interchange of freight between different transport modes is possible, such as intermodal terminals. As for connector links, they are used to make the connection between the centroids and the nearest nodes, representing the connection between a centroid, such as a city, and the nearest network mode, such as a motorway exit or a rail yard.
It is possible to use different links to represent different vehicles that use the same mode, differentiating for example between large trucks and small trucks. A network of this kind is called a virtual network (Jourquin and Limbourg, 2006) and may use multiple parallel links to represent different types of vehicles that use the same transport infrastructure. These networks have to be carefully modeled due to their special particularities, such as the fact that parallel virtual links that use the same transport infrastructure have to share its traffic capacity.
Figure 1 – Example of a virtual network (Jourquin and Limbourg 2006)
represented by a specific transfer link, which may have a cost equal to zero when there is no change of mode or vehicle. Although the use of virtual networks allows for the representation of different vehicles for each transport mode, conferring more realism and flexibility to the model, it adds to the complexity of the model. This added complexity can be a problem, as it can take a considerable amount of computing time to run a traffic assignment model on these networks.
Generally, each link type is divided into levels which share the same characteristics. The nature of the different levels refers to their general classification, such as a road link being separated between two lane roads and freeways of a rail link being divided between single track and double track lines. Apart from unique attributes like the links’ length, all the links from a given category share the same attributes, avoiding the need to model each link individually. These attributes are generally fixed but it is possible to allow for some stochasticity in the definition of certain attributes, such as the link capacity (Xu et al., 2009).
2.2.3. Transport costs
Transport costs are generally estimated using a generic unit, usually the cost per tonne per kilometer. This way costs can be generalized for each link category and applied to all the links, regardless of their length. They usually account not only for the vehicle operation costs but also for time costs and other possible parameters. This definition of cost based on various factors that are deemed to have an impact on the decision of freight transporters is usually referred to as generalized costs.
The process of estimating the generalized vehicle costs involves several important choices and needs to be handled with caution, in order not to ignore important pieces of information and to deliver realistic generalized costs per tonne per km. This is especially
true in the case of strategic broad scoped aggregated models, as their high level of aggregation makes it hard to make generalizations, giving that each link category typically encompasses a significant variety of possible realities. There are many different factors that affect the cost of transporting a tonne of freight for one kilometer of road or rail, namely the capacity of the vehicles circulating in the link, their loading factor, their fuel consumption, the purchasing cost of the vehicle and the salary of the driver, among other factors. Although the existence of different link types and link levels should limit those possibilities, by defining the type of vehicles that circulate on each class of links, there is always a considerable variability on the type of vehicles that use it, particularly in the case of strategic aggregate models. In the case of rail transport, the length of freight trains can vary considerably, even within the same link class, especially if there is no differentiation between the maximum allowed train lengths in the different types of rail links. This has an important impact in the cargo capacity of the vehicles, which is closely related with the trains’ length, having a very significant impact on the cost per tonne (Janic, 2008). Other important factors that affect the transport costs are the frequency of service and the distance traveled, although these factors are hard to include in a strategic model, being difficult to account for the impact of these factors in the average costs. In freight services where the frequency is higher the costs per tonne per kilometer are lowered, the same happening in services where the traveled distance is longer, as it can be observed in Figure 2. Rail is the mode of transport where these economies of scale, scope and density are more clear (Bereskin, 2001).
Figure 2 – Impact of the distance traveled and frequency of service on the transport cost per km (Janic, 2007)
There are several other factors that impact the cost of transporting freight, and they may or may not be explicitly considered in a traffic assignment modes, depending on the type of model being used and on the kind of study being performed. Reliability is an important factor in the transport of freight, as shippers are usually more concerned with the planned schedules being respected than with the speed of the transport. Although this aspect is usually taken into account using a generalist approach, by attributing time penalties to links where congestion is elevated and reliability problems are likely, some studies address the issue of reliability in an isolated fashion, particularly in order to understand what happens in situations where the normal behavior of the transport network is disturbed (Janic, 2009).
Apart from the regular road and rail links, it is also necessary to quantify the generalized costs of using other links, such as connectors and intermodal terminals. The cost of using connectors is sometimes assumed to be zero, although in other cases a fixed cost is assumed for this specific step, in order to account for the cost of the last mile. In the case of intermodal terminals, their costs have to be carefully considered, as the modal
transfer operations cause a relative large portion of overall intermodal transport costs (Bontekoning et al., 2004; Hanssen et al., 2012; Racunica and Wynter, 2005).
Regarding the time costs, they may represent a significant part of the total generalized costs, as the time it takes to move cargo from one place to another is an important decision making variable. The impact of the travel time varies considerably for different types of freight, being crucial for the movement of some high valuable freight and not particularly relevant for other goods, such as raw minerals or cereals. In any case, the quantification and explicit modeling the cost of time is an indispensable part of any transport model. The time cost has to be quantified in all the operations that are time consuming, including the time that the cargo is on the move and the time that is spent in intermodal terminals and connectors. In the case of strategic models that do not differentiate between various types of cargo, there is a need to consider a reasonable average value. One of the most widely used method to quantify the value of freight transport time is the use of stated preference or revealed preference studies that measure the shippers’ perception of the value of time (Bolis and Maggi, 2003) (Kang et al., 2010).
Another group of costs that may be included in traffic assignment models are external costs, such as the impact of freight transport in the environment caused by pollutant emissions or the noise pollution caused by it. The impact of externalities is hard to measure and quantify in monetary terms, but it is a subject that attracts ever more attention, with some studies including an explicit model of external costs (Forkenbrock, 2001). Another possible way to deal with the externalities is by not including them in the assignment model, but to analyze those impacts afterwards, in a post modeling stage.
2.2.4. Traffic assignment techniques
The previous discussed topics have to be interlinked in order to form a traffic assignment model capable of assigning the traffic from an O/D matrix into a transport network. While there is a considerable number and variety of traffic assignment models present in the literature, the traditional assignment techniques can be divided in just four big groups, as it can be seen in Table 3.
Table 3 – Traffic assignment techniques (Jourquin, 2005) – adapted
Capacity
constraint No Yes
No All or Nothing (AoN) Stochastic (multi-flow)
Yes Equilibrium Stochastic equilibrium
Variable perception of costs
As it can be seen in Table 3, there are two major factors that are used to determine to which of the four traditional techniques does a model belong, namely if there are capacity constraints and if there is a variable perception of costs. Capacity constraint models are those in which the capacity of links is limited, often including time penalties due to congestion when certain limits of traffic are exceeded. As for the variable perception of costs, it reflects whether or not the mode and route choice decisions are made uniquely based on the lowest generalized cost (no variable perception), or if some stochasticity is included, spreading the traffic through different modes and routes. The strategic freight traffic assignment models that exist in the literature usually opt for the all or nothing or equilibrium techniques, with stochastic (multi-flow) models being seldom used. As for stochastic equilibrium models, their use in this area of study has been limited, probably due to their complexity.
In an all or nothing assignment, all the traffic that flows from an origin to a destination is assigned to the least costly route. In an equilibrium technique the traffic is also assigned to the least cost route, but there are capacity limits and penalties for congestion. This means that if capacity is reached on some links, creating problems of congestion, the traffic will tend to avoid these links, by using alternative routes. In a stochastic (multi-flow) assignment the traffic is distributed by more than one possible route according to their total generalized costs, but not considering any capacity limitations. As for the stochastic equilibrium technique, it includes the features of both stochastic (multi flow) and equilibrium assignment techniques, by distributing the traffic by more than one possible route, while also considering capacity limits and penalties for congestion.
An all or nothing technique is the most straightforward technique, which works by simply minimizing the total generalized costs in each O/D pair trip (least cost path) thus minimizing it for the whole network. It is best suited for cases where other assignment techniques are considered too complex, or simply not fit for the proposed approach (Beuthe et al., 2001; Jourquin and Beuthe, 1996). Also, if a modeler chooses not to consider a variable perception of costs, all or nothing can be preferred to an equilibrium approach when, due to the nature of the network being analyzed, it does not make sense to consider congestion.
Regarding the use of the equilibrium assignment technique, it is suited for networks with capacity limits where congestion effects are taken into account by admitting cost penalties when traffic is close to the capacity (Crainic et al., 1990; Guélat et al., 1990; Jourquin and Limbourg, 2006). Its solution is based on the Wardrop equilibrium (Wardrop,
used algorithms are the incremental assignment, the method of successive averages and the algorithm of Frank-Wolfe (Jourquin and Limbourg, 2006).
As for the stochastic (multi-flow) approach, it differs from an all or nothing assignment in the fact that is does not assign all the traffic to the least cost path, distributing it by the different alternative routes. While this technique does not consider capacity constraints, it distributes the traffic by different routes, which makes it useful for models where congestion is not important, as it is the case in most intercity freight assignment models (Jourquin, 2005). Contrarily to all or nothing or equilibrium techniques, the use of stochastic assignment techniques ensures that the path with the least generalized costs never receives the totality of the traffic, meaning that other paths are also used. This is a valuable feature when dealing with strategic aggregated models, where the generalized transport costs are just an estimation of the average costs, in that it does not consider the mere minimization of the generalized costs as an undisputable deciding factor. This is additionally justified by the fact that there are many factors that are almost impossible to incorporate in the generalized costs of a strategic model, but have a decisive influence on the modal or route choice, such as the shipment size (Abdelwahab and Sargious, 1992) (Abdelwahab, 1998), the frequency of service (Shinghal and Fowkes, 2002), the service quality (Zlatoper and Austrian, 1990) (Andersen and Christiansen, 2009) and the existence of an integrated door to door logistic chain (Vanek and Smith, 2004). The Logit formulation has consistently been chosen to address the distribution of traffic, due to its versatility and convenience (Oum, 1979) (Southworth and Peterson, 2000) (Jourquin, 2005) (Tsamboulas and Moraitis, 2007). The multinomial Logit model is a function that calculates the percentage of trips that use each alternative route option (Tsamboulas and Moraitis, 2007):
) 1 ( ) exp( ) exp( 1
n k k ij k ij k ij C µ C µ P where:Pijk - percentage of trips realized from origin i to destination j through route k
Cijk – Generalized cost of transport from origin i to destination j through route k
µ - parameter which determines the impact that the cost differentials have on the
percentage of trips assigned to each alternative
The µ parameter affects the percentage of traffic that uses each route, as the use of the least costly route increases for higher values of the µ parameter. The Logit function is practical and appealing for its analytical convenience (Cook et al., 1999), and it can be used in any traffic assignment model to estimate the share of traffic that uses each one of the alternative route options.
Although there are many different traffic assignment models present in the literature, with many being built for just one specific work, there are at least two major freight traffic assignment models that are worth mentioning, due to their importance and extensive use. Those are STAN, which was developed in 1990 in Canada (Crainic et al., 1990; Guélat et al., 1990), making use of an equilibrium assignment technique, and the NODUS software, which was developed in Belgium a few years later (Beuthe et al., 2001; Jourquin, 2005; Jourquin and Beuthe, 1996; Jourquin and Limbourg, 2006) and that has been employed using all of the three most common assignment techniques: all or nothing, stochastic (multi flow) and equilibrium.
Figure 3 –Example of a network in STAN (Crainic et al., 1990)
While the most commonly used assignment procedure is the equilibrium, the fact that various techniques were used with the NODUS software shows that each one has its own advantages, which should be considered when choosing the type of technique to use. Apart from the strategic models, there are other types of models that address more specific problems and situations, using techniques such as micro simulation (Weidner et al., 2009). There are also some strategic models that incorporate a more detailed micro method to deal with a particular part of the modeling process (Southworth and Peterson, 2000).
Freight flows are frequently unbalanced, which causes problems in the transport chain, often causing freight vehicles to run empty on one way. These empty trips have a significant economic impact: the cost per tonne of transporting freight in only one way and returning empty is higher than in the case of loaded trips on both ways, which only
happens is flows are balanced or if a different commodity can be transported on the way back. Also, it is important to know all the traffic flows (empty or loaded) in order to assess the total level of traffic that passes through each link. Although many traffic assignment models do not consider this problem explicitly, there is some relevant literature where this problem is comprehensively addressed (Holguín-Veras and Thorson, 2003), or where at least given some attention (Fernandez et al., 2004). One way to estimate the share of empty trips is to assess it based on the flow unbalance and on the distance between the O/D pair under analysis (Holguín-Veras and Thorson, 2003).
To finalize, it is important to remember that while traffic assignment models are very useful tools, being well suited for several planning tasks, they have important limitations. There is evidence that strategic freight traffic assignment models are usually not up to the task of forecasting future freight activity, although they can be very useful tools for a variety of planning and policy decisions where their limited forecasting capacity is not needed (Wigan and Southworth, 2006). Even so, most of the errors derived from the use of traffic assignment models are caused by inadequate or too scarce data or to an incorrect interpretation and modeling of the system.
2.3. Description of the traffic assignment model
2.3.1. General characteristics
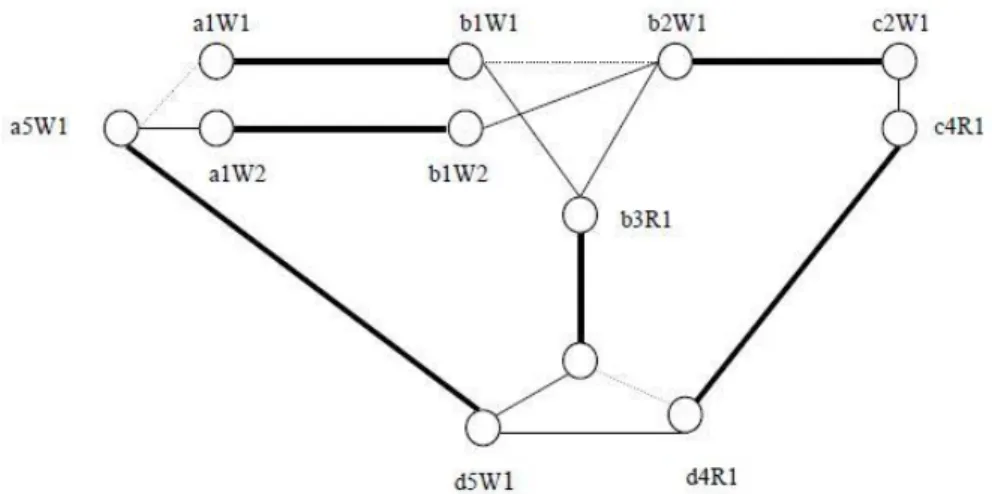
The developed model is a strategic freight traffic assignment model, designed to model macro networks at a national or international level of planning. It considers a basic differentiation between two types of cargo: intermodal cargo and general cargo. The former represents the containerized cargo that can be easily transferred between different transport modes at intermodal terminals, while the later represents all the remaining cargo. It is designed to model inland freight transport, considering road and rail transport. Apart from those two major transport modes, the model also includes other types of links such as connector links that link the road and rail network to the centroids representing each region, and intermodal terminals that establish the connection between the road and rail modes. The connector links are very flexible, with its characteristics being freely defined by the modeler. This enables them to be used in situations in which it is necessary to introduce a very specific link, such as the representation of a congested rail node in the middle of a rail network.
Table 4 –Link attributes
Variable Definition
1 ID Link identification number
2 Type Link type
3 Improvable Variable that defines if the link is improvable or not
4 LinkStatus Link level of quality
5 Startnode Identification number of the node where the link originates 6 Endnode Identification number of the node where the link ends
7 Length Link length
8 Speed_gen Vehicle speed for general cargo
9 Veicap_gen Vehicle cargo capacity for general cargo 10 Veicost_gen Total vehicle cost per km for general cargo
11 VOT_gen Value of time for general cargo
12 Veicost_int Total vehicle cost per km for intermodal cargo 13 Capacity_each_way Link traffic capacity in each direction
14 CO2_km_gen Vehicle CO2 emission per km for general cargo 15 Veicap_int Vehicle cargo capacity for intermodal cargo
16 Bidirectio Variable that defines if the link is bidirectional or not 17 Speed_int Vehicle speed for intermodal cargo
18 CO2_km_int Vehicle CO2 emission per km for intermodal cargo
19 VOT_int Value of time for intermodal cargo
Each link has a specific set of attributes that define all of its characteristics, as it can be seen in Table 4. Some of these attributes are relative to the physical characteristics of the link, namely its type and level of quality, the definition of the nodes from where it originates and where it ends, its length, and its traffic capacity in each direction. There are also two binary variables that define if the link may be improved to a better level and if it is unidirectional or bidirectional. The remaining attributes are related to the vehicles and type of cargo that uses the link, being separated for general cargo and intermodal cargo. This enables the use of different vehicles for each type of cargo and even to the use of different cargo units, such as the use of tonnes for general cargo and twenty foot equivalent units (TEU’s) for intermodal cargo. These attributes include the speed, cargo capacity,
vehicle, including fuel and maintenance costs, the cost of the driver, and the cost of using the infrastructure, namely tolls or rail infrastructure charges.
It is important to stress that intermodal terminal and connector links are only representations of different types of transport connections and do not represent real links with real vehicles using them. Due to that, they display artificial characteristics which are meant to represent the time and costs of using those links. This may be accomplished by considering that the vehicle capacity is equal to 1 and adjusting the remaining link attributes in order to achieve the desired values for the time and cost for those links. This is a continuous model which does not consider individual vehicles, but rather undifferentiated amounts of cargo that use the different links. Thereby, the freight flows are represented as the amount of typical vehicles, and may not be a whole number.
The computation of the generalized transport costs per tonne on each link is calculated based on the link attributes, being constituted by a vehicle cost component and a time cost component:
) 2 ( , , i I k J v s l r q l p k ik i i k i k i i k i with: links all of set I } , {Gen Int J where:
Gen = general cargo Int = intermodal cargo
pik = generalized cost per unit of cargo on link i, for cargo type k
li = length of link i
rik = vehicle capacity on link i, for cargo type k
sik = vehicle average speed on link i, for cargo type k
vik = value of time on link i, for cargo type k
This cost is given in units of cost per tonne, and corresponds to the generalized costs incurred by a tonne of freight when passing through a given link. Based on the defined generalized costs for each link, it is possible to calculate the least expensive path between any given pair of nodes, which can be computed using a shortest path algorithm. The algorithm that is employed in this model is the Floyd-Warshall algorithm (Floyd, 1962) with path reconstruction, which computes the value of the least expensive path (shortest paths) between all the nodes, as well as the path in itself (the links used in each path). This algorithm was chosen due to the fact that it is a simple and efficient algorithm, being frequently used to tackle this type of problems.
2.3.2. Assignment techniques
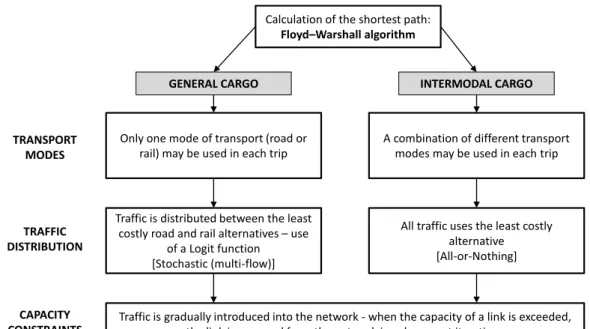
The main innovative feature of this traffic assignment model is the use of two different assignment techniques for the two types of cargo. This is justified by the fact that intermodal cargo is flexible, being able to change from road to rail transport with relative ease, by using intermodal terminals. This does not happen with general cargo, which is thereby limited to using the same transport mode in each trip. The main features of the assignment process are resumed in Figure 4.
Calculation of the shortest path:
Floyd–Warshall algorithm
Only one mode of transport (road or rail) may be used in each trip
A combination of different transport modes may be used in each trip
Traffic is gradually introduced into the network - when the capacity of a link is exceeded, the link is removed from the network in subsequent iterations
Traffic is distributed between the least costly road and rail alternatives – use
of a Logit function [Stochastic (multi-flow)]
All traffic uses the least costly alternative [All-or-Nothing] TRANSPORT MODES TRAFFIC DISTRIBUTION CAPACITY CONSTRAINTS INTERMODAL CARGO GENERAL CARGO
Figure 4 – Assignment process
In the case of general cargo, as each trip may only use one mode of transport, there is a clear mode choice decision between road and rail transport. This feature enables the use of an assignment technique that distributes the traffic by these two transport modes, which is coherent with the nature of this model, given that there is always some traffic distribution between concurring transport modes at this macro level of planning. Due to that, a stochastic (multi-flow) technique is used for the assignment of general cargo traffic, distributing the traffic between the two concurring transport modes based on the comparison between the least costly paths using road and rail transport. By distributing the traffic by the two available transport modes, the stochastic technique implicitly considers that the simple minimization of the total generalized costs is an imperfect measure of the quality of each transport alternative, which is particularly true in the case of strategic models. The imperfection of the generalized costs as a way to assess the best route is due to the existence of various issues other than the cost that affect the choice of transport mode, such as the suitability of each transport mode to each shipment or the routine of the shippers. These factors often cause a significant part of the traffic not to flow through the
least costly route. The distribution of traffic through the road and rail modes is calculated using a logit function, as seen in Equation (1). It gives the percentage of traffic that uses each mode, being dependent on the generalized cost of each alternative and on the value of the µ parameter, which has to be calibrated in a case by case basis. In case there is only one available transport mode for a given O/D pair, all the traffic will flow through the least costly path of the available transport mode.
In the case of intermodal cargo, as it can use more than one transport mode per trip, there is no clear mode choice decision between road and rail transport. Also, due to the strategic nature of the model and to the diverse nature of transport networks, there is usually no clear route choice decision between two or more alternative routes. Thereby the model uses a technique that assigns the traffic to the least costly path between the origin and the destination, allowing for the combination of various transport modes. This is performed using an AoN technique, allowing for the indifferent use of road, rail and intermodal terminal links, as long as they are part of the absolute least expensive path.
It should be stressed that neither the AoN nor the Stochastic (multi-flow) consider any traffic capacity limitations. Given that this is a strategic model that only considers the main traffic generation regions and long distance links, it would be reasonable not to consider any capacity constraints, given that congestion is mostly observed in and around urban areas (Jourquin, 2005) and not on intercity links. There are nonetheless long distance transport links that have congestion problems, particularly rail links, due to the fact that their capacity is relatively rigid. Intermodal terminals may also be affected by capacity problems, affecting intermodal cargo. Due to that, the model includes a mechanism that