Vol.52, n. 4: pp. 961-972, July-August 2009
ISSN 1516-8913 Printed in Brazil BRAZILIAN ARCHIVES OF
BIOLOGY AND TECHNOLOGY A N I N T E R N A T I O N A L J O U R N A L
Neural Network Based Control of an Absorption Column in
the Process of Bioethanol Production
Eduardo Eyng
1*, Flávio Vasconcelos da Silva
1, Fernando Palú
2and Ana Maria Frattini
Fileti
11Faculdade de Engenharia Química; Universidade Estadual de Campinas; C. P.: 6066; 13083-970; Campinas - SP
- Brasil. 2Universidade Estadual do Oeste do Paraná; C. P.: 520; 85903-000; Toledo - PR - Brasil
ABSTRACT
Gaseous ethanol may be recovered from the effluent gas mixture of the sugar cane fermentation process using a staged absorption column. In the present work, the development of a nonlinear controller, based on a neural network inverse model (ANN controller), was proposed and tested to manipulate the absorbent flow rate in order to control the residual ethanol concentration in the effluent gas phase. Simulation studies were carried out, in which a noise was applied to the ethanol concentration signals from the rigorous model. The ANN controller outperformed the dynamic matrix control (DMC) when step disturbances were imposed to the gas mixture composition. A security device, based on a conventional feedback algorithm, and a digital filter were added to the proposed strategy to improve the system robustness when unforeseen operating and environmental conditions occured. The results demonstrated that ANN controller was a robust and reliable tool to control the absorption column.
Key words: Absorption column, Artificial neural network, Feedforward control
*
Author for correspondence:[email protected]
INTRODUCTION
Gas-liquid absorption columns are largely employed in chemical industry separation units. In the bioethanol production, a column is used to recover the evaporated alcohol from the sugar fermentation process, increasing the overall process productivity and improving the plant safety.
The principal fuel used in Brazil as a petroleum substitute for road transportation vehicles is bioethanol. As bioethanol has a number of advantages over the conventional fuels, its demand is increasing. Some of these advantages are: bioethanol is biodegradable and far less toxic than
fossil fuels; it reduces greenhouse gas emissions and comes from a renewable resource.
Several linear control applications for absorption columns are found in the literature. Palú et al (2004) studied the application of a linear dynamic matrix control (DMC) to a staged absorption column. In the studied system, bioethanol is separated from carbon dioxide in a nine stage column. The residual alcohol concentration in the waste gas is the controlled variable. The DMC outperformed the PI conventional controller. Najim and Ruiz (1995) presented first principles modeling and a long-range predictive control of an absorption packed column. This equipment was used to decrease the concentration of CO2 in a gas
mixture below a desired value. A solution of diethanolamine (DEA) was used as the absorbent. The flow rate of the absorbent and the concentration of CO2 were selected, respectively,
as manipulated and controlled variables. An extended horizon control policy, based on the minimization of a quadratic criterion function of the input and output tracking errors, was used for the feedback control. The simulation studies highlighted the applicability of this adaptive control algorithm to packed columns.
Nunes et al (2003) developed a rigorous method for analyzing the stability of unconstrained multivariable predictive controllers, using polynomial operators and coprime matrix factorizations. The technique permits deriving explicit expressions for the closed-loop transfer functions that describe the relevant system dynamics. Therefore, the closed-loop poles can be determined by finding the roots of two characteristic polynomial equations, hence allowing the complete characterizations of the asymptotic stability of the system. The controllers require the specification of a large number of tuning parameters, including prediction and control horizons for every input and output signal as well as the elements of input and output weighing matrices. The proposed stability analysis tools lend significant support to the tuning task because the sets of parameters that produce unstable poles can be identified and rejected. Through a simulator, this technique was successfully applied to control a multistage gas-liquid absorption column.
Modeling of an absorption column performance using feedforward neural network was presented by Roj and Wilk (2004). The input and output data for training of the neural network were obtained from a rigorous model of a sieve plate absorption column. The results obtained from the neural
network models were then compared with the results obtained from the simulation calculations. The results showed that relatively simple neural network models can be used to model the column steady state behavior.
Meleiro et al (2005) used neural networks for the control of the fermentation step of an alcohol production process. The internal model of the non-linear predictive controller was represented by two Functional Link Networks (FLN). This structure presented the advantages of fast training and guaranteed convergence. The performance of the proposed controller was evaluated for servo and regulatory problems, and in both cases, it showed satisfactory results.
An off-line smoothing algorithm in the monitoring system for the partial hydrolysis of cheese whey proteins using enzymes, which used penalized least squares, was implemented by Pinto et al (2005). Different algorithms for on-line signals filtering were compared: artificial neural networks, moving average and smoothing algorithm. The filters based on neural networks were implemented in the on-line pH control system, promoting a smoother control action and did not affect the inference system.
In order to set a satisfactory real time control for the ethanol concentration in a staged absorption column, neural modeling was employed in the present work. The main contribution was the development of a nonlinear controller, based on a dynamic inverse artificial neural network model, and its application to a staged absorption column used in the bioethanol production process. Simulation studies were performed, in which noise was introduced to ethanol concentration signals from a rigorous model. A security device, based on a conventional feedback algorithm, was added to the proposed strategy in order to achieve a robust controller when unforeseen operating and environmental conditions occur.
MATERIAL AND METHODS
Process description
The gas mixture (CO2 + ethanol) from the sugar
stages, and operates at 40 ºC and 1 atm. The column processes 61.9 mol/s of the gas mixture in order to reduce the alcohol concentration from approximately 10000 ppm to 200 ppm. The former concentration depends on the fermentation broth conditions and also on specific features of the fermentation tanks. As it varies, it is a disturbance to the absorption process and the absorbent flow rate must be manipulated to keep the expected ethanol recovery.
Absorption column dynamic modeling
For the simulation studies, a mathematical model was obtained from the global mass balances for each stage, equilibrium equations and the Francis equation for hydrodynamic calculation. For the operating conditions previously described, the ethanol solubility in water was calculated by the
equation Y = 1.0682 X, based on the Van Laar equation for vapor pressure data of isothermal systems (Sherwood, 1975). This is the equilibrium equation used, in which X is the alcohol molar fraction in the liquid phase and Y is the alcohol molar fraction in the gas phase.
• The following assumptions were considered:
• Just one component is transferred between phases;
• Isothermal absorption;
• Ideal stages;
• The mass transfer does not modify gas and liquid flow rates;
• Constant pressure;
• Negligible gas hold-up.
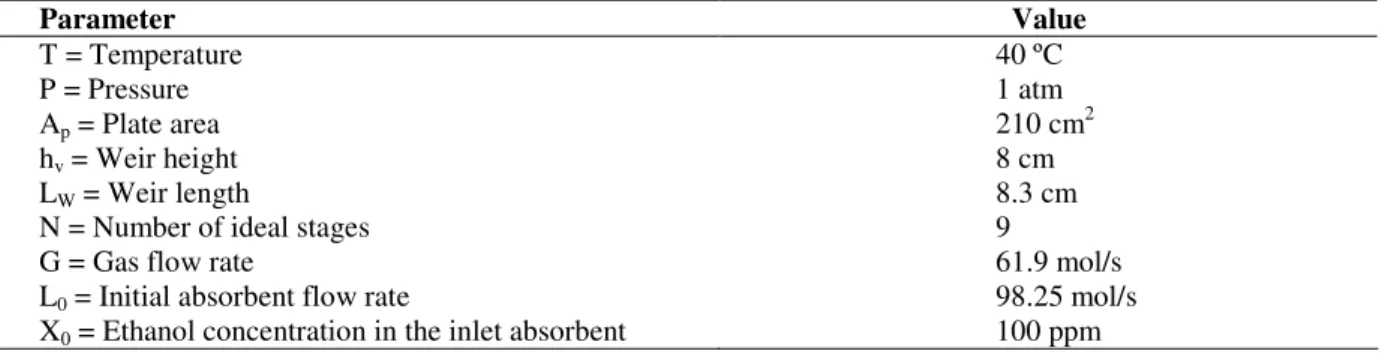
The parameters involved in the absorption column model are listed in Table 1.
Table 1 - Absorption column parameters.
Parameter Value
T = Temperature 40 ºC
P = Pressure 1 atm
Ap = Plate area 210 cm2
hv = Weir height 8 cm
LW = Weir length 8.3 cm
N = Number of ideal stages 9
G = Gas flow rate 61.9 mol/s
L0 = Initial absorbent flow rate 98.25 mol/s
X0 = Ethanol concentration in the inlet absorbent 100 ppm
The dynamic model, used on the computational simulations is described here.
The Equation 1 represents the global mass balance at the n stage:
n n
n L L
dt
dM = −
−1 (1)
Where:
M = Liquid molar mass at each stage. L = Absorbent flow rate at each stage.
Global mass balance at n stage, for the absorbed component.
(
)
(
)
n 1 n n n 1 n 1 n nn L X L X GY Y
dt X M d − + −
= − − + (2)
The Equation 3 is employed to calculate the average specific molar mass for a binary mixture.
(
A)
BA A
média
=
ρ
X
+
ρ
1
−
X
ρ
(3)The hold up at each stage is given by the Francis Equation:
+
=
3 2 w n n v n p nL
L
c
h
A
M
ρ
ρ
(4) Where:ρn = Average specific molar mass of the mixture
(mols/cm3)
c = Constant (cm-1/3s2/3)
The output liquid flow for each stage is obtained from the Equation 5.
Neural network
Theory
Artificial neural networks (ANNs) are mathematical models composed of several neurons, arranged in different layers (input, hidden and output), interconnected by a complex network. According to Equation (6), the neuron is responsible for the summation of all signals from previous layer neurons, yj(amplified or weakened
by weight values, wk,j) and a value called bias, bk.
A transfer function, f - such as hyperbolic tangent, sigmoid or linear function – is used for the activation of the neuron output, yk.
(
)
+
=
∑
=
N
j
k j j k
k f w y b
y
1
, (6)
The multi-layer feedforward network, which is the most suitable topology for empirical modeling and engineering applications, was used in this work.
Training the ANN
The training procedure requires a set of the process inputs and outputs. During the training process, the weights and biases are iteratively adjusted to minimize an objective function. The conventional training algorithm – backpropagation - moves the network parameters towards the direction of the negative gradient (Demuth and Baele, 2002). The Levenberg-Marquardt optimization is a very useful alternative method of training. However, both the methods could lead to data overfitting, if carelessly implemented.
One of the most important methods for improving the generalization and to avoid overfitting is called regularization. This involves modifying the objective function, which usually computes only the sum of the squared errors (SSE) of the training set. In the regularization method, a term that consists of the mean of the sum of the squared weights (SSW) is added to the SSE calculation in the objective function (Equation 7)
F = β. SSE + α. SSW (7)
in which β and α are fitted parameters (Demuth and Baele, 2002).
According to Hagan and Foresse (1997), using this objective function coupled with the Levenberg-Marquardt algorithm will cause the network to have smaller weights and this will force the network response to be smoother and less likely to overfit. Another important feature of this algorithm is that it provides a measure of how many network parameters (weights and biases) are being effectively used by the network. This effective number of parameters is called γ and is different from the total number of parameters in the network, N. The best number of neurons of the hidden layer could be found when the effective number of parameters remains the same no matter the increase in the number of hidden neurons.
Normalization of the data set
Neural network training is more efficient when a preprocessing normalization is carried out for input and target output variables. Then, before network training, the data set was normalized in the range [–1,1], as follows:
1
)
(
)
(
2
min max
min
−
−
−
=
x
x
x
x
x
n (8)in which xn is the normalized value for the
variable, and xminand xmax are the minimum and
maximum of each variable ‘x’.
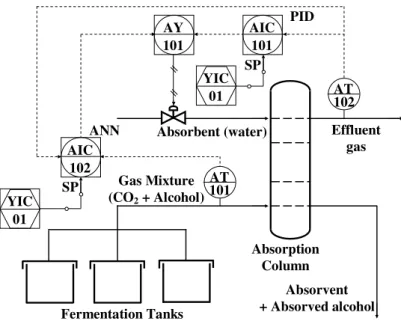
Absorption column control
AT 101 AIC
102
YIC 01
YIC 01
AIC 101 AY
101
AT 102
Fermentation Tanks Gas Mixture (CO2 + Alcohol)
Absorption Column
Absorbent (water) Effluent
gas
Absorvent + Absorved alcohol ANN
PID
SP
SP
Figure 1 - Absorption column control scheme.
ANN controller
The proposed strategy, based on an inverse neural network model, was successfully employed by Fileti et al. (2006) to control an industrial steelmaking process. The controller design may be split into two distinct steps:
• Neural modeling and network training: Definition of the input/output variables. A data set is presented to the network that extracts the process information required to create a black-box model of the operational environment. This knowledge is stored into the network parameters (weights and biases). This first step should be repeated every time the data set is updated;
• Control action determination: The trained neural network receives current values of the input variables and computes the control action to be implemented.
Neural modeling and data set
The nonlinear control strategy (AIC-102) is based on a dynamic ANN composed of five input variables and one output variable. A moving
window of the main input variable measurements (AT-101 and AT-102) is employed to calculate the future control action. Table 2 shows the variables involved.
Operating data were obtained through a computational program based on the rigorous mathematical model previously described (see 2.1.1). Step disturbances on the gas mixture composition (between –10% and +10% of the original ethanol concentration) were imposed. Both, open and closed loop simulations were carried out. Dynamic matrix control was the strategy used in the closed loop simulations to change the absorbent flow rate and capture the process dynamics. The training and validation sets contained 800 and 500 input/output relations, respectively.
Table 2 - Input and output variables used for neural modeling.
Input Output
Current absorbent flow rate (L0|k)
Current ethanol concentration in the effluent gas phase (Y1|k)
Past ethanol concentration in the effluent gas phase (Y1|k-1)
Desired ethanol concentration in the effluent gas phase, one-step-ahead (Y1sp|k+1)
Current ethanol concentration in the gas mixture (YN+1|k)
One-step-ahead absorbent flow rate (L0|k+1)
Feedback action
The success of the proposed nonlinear control strategy depends on the neural network efficiency. As mentioned before, during the training procedure, the neural network captures the process dynamics in the operating range employed. However, if the ANN must work on a different operating condition, the error probability increases.
Sometimes, the environmental and process conditions may reach values unexpected by the network. Therefore, a security device based on a feedback control was coupled to the ANN control strategy. If this controller performance decreased to a critical limit, the device was activated (AY-101). This critical limit was arbitrarily defined as 5% of the absolute error. In case of error measurement above the critical limit, a PID controller (AIC-101) droved the absorbent flow rate manipulation.
To test this arrangement, disturbances on the absorbent ethanol concentration were imposed to the process. This kind of disturbance was not taken into account for the network training purpose.
Noisy signal and filter implementation
In order to approximate simulation to real world, noisy signals were added to the measurements of ethanol concentrations (Y1 and YN+1). This noise
was the product of a random number between 0 and 1 and a sine function with high frequency and controlled amplitude. The noise was applied only to the tests of the control system performance and not during the network training.
After analyzing the control system behavior with noisy input data, another test was done: the input data was filtered. The filter used was composed of a weighed sum of the input variable at different sample times. Current time k, besides the previous sample times, k-1, k-2,…, k-NA were used. NA
represents the last sample time before k, that is used in the sum. The filtered variable value was obtained by Equation (9).
NA k NA k
k
Filtered Y Y Y
Y =
α
1 +α
2 −1+...+α
+1 − (9)in which:
Filtered
Y = Filtered variable.
Y = Variable supposed to be filtered.
αi = Filter parameter, 1
1
1
=
∑
+ = NAi i
α
RESULTS AND DISCUSSION
Assessment of the neural network
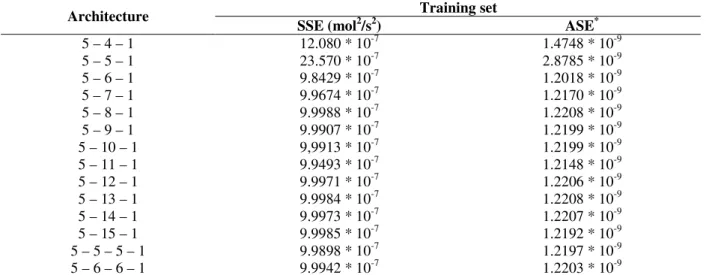
Many arrangements were tested to find an ANN architecture that provided a satisfactory performance without high computational effort. Table 3 and 4 showed the SSE and ASE parameter values for both data sets used (training and validation) when the ANN architecture was changed.
It was observed that when using more than five neurons in the hidden layer and more than one hidden layer, there were no significant changes on the SSE and ASE values. Therefore, architectures with more than one hidden layer should be eliminated, because it would cause just an increase on computational effort.
Table 3 - SSE and ASE values for different ANN architectures (Training set)
Training set Architecture
SSE (mol2/s2) ASE*
5 – 4 – 1 12.080 * 10-7 1.4748 * 10-9
5 – 5 – 1 23.570 * 10-7 2.8785 * 10-9
5 – 6 – 1 9.8429 * 10-7 1.2018 * 10-9
5 – 7 – 1 9.9674 * 10-7 1.2170 * 10-9
5 – 8 – 1 9.9988 * 10-7 1.2208 * 10-9
5 – 9 – 1 9.9907 * 10-7 1.2199 * 10-9
5 – 10 – 1 9,9913 * 10-7 1.2199 * 10-9
5 – 11 – 1 9.9493 * 10-7 1.2148 * 10-9
5 – 12 – 1 9.9971 * 10-7 1.2206 * 10-9
5 – 13 – 1 9.9984 * 10-7 1.2208 * 10-9
5 – 14 – 1 9.9973 * 10-7 1.2207 * 10-9
5 – 15 – 1 9.9985 * 10-7 1.2192 * 10-9
5 – 5 – 5 – 1 9.9898 * 10-7 1.2197 * 10-9
5 – 6 – 6 – 1 9.9942 * 10-7 1.2203 * 10-9
*
(mol2/[s2] . [input-output data number] . [neuron number in the output layer])
Table 4 - SSE and ASE values for different ANN architectures (Validation set)
Validation set Architecture
SSE (mol2/s2) ASE*
5 – 4 – 1 2.0437 4.1879 * 10-3
5 – 5 – 1 2.0489 4.1985 * 10-3
5 – 6 – 1 2.0515 4.2038 * 10-3
5 – 7 – 1 2.0650 4.2315 * 10-3
5 – 8 – 1 2.1112 4.3262 * 10-3
5 – 9 – 1 2.0425 4.1854 * 10-3
5 – 10 – 1 2.0850 4.2725 * 10-3
5 – 11 – 1 2.1511 4.4079 * 10-3
5 – 12 – 1 2.0380 4.1762 * 10-3
5 – 13 – 1 2.0632 4.2278 * 10-3
5 – 14 – 1 2.0862 4.2750 * 10-3
5 – 15 – 1 2,1559 4.4178 * 10-3
5 – 5 – 5 – 1 2.0544 4.2098 * 10-3
5 – 6 – 6 – 1 2.1215 4.3473 * 10-3
* (mol2/[s2] . [input-output data number] . [neuron number in the output layer])
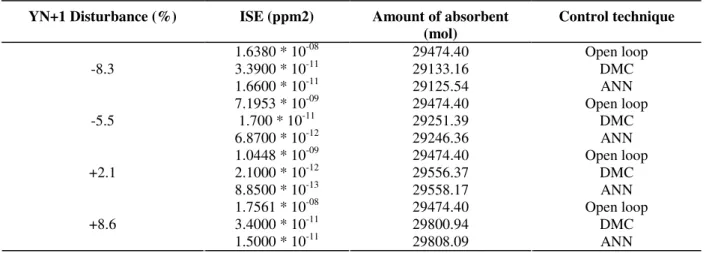
Performance of the ANN controller versus DMC
Table 5 compares the performance of the ANN controller and the DMC strategy (Palú, 2004). Step disturbances were imposed to the gas mixture composition, YN+!.
The ANN controller provided smaller ISE (integral of square error) values, which mean that the controlled variable remained closer to the set point than that obtained under the DMC strategy. The parameter ISE was expressed in square concentration (ppm2) and consequently presented
small values. The controllers used similar amounts of the absorbent to carry out the task.
Figures 2a and 2b showed the behavior of the controlled variable, Y1, and the manipulated
variable, L0, when a step disturbance of 8.6% was
imposed to the ethanol concentration in the feed mixture, YN+1.
Table 5 - Performance comparison between ANN control and DMC strategy
YN+1 Disturbance (%) ISE (ppm2) Amount of absorbent
(mol)
Control technique
1.6380 * 10-08 29474.40 Open loop
3.3900 * 10-11 29133.16 DMC
-8.3
1.6600 * 10-11 29125.54 ANN
7.1953 * 10-09 29474.40 Open loop
1.700 * 10-11 29251.39 DMC
-5.5
6.8700 * 10-12 29246.36 ANN
1.0448 * 10-09 29474.40 Open loop
2.1000 * 10-12 29556.37 DMC
+2.1
8.8500 * 10-13 29558.17 ANN
1.7561 * 10-08 29474.40 Open loop
3.4000 * 10-11 29800.94 DMC
+8.6
1.5000 * 10-11 29808.09 ANN
197 198 199 200 201 202 203 204
0 25 50 75 100 125 150 175 200
Time (s)
(p
p
m
)
Y1 (ANN) Y1 (DMC) Set point
(a )
96 97 98 99 100 101
0 25 50 75 100 125 150 175 200
Time (s)
(m
ol
/s
)
L0 (ANN) L0 (DMC)
(b)
Security device (feedback action)
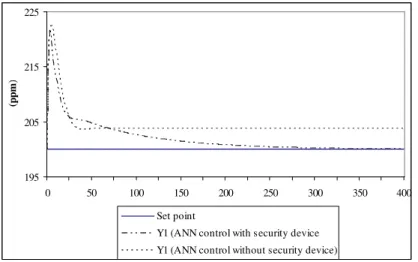
Figure 3 showed the controlled variable behavior when the system was submitted to a step disturbance of 30% in the ethanol concentration of the liquid absorbent (X0). As this kind of
disturbance was not taken into account for network
training purpose, the ANN control performance decreased below the critical limit. As expected, the security device (PID controller) was activated. An off-set was observed when this device was not present. The PID controller was tuned for this specific situation and eliminated the off-set.
195 205 215 225
0 50 100 150 200 250 300 350 400
Time (s)
(p
p
m
)
Set point
Y1 (ANN control with security device Y1 (ANN control without security device)
Figure 3 - Performance comparison between ANN controller with and without the security device (PID: Kc=22000 ppm.s/mol, τI=10400 s τD=60 s ).
Noisy data, filter implementation and the ANN controller performance
Figure 4a and 4b show the noisy signal of the gas phase ethanol concentration, Y1|k, and the
respective filtered variable,
Y
Filtered. Without the filter action, the input variable presented oscillation band amplitude of 3 ppm, except initially when a step disturbance of 10% was imposed to YN+1. The amplitude of this inputvariable decreased to 0.5 ppm, when the digital filter was applied.
The αi and NA (Equation 10) were determined
through a trial-and-error procedure. Observing the controlled variable overshoot and oscillation band, the best results were obtained when 15 sample times before k were used (NA=15). The αi
(i=1,2…, NA) values employed were: α1 = 0.20, α2
= 0.10, α3 = 0.05, α4 = 0.05, α5 = 0.05, α6 = 0.05,
α7 = 0.05, α8 = 0.05, α9 = 0.05, α10 = 0.05, α11 =
0.05, α12= 0.05, α13 = 0.05, α14 = 0.05, α15 = 0.05
and α16 = 0.05.
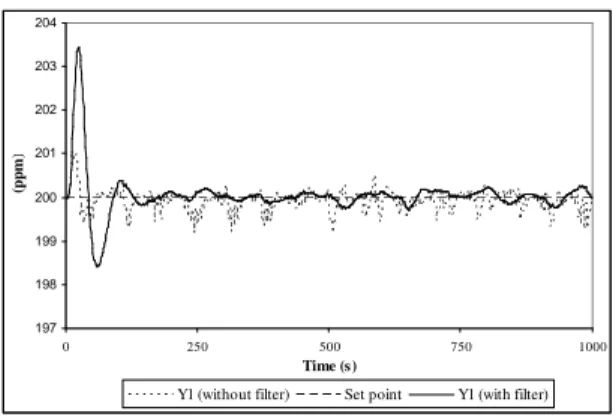
Figure 5 showed the process response when the ANN controller was fed with noisy data: noisy signals between +1 ppm and -1 ppm were added to the ethanol concentrations of the gas phase (Y1|k,
Y1|k-1 and YN+1|k). Furthermore, a step disturbance
of 10% was imposed to YN+1 at initial time.
Control system without filtering were compared to the control system in which the input variables were filtered before their presentation to the ANN control.
In spite of that the ANN controller did not get the controlled variable stabilization in the first case (without filter), its oscillation band was reduced to half of the noisy signal employed: 2 ppm to 1 ppm. For the second case, the ANN controller performance was even better because the filter decreased the oscillation by 75%.
198 199 200 201 202
1 101 201 301
S ample Time, S T
Y
1
|k
,
A
N
N
i
n
p
u
t
v
a
ri
a
b
le
(
p
p
m
)
(a)
198 199 200 201 202
1 101 201 301
S ample Time, S T
Y
1|
k
(A
N
N
in
p
u
t
va
ri
ab
le
)
(p
p
m
)
(b)
Figure 4 - ANN input variable, Y1|k (a) distorted by the noisy signal and (b) filtered.
197 198 199 200 201 202 203 204
0 250 500 750 1000
Time (s)
(p
p
m
)
Y1 (without filter) Set point Y1 (with filter)
CONCLUSIONS
The main contribution of this work is the development and the application of a nonlinear controller, based on an inverse neural network model, to an absorption column. This column recovered the bioethanol evaporated from a fermentation process. The nonlinear behavior of the process challenged the control system design and suggested that conventional techniques did not work properly. The ANN controller developed provided a satisfactory control, in spite of the system characteristics.
Many ANN architectures were tested. According to the Hagan and Foresse criterion (1997), a 5–9–1 network was chosen and the parameters sum of square error and average square error confirmed the choice. Therefore, this was the architecture employed in the ANN controller.
The proposed controller outperformed the DMC strategy (Palú, 2004) because the controlled variable behavior presented smaller overshoot and the response time decreased from 125 to 90 seconds. Furthermore, the ANN controller superiority was also noted through the integral of the square error criterion that became smaller under ANN control.
When disturbances not predicted on the training procedure were inserted, the ANN controlled performance decreased below a critical limit. Therefore a PID controller implementation as a security device was necessary. This arrangement worked very successfully.
The robustness of the ANN controller was also tested for situations in which the gas concentration variables were distorted by the noisy signal. The controlled variable oscillation amplitude was reduced to half of the noisy amplitude applied to ANN input variables. When a digital filter was applied to these data, the results were even better, because the oscillation was reduced to almost 75% of original noisy amplitude.
The present work demonstrated that the nonlinear controller based on an inverse neural network model was very useful to control the absorption column studied. This control technique proved to be successful when the operating conditions were the same that was employed for training purposes.
In addition, the ANN controller worked properly when the ANN input variables were distorted by a noisy signal. The security device implemented turned the control system more robust when unexpected environmental and operating conditions occurred.
ACKNOWLEDGMENTS
The authors would like to thank FAPESP for the financial support (Process number 05/02536-9).
RESUMO
Deseja-se recuperar o etanol perdido por evaporação durante o processo de fermentação da cana-de-açúcar. Para tanto, faz-se uso de uma coluna de absorção. O controle da concentração de etanol no efluente gasoso da coluna é realizado pela manipulação da vazão de solvente, sendo esta determinada pelo controlador não linear proposto, baseado em um modelo inverso de redes neurais (controlador ANN). Foram feitas simulações adicionando-se um sinal de ruído a medida de concentração de etanol na fase gasosa. Quando perturbações degrau foram inseridas na mistura gasosa afluente, o controlador ANN demonstrou desempenho superior ao controle por matriz dinâmica (DMC). Um dispositivo de segurança, baseado em um controlador feedback
convencional, e um filtro digital foram implementados à estratégia de controle proposta para agregar robustez no tratamento de distúrbios ocorridos no ambiente operacional. Os resultados demonstraram que o controlador ANN é uma ferramenta robusta e confiável no controle de uma coluna de absorção.
REFERENCES
Demuth, H., Beale, M. (2002), Neural Network Toolbox User’s Guide for Use with MATLAB®.
Version 4, Reading: Hagan, M. Cap. 5:
Backpropagation. URL:
Hagan, M. T., Foresse, F. D. (1997), Gauss-Newton Approximation to Bayesian Learning. In Proceedings of the 1997 International Joint Conference on Neural
Networks, URL:
http://elec-engr.okstate.edu/mhagan/.
Fileti, A. M. F., Pacianotto, T. A., Cunha, A. P. (2006), Neural modeling helps the BOS process to achieve aimed end-point conditions in liquid steel, Engineering Applications of Artificial Intelligence,v. 19, pp.9-17.
Meleiro, L. A. da C., Costa, A. C. da, Maciel, R. Filho (2005), Non-linear multivariable control of an alcoholic fermentation process using functional link networks, Brazilian Archives of Biology and Technology, 48,7-18.
Najim, K., Ruiz, V. (1995), Long-range predictive control of an absorption packed column. Appl. Math. Modelling. 19, 39-45.
Nunes, G. C., Kincal, S., Crisalle (2003), O. A polynomial perspective on the stability of multivariable predictive controllers. Computers and Chemical Engineering.27, 1097-1111.
Palú, F., Fileti, A. M. F., Pereira, J. A F. R. (2004) Controle preditivo de colunas de absorção com o método de controle por matriz dinâmica. .Paper presented at XV Brazilian Congress of Chemical Engineering (COBEQ), CD-ROM, in portuguese. Pinto, G. A., Sousa Jr, R., Giordano, R. C. (2005)
Comparison of performance of different algorithms in noisy signals filtering of process in enzymatic hydrolysis of cheese whey. Brazilian .Archives of Biology and Technoogy, 48, 151-159.
Roj, E., Wilk (2004), M. Neural network based simulation of the sieve plate absorption column in nitric acid industry.Paper presented at 7th International Conference on Artificial Intelligence and Soft Computing (ICAISC), pp1181-1186. Sherwood, T. K., Pigford, R. L., Wilke, C. R. (1975),
Mass Transfer. McGraw-Hill.