THIS REPORT WAS PREPARED EXCLUSIVELY FOR ACADEMIC PURPOSES BY Inês Montalvão Cunha, A MASTERS IN FINANCE STUDENT OF THE NOVA SCHOOL OF BUSINESS AND ECONOMICS. THE REPORT WAS SUPERVISED BY A NOVA SBE FACULTY MEMBER, ACTING IN A
MERE ACADEMIC CAPACITY, WHO REVIEWED THE VALUATION METHODOLOGY AND THE FINANCIAL MODEL.
(PLEASE REFER TO THE DISCLOSURES AND DISCLAIMERS AT END OF THE DOCUMENT)
M
ASTERS IN
F
INANCE
1Source: World Bank
2Source: Company Reports
C
OMPANY
R
EPORT
03 JANUARY2018
R
OYAL
C
ARIBBEAN
C
RUISES
L
TD
.
C
RUISEI
NDUSTRYS
TUDENT: I
NÊSM
ONTALVÃOC
UNHA[email protected]
Entering the Cruising Golden Age
Sizing the opportunity in the Asia-Pacific region
Recommendation: HOLD
Price Target FY18: $ 123.76
Price (as of 3-Jan-18) $ 120.39
Reuters: RCL.N , Bloomberg: RLC.US
52-week range ($) 81.59-133.75
Market Cap ($m) 25 536 529
Outstanding Shares (m) 214 090
Source: Bloomberg
Source: Bloomberg
(Values in $ millions) 2016 2017E 2018F
Revenues 8 496 9 098 9 707 EBITDA 4 489 4 842 5 165 EBITDA margin 52.8% 53.2% 53.2% Net Profit 1 695 1 546 1 680 EPS ($) 7.92 7.22 7.85 P/E 10.36 16.67 16.64 EV / EBITDA 5.98 5.55 5.2 EV / Revenues 3.16 2.98 2.77
Net Debt to EBITDA 2.08 1.83 1.68 Source: Company Annual Report, Analyst Estimate
▪ With an average 8.5% annual growth in the last 20 years, the cruise industry is the fastest growing segment of the tourism industry, surpassing the later with an average annual growth of 5.6%.
▪ To tackle the growing market demand, which is expected to increase by 60% until 2025, the capacity of Royal Caribbean will increase by 30%.
▪ The Chinese cruise market is the most underpenetrated market, experiencing a compounded annual passengers’ growth rate of 76% over the past five years, being this outlook also designed as the
Golden Age in the cruise industry.
▪ As a consequence, Royal Caribbean has invested significantly in this market with the deployment of four China-based ships, each costing one billion dollars, and a $400 million investment in a two-acre cruise terminal in Taiwan.
▪ From 2014 to 2017, Royal Caribbean doubled its EPS and increased its ROIC from 6% to 10% due to growing revenues yields, cost cutting measures and moderate capacity growth.
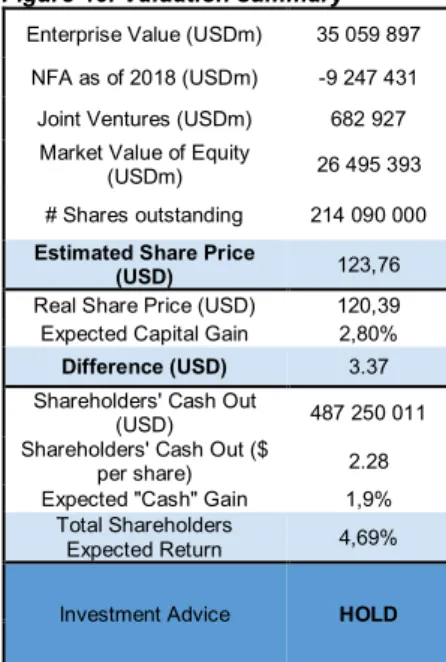
▪ Based on the DCF Model, the estimated share price for the end of 2018 is $123.76, which represents a return of 2.80%, when compared to the share price in the end of 2017. Moreover, the shareholder cash gain in 2018 is predicted to be $2.28, hence, the total expected return would be 4.69%.
Company description
Royal Caribbean Crises Ltd. is the seconds largest cruise company in the world. Founded in 1985, it currently operates 49 ships worldwide and it is known by being the most innovative company in the industry. Its ships cover 535 destinations and it was a pioneer in deploying ships to China.
ROYAL CARIBBEAN CRUISES LTD. COMPANY REPORT
Table of Contents
Executive summary ... 2 Executive summary ... 2 Company Overview... 3 Company description ... 3 Shareholder structure ... 6 The Sector ... 7 Valuation ... 13 Scenario Analysis ... 24 Multiples Valuation... 25 Financials ... 26 Appendix ... 27 Financial Statements ... 29ROYAL CARIBBEAN CRUISES LTD. COMPANY REPORT
Executive summary
Executive summary
• This report is aimed at explaining the valuation made to Royal Caribbean Cruises Ltd., the second largest cruise company in the world with three global brands associated and three joint ventures.
• The Discounted Cash Flow (DCF) method and the Multiples method was used to perform its valuation. In addition, the main revenues drivers for the company are the Number of Passengers, Onboard Spending of each Passenger, Cruise Daily Price, the Average Cruise Length of each Passenger and the Company´s Capacity.
• The industry is expanding considerably: since 2007, its capacity has increased 40% and is expected to increase up to 50% from 2016 to 2027, mainly due to the significant increase in the Chinese cruise market. In a 20 years time span, from 2007 to 2027, designated as the “Golden Age”, the market capacity is expected to increase by 117%1, due to the growing
demand.
• Royal Caribbean has finished, successfully, in 2017, its Double-Double program, which aimed to set its ROIC above 10% and double its earning per share (compared to 2014) – due to this, the company underwent into several cost saving measures and was able to improve its gross margin from 34%, in 2014, to 41%, in 2017, while the average cruise industry gross margin went from 26% to 31%2. Since then, the company is more
efifficent than it ever was, it is unlikely that it will be able to improve more its efficiency, so the gross margin is expected to remain the same. • As the Asian and Pacific market is expected to grow 122% from 2017 to
2025, it is estimated that Royal Caribbean has invested $2,332 billion in the Asian and Pacific market, more specifically in China, and it is forecasted a 12% ROIC for that investment3.
• For the past five years, the number of North American and European Royal Caribbean passengers rose 2.4% annually and, from 2016 to 2025, it is expected a compounded annual passenger growth rate for North America of 2.5% and of 1.5% for the European market.
• This valuation conclusion is twofold: Royal Caribbean Cruises Ltd. is traded at a discount price on 31st of December 2017 and the Expected
Return in the end of 2018 would be 4.69%, considering the Shareholder cash gain.
ROYAL CARIBBEAN CRUISES LTD. COMPANY REPORT
1 Source: “2017 Cruise Industry Infographic.” Cruise Industry News, Aug. 2017 2 Source: Bloomberg
3 Analyst Estimates
4 Refer to Appendix 1: Largest ships by capacity in 2016
5 Source: Lee, Scott, and Sherie Brezina. "Cruise Line Efficiency." Tourism Economics 22.5 (2016) 6 Source: Lee, Scott, and Sherie Brezina. "Cruise Line Efficiency." Tourism Economics 22.5 (2016) 7 Source: “2016 Cruise Industry Infographic.” Cruise Industry News | Cruise News, Aug. 2016 8 Source: Company Report; Analyst Estimates
Figure 1: Average number of
passengers per voyage in 2016 Cruise Line Passengers per Voyage
Royal Caribbean
International 2 991 Carnival Cruise Line 2 722 Disney Cruise Line 2 600
Norwegian Cruise
Line 2 422 Celebrity Cruises 2 193
Source: Lee, Scott, and Sherie Brezina. "Cruise Line Efficiency"
Company Overview
Founded in 1985, Royal Caribbean Cruises Ltd. operates 49 ships that cover approximately 535 destinations worldwide. With its headquarters located in Miami, United States, it is the second largest cruise company in the world. Currently, it not only operates under three global brands - Royal Caribbean
International, Celebrity Cruises and Azamara Club Cruises - but also owns
a 50% joint venture in TUI Cruises, a 49% ownership of the Spanish company Pullmantur and a 35% ownership of the Chinese company SkySea Cruises.
Company description
It was 1988 when Royal Caribbean Cruises Ltd. (referred as Royal Caribbean in this report) launched the world’s first “megaship”, at the time with five decks. Nevertheless, the company continued to invest in its innovative reputation throughout the years: it not only has the biggest ships in the industry, but it is also known for its exclusive on-board activities, such as ice-skating rings, rock climbing walls, surf wave simulators (Flowrider), bumper cars, robot bartenders or exclusive movie theatres where movies are projected in ultra-HD. In fact, Royal Caribbean invested more than any other cruise company in building the biggest ships for Royal Caribbean International. In 2016, six of the ten biggest ships worldwide, were from Royal Caribbean4. This brings
numerous advantages for the company: it is able to achieve more efficiently economies of scale, carry more passengers and have higher on-board revenues5. Due to the fact that its ships have the biggest capacity in the
industry, Royal Caribbean International carries more passengers per voyage that any other cruise line. Nevertheless, Celebrity Cruises is also in this cruise line group that accommodates more passengers per cruise6. Furthermore, in
2016, Royal Caribbean had 24.5% of market share7 in the cruise industry.
In 2014, Royal Caribbean launched its Double-Double program aimed at doubling the 2014 earnings per share (EPS) and increase ROIC above 10% by 2017. Royal Caribbean successfully achieved what was proposed doubling its earnings to $7.22 per share and increasing its ROIC from 6% to 10%8.
ROYAL CARIBBEAN CRUISES LTD. COMPANY REPORT
9 Source: Company Report
10 Source: Jordan, Todd, Felix Wang, and David Benz. "The Math behind Double-Double." Dec. 2014 11 Source: Bloomberg; Analyst Estimates
12 Source: "Royal Caribbean Cruises #111 on the Forbes Top Regarded Companies List." Forbes, May 2017
13 Source: Isemo, Erik, Mats Rosén, and Alexander Svensson. "Segment Transition within the Cruise Line Industry." (2008) 14 Source: Company Report
15 The capacity of each ship is measured by the number of berths (berths are considered a cabin with double occupancy)
Figure 2: Royal Caribbean - EPS and ROIC
Year EPS ($) ROIC
2014 3,43 6,02% 2015 3,02 5,57% 2016 5,93 8,91% 2017 E 7,22 10,10%
Source: Company Report; Analyst Estimates
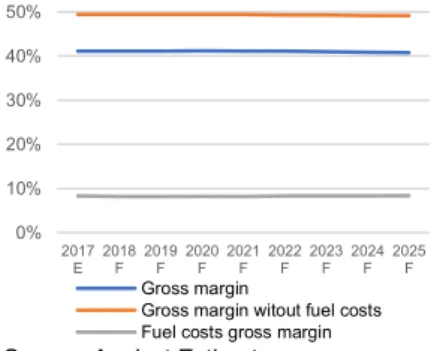
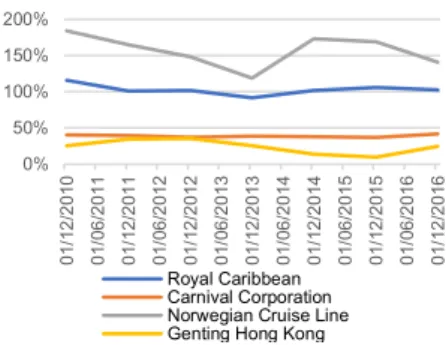
Figure 3: Cruise industry - Margin costs
Source: Company Report; Analyst Estimates
Figure 4: Revenues by brand in 2016
Source: Company Report
Figure 5: Royal Caribbean International capacity
Source: Company Report
increasing its revenues but also due to the adoption of cost cutting measures and low oil prices. In fact, from 2014 to 2017, there was a reduction in food expenses, commissions and transportation costs9, explained by the cut in
commissions given to travel agencies and a decrease on passengers’ shuttle transportation to the docked ships. Moreover, the addition of four new ships, 40% more cost efficient, also enabled a reduction in fuel expenses10. The
company’s gross margin increased from 34%, in 2014, to 41%, in 2017, while the weighted average gross margin of the industry grew from 26% to 31%11.
In fact, the reason why Royal Caribbean, Carnival Corporation and Norwegian Cruise Line have the highest gross margins in the industry is due to their capacity. Being considerable higher than other cruise lines, their capacity allows them to take more advantage of scale economies, as it will be analysed later on this report. In addition, Genting Hong Kong negative gross margin can be explained not only by the start-up costs incurred to launch Crystal Cruises, a new cruise line operating in the luxury cruise market, but also by the increasing competitive environment of this market, causing a slowdown on the company’s revenues. Furthermore, each Royal Caribbean Ltd. brand in only has a strong brand recognition, being ranked by Forbes as one of the world’s top regarded companies12, but also allows the company to have the capacity
to enter several cruise market segments13. Global Brands
Royal Caribbean International (70% of total revenues)
It is considered the best positioned brand within the company generating the biggest bulk of Royal Caribbean’s total revenues14 (70% in 2016). It covers every customer segment due to its attractions for families with children but also for older and younger couples and it is known for delivering the industry’s biggest innovations such as surf wave simulators and rock-climbing walls. Currently, it operates 25 ships, possessing approximately 78,150 berths15, and
its strategy is focused on having a wide variety of itineraries, including 77 visiting port countries around six continents. Cruises can range from two to twenty-four nights, however most cruise lengths are less than seven nights – on average, their length is five nights. At the moment, there are four ships under construction that will enter in service in 2019 and 2020, each with a capacity of
-30% -20% -10% 0% 10% 20% 30% 40% 50% 2012 A 2013 A 2014 A 2015 A 2016 A 2017 E
Royal Caribbean Carnival Norwegian Tui Genting Hong Kong
70% 14%
6% 4%2%4%
Royal Caribbean Celebrity TUI Pullmantur SkySea Azamara 0 20 000 40 000 60 000 80 000 100 000 2012 2013 2014 2015 2016 2017 2018 2019 2020 Number of berths
ROYAL CARIBBEAN CRUISES LTD. COMPANY REPORT
Figure 6: Celebrity Cruises capacity
Source: Company Report
Figure 7: Azamara Cruises capacity
Source: Company Report
5,450 berths, comprising Royal Caribbean International’s total capacity to 91,900 berths.
Celebrity Cruises (14% of total revenues)
Offering a more luxurious cruise vacation than Royal Caribbean International, Celebrity Cruises is known for providing highly personalized customer service, generating 14% of the company’s total revenues. It also delivers upscale destinations, such as Alaska and the Galapagos Islands, on-board amenities that comprise restaurants with Michelin-starred chefs and extensive spa facilities. Cruise lengths can range from two to eighteen nights; however, fifteen nights is the average cruise length of a cruise taken on Celebrity Cruises. It currently operates twelve ships, offering a capacity of 23,170 berths, and until 2022, three more ships are expected, adding an aggregate capacity of 8,700 berths. Each Celebrity Cruise ship can take around 2,000 passengers, nevertheless, the new expected ships will have a capacity of 2,900 berths.
Azamara Club Cruises (4% of total revenues)
Currently, Azamara Club Cruises only operates two small ships, each with a capacity of 700 berths, being accountable for 4% of the company’s total revenues. Being part of a deluxe, boutique cruising niche, the brand delivers an exclusive cruise experience to its guests. Azamara Club Cruises covers the up-market segments due to its high standards accommodations, higher prices and more exotic itineraries. It offers longer cruise itineraries that can range from three to twenty-one nights, but usually have a length of around seventeen nights. It differentiates itself due to its cruises itineraries with more overnights and longer stays in ports, as guests can spend more time in each port and, consequently, enjoy each city for a longer period. In addition, it has also started, in 2017, the Country Intensive Voyages, a program with itineraries focused in one single country, so that guests can have a full immersive experience in that country, in this case, New Zealand, Mexico, Norway, Japan and Spain. Azamara Club Cruises is expecting a new ship, with a capacity for 700 passengers, to enter in service in 2018.
Partner Brands
TUI Cruises (6% of total revenues)
TUI Cruises is a joint venture in which Royal Caribbean owns 50% and TUI AG, a German tourism and shipping company, owns the remaining 50%. It comprises 6% of the total revenues of the company and it was designed to serve the German demand for cruises and activities, consequently, the
0 10 000 20 000 30 000 Number of berths 500 1 000 1 500 2 000 2 500 2012 2013 2014 2015 2016 2017 2018 2019 2020 Number of berths
ROYAL CARIBBEAN CRUISES LTD. COMPANY REPORT
16 Source: Company Report 17 Source: Bloomberg
Figure 8: Average prices ($) per day
Source: Company website
itineraries and services provided are suited to the German market. It currently operates five ships and has a capacity of 1,300 berths and, until 2019, three more ships are expected.
Pullmantur (4% of total revenues)
Pullmantur, responsible for 4% of the company’s total revenues, is a Spanish-based cruise line designed to attract the Spanish-speaking guests, being its main itineraries the Caribbean Sea, the Mediterranean Sea and the Baltic Sea. It was fully owned by Royal Caribbean until August 2016, when this sold 51% of its stake to Springwater Capital. Having Spain and Latin America as target customers, Pullmantur needed to have a different management team that could bring more cultural authenticity to the brand and better tailored experiences for Spanish and Latin American tourists. Nonetheless, the four ships that Pullmantur currently operates are fully owned by Royal Caribbean.
SkySea Cruises (2% of total revenues)
Founded in 2014, SkyaSea Cruises is a joint venture between Royal Caribbean and a Chinese online travel agency, Ctrip, that represents 2% of the company’s total revenues. Each owns 35% of the SkySea Cruises and it represents the first investment made by Royal Caribbean in the “Golden Age”, since SkySea Cruises will only serve the Chinese market. Currently, it only operates one ship, with a capacity of 1,800 berths, and on-board activities and services are all tailored to the Chinese market.
Lastly, prices per day are significantly different within each brand16, as there
are distinct target markets searching for particular on-board experiences and services. Azamara Club Cruises, being a boutique cruise line, with a limited capacity of 700 passengers per ship, sets prices higher than any other cruise line within Royal Caribbean Cruises Ltd.
Shareholder structure
In 1993, Royal Caribbean Cruises Ltd. had its IPO and, currently, its ownership is divided among institutions (62%), mutual funds (37%) and insiders (1%). Furthermore, Vanguard Group Inc. (7.99% of shares), PRIMECAP Management Company (4.9%) and Baillie Gifford & Co. (4.67%)17
are the biggest owners of Royal Caribbean Cruises Ltd. 114 138 147 149 246 0 50 100 150 200 250 300
ROYAL CARIBBEAN CRUISES LTD. COMPANY REPORT
18 Source: “2016 Cruise Industry” Cruise Industry News | Cruise News, Aug. 2016
19 Source: Brida, Juan Gabriel, and Sandra Zapata. "Cruise Tourism: Economic, Socio-cultural and Environmental Impacts." (2010)
Figure 9: Passengers carried worldwide
Source: “2016 Cruise Industry” Cruise Industry News | Cruise News, Aug. 2016
Figure 10: Cruise industry - Capacity of the biggest ship in each year
Source: Company Report
Figure 11: Cruise industry - Historical revenues by segment
Source: Company Report
The Sector
Industry Growth
In the last 20 years, the cruise industry has been growing with an average annual growth rate of 8.5%, meaning that there were more 90 million passengers cruising over that period. From this additional number of passengers, 54 million (60%) were generated over the past ten years18. In
fact, in 1996, the cruise industry only comprised 4.97 million passengers, however, this number started rising - in 2006, it reached 12 million passengers and, in 2016, 24.2 million passengers cruised globally.
Furthermore, the cruise industry has been under a considerable expansion since 2000 due to several reasons: firstly, the increase in ships capacity, followed by the development of new portfolios of cruise itineraries and lastly, the growth in the cruise market in the Asiatic region. Regarding the first reason, the turning point of the cruise industry was when “mega” ships started being built and launched in the market. This began with the debut, in 2004, of Cunard’s Queen Mary 2, owned by Carnival Corporation, with a total capacity of 3,800 berths, being the biggest ship ever built. Nevertheless, in 2006, Royal Caribbean surpassed it with the launch of the Freedom of the Seas that comprised 4,370 berths, recognizing it as the biggest ship in the world, and, for the following two years, debuted other two ships with the same capacity19.
After these events, the biggest cruise line companies started building ships with larger capacity, allowing them to take advantage of economies of scale by lowering their operating expenses and, consequently, decreasing cruise prices. Hence, it was possible to transform the cruise tourism from a luxury tourism to a mass tourism, affordable to the middle class. In addition to this, cruise lines with bigger ships can have more on-board activities, attracting more tourists and different generations, and, as capacity increases, on-board revenues also increase which helps companies to lower cruise prices. Moreover, as mentioned before, the second reason that lead to this expansion was the addition of new destinations to cruise itineraries. Currently, on average, cruise companies cover 500 destinations per year while, in 1998, on average, they were only able to cover 50 destinations. In fact, one way for cruise lines to differentiate themselves is through its itineraries. Thus, companies are investing more and more in bringing new and different
0 5 10 15 20 25 19 90 19 92 19 94 19 96 19 98 20 00 20 02 20 04 20 06 20 08 20 10 20 12 20 14 20 16
Number of passengers (millions)
0 2 000 4 000 6 000 8 000 19 91 19 93 19 95 19 97 19 99 20 01 20 02 20 04 20 06 20 08 20 10 20 12 20 14 20 16 Number of berths 0% 50% 100% 20 01 20 02 20 03 20 04 20 05 20 06 20 07 20 08 20 09 20 10 20 11 20 12 20 13 20 14 20 15 20 16
Onboard and other revenues Passenger ticket revenues
ROYAL CARIBBEAN CRUISES LTD. COMPANY REPORT
20 Source: Chua, Bee-Lia, Sanghyeop Lee, and Heesup Han. "Consequences of Cruise Line Involvement: A Comparison of First-time and Repeat Passengers." (2016)
21 Source: "Asia Cruise Trends 2017" Cruise Line International Association. July 2017 22 Source: "Asia Cruise Trends 2017" Cruise Line International Association. July 2017 23 Source: "Asia Cruise Trends 2017" Cruise Line International Association. July 2017 24 Source: "Asia Cruise Trends 2017" Cruise Line International Association. July 2017
25 Source: Lee, Scott, and Sherie Brezina. "Cruise Line Efficiency" Tourism Economics 22.5 (2016) 26 Source: Lee, Scott, and Sherie Brezina. "Cruise Line Efficiency" Tourism Economics 22.5 (2016)
Figure 12: Cruise passengers from Asia
Source: "Asia Cruise Trends 2017" Cruise Line International Association. July 2017
destinations to its itinerary portfolio not only to appeal to passengers that already did a cruise but also to attract first-timers20. Some of these new
destinations that are starting to be explored are, for instance, the African West Coast, Central Africa, the Norwest Coast of South America, the Indonesian Islands and Madagascar.
Furthermore, the third most important reason that contributed for the major growth of the cruise industry is due to the Asiatic region that has seen the biggest travel’s sector growth on the last ten years. From 2012 to 2016, the number of passengers increased from 775,000 to 3.1 million21, which can be
translated into a compounded annual growth of 41% for the past four years. The cruise industry started investing significantly in Asiatic ports and destinations in 201222. In addition, the growing middle class and rising
disposable income in China, Japan and India, as it will be analysed later on in this report23, are the main reasons behind the growth in this market. Besides
that, the Chinese market is the biggest contributor for the increase in the Asiatic cruise market as 67.8% of passengers are Chinese24.
Lastly, the cruise industry enjoys unique advantages when compared to other industries – in fact, ships are considered floating cities and cruise companies use this element when marketing cruises25, by considering them as
destinations by themselves, giving more emphasis to the ship than ports of call. In addition to this, cruise line itineraries have direct and significant effect on each ship’s occupancy rate26. Being able to change itineraries flexibly,
exploiting what is best in a certain time, gives them an advantage when compared to hotels and resorts, which are fixed to one destination.
Existing Competition
The major players of the industry, in terms of market share, are Carnival Corporation (whose main brand is Carnival Cruise Line), Royal Caribbean Cruises Ltd., Norwegian Cruise Line, Genting Hong Kong, Disney Cruise Line (owned by Walt Disney Parks and Resorts) and MSC Cruise Line (a privately held company). Nevertheless, it is still important to consider the hotel industry
0 500 1 000 1 500 2 000 2 500 3 000 3 500 2012 2013 2014 2015 2016 Number of passengers (thousands)
ROYAL CARIBBEAN CRUISES LTD. COMPANY REPORT
27 Source: Brida, Juan Gabriel, and Sandra Zapata. "Cruise Tourism: Economic, Socio-cultural and Environmental Impacts." (2010) 28 Source: Brida, Juan Gabriel, and Sandra Zapata. "Cruise Tourism: Economic, Socio-cultural and Environmental Impacts." (2010) 29 Source: Brida, Juan Gabriel, and Sandra Zapata. "Cruise Tourism: Economic, Socio-cultural and Environmental Impacts." (2010)
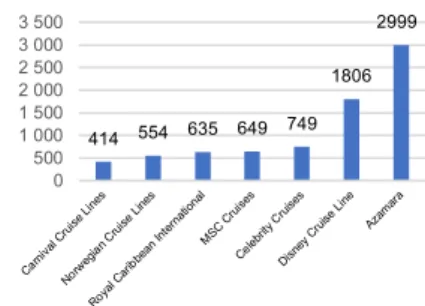
Figure 13: 2016 Market share by cruise company
Source: Lee, Scott, and Sherie Brezina. "Cruise Line Efficiency" Tourism Economics 22.5 (2016)
Figure 14: 7 nights cruise - Average price ($)
Source: Company website
as a competitor, more specifically, all-inclusive resorts since those are the ones that have more similarities to cruises as both are all-inclusive.
Due to the industry’s need to incur in higher costs to finance its development by building bigger ships, the industry had several merges in the 1990s. However, as it happened in the automobile industry, cruise line companies kept different brands within each cruise line holder. For instance, Royal Caribbean International merged with Carnival Cruises, originating a new company named Royal Caribbean Cruises Ltd. that would be the holding corporation of Royal Caribbean International and Carnival Cruise lines. The consolidation of the cruise industry created few cruise line holdings, however, each holding kept different brands within itself.
Moreover, prices within cruise lines can be significantly different as companies compete under a differentiation strategy employing distinctive branding and marketing campaigns. For instance, Carnival Cruise Line is known for being a low-cost firm and having the best private owned island, while Azamara Club Cruises offers a luxury experience. In addition, Celebrity Cruises has been recognised for its exceptional food, Royal Caribbean International for the best facilities, MSC Cruises for the best European style and Disney Cruise Line for its resemblance of its famous Orland Park27.
Bargaining Power of Suppliers
In this oligopoly, the size of the market affects the players’ ability to exploit economies of scale in contrasting ways: firstly, since there are only a few shipbuilders and technology developers in the cruise industry, cruise companies are forced to accept the price charged and have almost no power regarding that, however, as there is a large number of suppliers for needs like equipment, food and fuel, cruise companies can have a lot of power to negotiate the prices charged by those28.
Threat of New Entrants
The strong industry growth could have brought a lot of new players to the industry, however, it is an industry with high entry barriers, such as heavy capital requirements, license restrictions and increasing economies of scale. In 2016, only five companies supplied 80% of the market29, being considered
an oligopoly since few major companies are responsible for its supply. 44% 25% 9% 7% 15% Carnival Corporation Royal Caribbean Norwegian Cruise Lines MSC Cruises Others 414 554 635 649 749 1806 2999 0 500 1 000 1 500 2 000 2 500 3 000 3 500
ROYAL CARIBBEAN CRUISES LTD. COMPANY REPORT
30 Source: Lee, Scott, and Sherie Brezina. "Cruise Line Efficiency." Tourism Economics 22.5 (2016) 31 Source: Lee, Scott, and Sherie Brezina. "Cruise Line Efficiency." Tourism Economics 22.5 (2016)
32 Source: Toh, Rex S., Mary J. Rivers, and Teresa W. Ling. "Room Occupancies: Cruise Lines Out-do the Hotels." (2005)
Furthermore, all the existing main players detain a competitive advantage that would be hard to beat by a potential new player in the market. As mentioned before, by possessing the biggest ships in the industry, Royal Caribbean holds a competitive advantage due to not only its wide range of activities and amenities on board, but also due to its ability to efficiently take advantage of economies of scale30. In addition to that, with a strong brand, Carnival Cruise
Line is the world´s largest cruise line with the biggest share of supply in the industry, providing the widest variety of itineraries and ships compared to others. Disney Cruise Line, owned by Walt Disney Parks and Resorts, can be considered the company with the biggest competitive advantage. Although it only possesses four ships, its ships are designed so that all cabins can take more than two passengers, making it the ideal option for families with children. On the other side, the typical ship cabin of Carnival Corporation and Royal Caribbean can only accommodate two passengers, being unable to provide a more practical solution to this segment. Hence, the design of Disney Cruise Line ships gives them a strategic advantage when targeting families that prefer to travel together. As a matter of fact, this aspect is very hard to replicate by competitors in a nearby future since building the ship is one of the most expensive phases of these companies’ value chain. Moreover, if competitors were to change their current ships in a way that its berths would accommodate more passengers it would be a very costly process, which would also imply that they would have to increase the number of lifeboats, seats in the on-board restaurants and so on31.
Threat of Substitutes
As all-inclusive resorts are more similar to cruises, due to their all-inclusive element, which regular hotels or other types of resorts do not include, in this valuation, all-inclusive resorts will be considered the main indirect competitor for cruise lines when considering other kind of land-based vacation. However, there are many characteristics that distinguish both. While the cruise industry is in a growth stage, land based resorts are in a maturity stage of the tourism industry32. In one hand, resorts, having more physical
space, can provide more and a wider range of activities to its guests. They are also able to provide more comfort since rooms and facilities can be bigger. On the other side, cruises’ greatest advantage is the possibility of providing guests the opportunity to visit different cities in one single journey in a short
ROYAL CARIBBEAN CRUISES LTD. COMPANY REPORT
33 Source: Santos, VERÔNICA. "Turismo Brasileiro Contemporâneo: O Conflito Entre Cruzeiros E Resorts." (2009)
34 Source: Masiero, Lorenzo, and Juan L. Nicolau. "Price Sensitivity to Tourism Activities: Looking for Determinant Factors." (2012) 35 Source: Santos, VERÔNICA. "Turismo Brasileiro Contemporâneo: O Conflito Entre Cruzeiros E Resorts." (2009)
36 Source: “Cruise Travel Report 2017” Cruise Line International Association. January 2017 37 Source: “Cruise Travel Report 2017” Cruise Line International Association. January 2017 38 Source: “Cruise Travel Report 2017” Cruise Line International Association. January 2017 39 Refer to Appendix 2: Cruise industry - Passengers capacity
40 Source: Hung, Kam, and James F. Petrick. "Why Do You Cruise? Exploring the Motivations for Taking Cruise Holidays, and the Construction of a Cruising Motivation Scale." Tourism Management 32.2 (2011)
41 Millennials are considered the demographic group which date of birth is between 1982 - 1998 42 Generation X are considered the demographic group which date of birth is between 1967- 1981 43 Source: “Cruise Travel Report 2017” Cruise Line International Association. January 2017 44 Source: Analyst Estimates
Figure 15: Best overall type of vacation
Source: “Cruise Travel Report 2017” Cruise Line International Association. January 2017
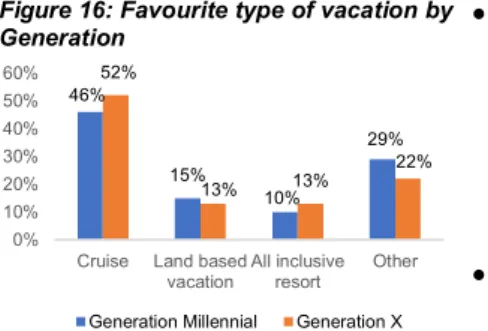
Figure 16: Favourite type of vacation by Generation
Source: “Cruise Travel Report 2017” Cruise Line International Association. January 2017
period of time. Another factor that enables cruises to provide a different experience to its guests33 is the existence of a casino on-board, which is
barred to resorts due to local legislations. In terms of prices, a factor that can be decisive for many consumers34, cruises can offer cheaper packages than
resorts35. Studies have found that 65% of people that already experienced a
cruise holiday believe this is the best type of vacation, while only 5% prefer an all-inclusive land based resort36. Moreover, regarding the best type of
vacation for people that have never taken a cruise, the non-cruisers, 13% of these rated all-inclusive resorts, 25% rated land-based vacation trips and 13% rated cruise vacations37. This demonstrates that cruise guests are loyal, and,
after their first cruise vacation, it is very likely that they repeat the experience. In fact, 92% of cruise guests rated that they will probably do it again and 60% rated that they will definite do it again38. Considering the facts stated, it is
assumed that, in the following years, the demand growth will not be affected by the hotel and resort industry.
The Future of the Cruise Industry
The cruise industry is now experiencing its largest growth and it is only expected to stabilize in 2030. The events that the industry is now undergoing are behind the main reasons that support this argument:
• There is a significant increase in the overall industry supply39, as
companies not only build bigger ships, but also invest in better amenities, create theme cruises and cover more destinations, leading to the increase of the attractiveness of going on a cruise for vacations, which consequently, leads to an increase in the number of passengers40.
• The industry has been able to attract different segments to go into cruise vacation, as 46% of the Millennials41 and 52% of Generation X42, rated
cruises as the best type of vacation43, which may be translated into more
100 million potential cruise passengers from both generations44. 65% 8% 7% 13% 25% 13% 0% 20% 40% 60% 80% Cruise Vacation Land-based Trip All-inclusive Resort Cruisers Non-Cruisers 46% 15% 10% 29% 52% 13% 13% 22% 0% 10% 20% 30% 40% 50% 60%
Cruise Land based
vacation All inclusiveresort Other
ROYAL CARIBBEAN CRUISES LTD. COMPANY REPORT
45 Source: "2017-2018 Cruise Industry Annual Report." Cruise Industry News. 2017 46 Source: “Cruise Travel Report 2017” Cruise Line International Association. January 2017 47 Analyst Estimates
48 Source: "Cruise Tourism White Paper." Cruise Lines International Association. 2014 49 Source: “Cruise Travel Report 2017” Cruise Line International Association. January 2017
• Consumers are increasingly using certified cruise travel agents, which will help to increase the awareness of cruises and, consequently, increase the number of passengers45. In 2016, 82% of cruisers booked their trip
with travel agents46 and, while in 2010 there were only 12,000 travel
agents, in 2016 there was 25,000 and it is estimated that by 2015 that number reaches 50,00047.
• There is still a low market penetration ratio that can be seen has an opportunity to explore – approximately, only 18% of the US population has experienced a cruise vacation. Also, 86% of cruise travellers want to take another cruise in the next 3 years, and 52% of non-cruise travellers want to take a cruise48.
• Demand will keep increasing in the long-run, mainly due to increasing awareness, raising penetration in developing countries, the aging population in developed markets and the growing middle-class, which, in 2016, represented respectively 56% and 25% of cruise guests49.
The Cruise Industry Challenges
There are some challenges that can affect the exponential growth of the cruise industry: firstly, almost 70% of passengers are from North America and Europe - therefore, if there is a setback in the recovery of the American and European economy, it can be a headwind for the industry growth. In addition to this, a hindrance in the economy of Asia, specifically in the Chinese economy, can also affect the cruise industry growth. Besides, the cruise industry has taken advantage of low fuel prices for the past three years, however, since it is one of the biggest variable costs for cruise lines, a sizable increase in fuel prices can increase daily cruise fares and, consequently, provoke a loss in passengers. Terrorisms attacks, adverse weather and natural disasters as hurricanes also offer obstacles to the industry. Nevertheless, companies have demonstrated its flexibility when facing these adversities, changing cruise itineraries and strengthening cruise ports.
ROYAL CARIBBEAN CRUISES LTD. COMPANY REPORT
50 Source: "State of the Industry 2016 Report." Cruise Industry News | Cruise News. Mar. 2016 51 Source: Lee, Scott, and Sherie Brezina. "Cruise Line Efficiency." Tourism Economics 22.5 (2016) 52 Analyst Estimates
53 Source: Company Report
54 Source: Royal Caribbean Aug 2017 Press Release
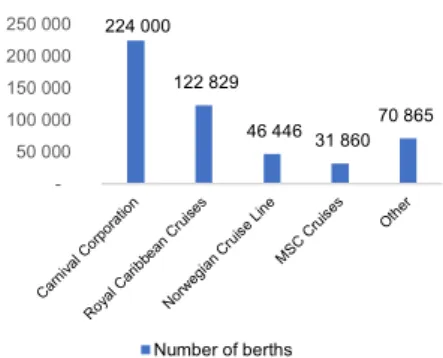
Figure 17: 2016 Capacity by cruise line
Source: "State of the Industry 2016 Report." Cruise Industry News | Cruise News. Mar. 2016
Figure 18: Royal Caribbean - Total berth capacity
Source: Company Report; Analyst Estimates
Valuation
To valuate Royal Caribbean Cruises Ltd., two valuation methods were chosen: the DCF Model for the valuation of its core operations and for the valuation of its Financial Investments, the three joint ventures, the Multiples Model was used. Since the industry is growing significantly, the DCF Model was divided in predicting cash flows until 2030; whereas until 2025 there is high and unstable growth and from 2025 to 2030 there is a stable but still high growth rate. Then, the prediction of the company’s terminal value is based on 2030, year in which the industry growth is expected to stabilize and match the economy growth rate.
The Capacity of Royal Caribbean Cruises Ltd.
In 2016, Royal Caribbean Cruises Ltd. comprised a total capacity of 122,128 berths, which represented 25% of the industry total capacity. Currently, the cruise industry has a total capacity of 496,000 berths, being Carnival Cruise Line the company with the largest capacity, 44% of the total industry capacity, while 9% resides with Norwegian Cruise Lines and MSC cruises encompasses 6%50.
As it was mentioned, it is estimated a growing demand for cruises: assuming an average industry occupancy rate of 103%51, there will be an
increase from 24.18 million passengers, in 2016, to 38.68 million, in 2025,
corresponding to a 60% increase52. To answer this event, it is expected that
Royal Caribbean Cruises Ltd. increases its capacity by 31% from 2016 to
2025, reflecting an incremental investment in ships of $7.5 billion. Accordingly, Royal Caribbean announced that eight new ships would be added to Royal’s fleet until 202253. Nonetheless, to the growing demand and the supply trend
within the industry in previous years, this valuation forecasts that ten new ships will be added to the fleet until 2025. As part of the company’s investment in China, Royal Caribbean International is expecting four new ships to operate until 2022. In like manner, one of these ships, Spectrum of the Seas, is designed specifically for guests in China54. This investment can be translated
into a total incremental berth capacity of 22% for Royal Caribbean International. In the same fashion, Celebrity Cruises is expecting six new generation ships, constituting a 60% incremental berth capacity, while
224 000 122 829 46 446 31 860 70 865 50 000 100 000 150 000 200 000 250 000 Number of berths 0 20 000 40 000 60 000 80 000 100 000 120 000 140 000 160 000
Azamara Club Cruises Celebrity Cruises
ROYAL CARIBBEAN CRUISES LTD. COMPANY REPORT
55 Source: Company Report
56 Refer to Appendix 2: Cruise industry - Passengers capacity
57 Source: Masiero, Lorenzo, and Juan L. Nicolau. "Price Sensitivity to Tourism Activities: Looking for Determinant Factors." Tourism Economics 18.4 (2012)
58 Source: “2017 Cruise Industry Infographic.” Cruise Industry News | Cruise News, Aug. 2017
59 It is assumed the country inflation where the biggest source of passengers are from (United States, Euro zone, China and Australia)
Figure 19: Royal Caribbean - 2016 Segmented revenues
Source: Company Report
Figure 20: Average daily cruise price ($)
Source: Company Report; Analyst Estimates
Figure 21: Average cruise length (number of nights)
Source: Company Report
Azamara Club Cruises will increase from two to four its exclusive fleet, generating an incremental berth capacity of 10%.
Revenues
Being total revenues segmented into Passengers Ticket Revenues and On-board Revenues, it was assumed that the main revenues drivers for the business would be the Number of Passengers, On-board Spending of each Passenger, Cruise Daily Price, the Average Cruise Length of each Passenger and the Company´s Capacity. The passenger ticket revenues depend on the cruise daily prices and passenger cruise days, which consequently relies on the number of passengers and on the length of each passengers’ cruise.
Cruise’s Daily Price and Average Length
Overall, cruise daily prices have been stable during the past years. As a matter of fact, for the past four years, the annual growth prices for Azamara Club Cruises was 0%, while Celebrity Cruises and Royal Caribbean annual growth prices were, respectively, 0.1% and -0.4%55. The main reason behind
stable daily prices was the increase in supply56 and, consequently, the
pressure was reflected in final prices. Taking into consideration the price sensitivity of passengers when choosing between cruise lines57, prices did not
increase in the past years. For the years forecasted, as industry supply increases58, pressure in prices increase as well, nevertheless daily cruise
prices are expected to remain stable until 2021, despite the growing demand. In 2021, as the market supply starts to level up, it is expected that daily prices will start to stabilize in real terms, until 2025. From 2025 onward, daily prices
will fully stabilize in real terms as they are expected to mirror the expected
inflation59 in different countries.
Furthermore, the average cruise length for Royal Caribbean International is six nights, while for Celebrity Cruises is ten nights and for Azamara is 21 nights. Since Royal Caribbean International, Celebrity Cruises and Azamara Club Cruises have been experiencing a steady average number of nights for the past 5 years and as it is not expected any fundamental change in the length of itineraries for the near future, the average length of each cruise was assumed to remain constant for the forecasted period.
72,4% 27,6%
Passenger ticket revenues Onboard and other revenues
166 166 168 171 173 176 124 125 127 129 130 132 282 285 288 292 296 301 115 165 215 265 315
Royal Caribbean International Celebrity Cruises
Azamara Club Cruises
0 2 4 6 8 10 12 14 16 18 2012 2013 2014 2015 2016
Royal Caribbean International Celebrity Cruises
ROYAL CARIBBEAN CRUISES LTD. COMPANY REPORT
60 Refer to Appendix 3: Royal Caribbean – Passengers source analysis 61 Source: Company Report
62 Source: Company Report
63 Source: International Monetary Fund 64 Analyst Estimates
65 Source: "2017-2018 Cruise Industry Annual Report." Cruise Industry News. 2017
Figure 22: Royal Caribbean - Passengers carried
Source: Company Report; Analyst Estimates
Figure 23: Royal Caribbean - Passengers carried from North America
Source: Company Report; Analyst Estimates
Figure 24: North America – Industry passenger capacity (millions)
Source: Company Report; Analyst Estimates
Number of Passengers Forecast
From 2016 to 2025, it is forecasted a 45% increase in the number of
passengers carried by Royal Caribbean, expanding from 5.7 million
passengers to 8.5 million passengers. Nevertheless, to forecast the number of passengers for the future years, it was necessary to carry a geographic split so that the passengers’ origin could be further analysed. Hence, North American, European, Asia-Pacific and other regions were examined. Due to the predicted passengers’ growth in the Asia-Pacific region, it is expected that the source of Royal Caribbean passengers’ changes significantly in regard to passengers from Europe, Asia and Pacific60.
North American Passengers
In 2016, 52% of the total Royal Caribbean passengers were originally from North America61. For the past four years, the market has seen a 2.7% average
annual growth of North America passengers. Despite being the biggest in the world, there is still a very low industry penetration ratio in the North American cruise market. In 2016, only 3.5% of the North America population went on a cruise vacation62. The North American prospective passengers demand is
expected to keep increasing due to the expected economy growth in the region63, with an average annual growth of 1.9% until 2022, and increased
market supply. As a matter of fact, in 2025, 4.1% of North American population is expected to go on a cruise vacation, representing a 25% market penetration increase compared to 201664.
Moreover, based on ship orders from cruise companies65, it is expected that
the North American capacity will increase by 47% until 2027. In fact, Royal Caribbean is increasing its capacity in North America by 49%, while Carnival is increasing by 26% and Norwegian Cruise Lines by 42%. Disney Cruise Lines, MSC Cruises and other cruise lines are also increasing their capacity. As Royal Caribbean will increase significantly its supply in the next few years in North America, it is expected that, until 2019, the growth in passengers will increase more that the United States economy. However, after 2019, despite the still low penetration in the market, the significant increase in the industry supply will start to be perceived and the growth in Royal Caribbean
0 1 500 3 000 4 500 6 000 7 500 9 000
Number of passengers (thousands)
0 1 000 2 000 3 000 4 000 20 12 20 13 20 14 20 15 20 16 20 17 E 20 18 F 20 19 F 20 20 F 20 21 F 20 22 F 20 23 F 20 24 F 20 25 F
Number of passengers (thousands)
6,1 7,7 4,1 6,1 2,1 3 1,4 2,5 13,7 19,3 0 5 10 15 20 2017 2027
Carnival Corporation Royal Caribbean Norwegian Cruise line Other cruise lines
ROYAL CARIBBEAN CRUISES LTD. COMPANY REPORT
66 Assumed to be 2% based on International Monetary Fund 67 Source: Company Report
68 Analyst Estimates
69 Source: "Asia Cruise Trends 2017" Cruise Line International Association. July 2017 70 Source: Company Report
71 Analyst Estimates
72 Source: "Australia 2016 - Source Market Report." Cruise Lines International Association. May 2017
Figure 25: Royal Caribbean - Passengers carried from Europe
Source: Company Report; Analyst Estimates
Figure 26: Cruise industry – Passengers carried from Asia - Pacific regions (thousands)
Source: Company Report
Figure 27: Cruise industry – Passengers carried from Australia (thousands)
Source: "Australia 2016 - Source Market Report." Cruise Lines International Association. May 2017
passengers for the forecasted years is expected to be aligned with the United States’ GDP growth forecast66.
European Passengers (27% of Royal Caribbean Passengers)
For the past four years, the average annual growth of passengers from Europe was 2%. In 2016, Europe was a very underpenetrated market - only 1.24% of the population went on a cruise vacation67. Royal Caribbean strategy for the
future is not focused on increasing its market share in Europe but to increase its capacity in the region at the same pace as the industry grows. Moreover, the European passenger growth depends mainly on the European economy recovery. For that reason, the annual growth of passengers is forecasted to be the same as the growth of the European economy and, in 2025, it is estimated that 1.4% of the European population goes on a cruise vacation, implying a 15% market penetration (number of passengers per total population in that year) increase compared to 201668. While, in 2016, Royal
Caribbean carried 1.569 million European passengers, it is expected to carry 1.778 million passengers by 2025.
Asia-Pacific Passengers (15% of Royal Caribbean Passengers)
Between 2012 and 2016, there was an annual passenger growth of 21% in the Pacific Region, increasing from 774,944 to 1.7 million passengers. In addition, the number of passengers from Asia increased 41% annually, from 775,000 passengers, in 2012, to 3.1 million passengers, in 201669.
Furthermore, the main origins of Asia-Pacific passengers are Australia and China. In the Asia-Pacific region, there was a market penetration ratio of 0.09% in 201670, however, as it will be explained further on, it is estimated
that, in 2025, 0.28% of the Asia-Pacific population will go on a cruise71.
Referring to the Australian market, it is the most penetrated worldwide, e.g. in 2016, 5.3% of the Australian population went on a cruise. In 2016, there was a 21% increase in passengers from Australia when compared to 2015, and a 500% increase when compared to 200672. For the past 10 years, the
compounded annual growth of the Australian market was 20% and, as it is unlikely to keep growing at that rate, it is assumed that the passengers’ growth is expected to decrease until 2030 and adopt the Australian economy growth.
0 500 1 000 1 500 2 000 20 12 20 13 20 14 20 15 20 16 20 17 E 20 18 F 20 19 F 20 20 F 20 21 F 20 22 F 20 23 F 20 24 F 20 25 F
Number of passengers (thousands)
775 1 205 1 553 2 003 3 098 775 941 1 108 1 271 1 666 0 500 1 000 1 500 2 000 2 500 3 000 3 500 2012 2013 2014 2015 2016 Asia Pacific 0 200 400 600 800 1 000 1 200 1 400 Number of passengers
ROYAL CARIBBEAN CRUISES LTD. COMPANY REPORT
73 Analyst Estimates
74 Source: "Asia Cruise Trends 2017" Cruise Line International Association. July 2017
75 Source: "Australia 2016 - Source Market Report." Cruise Lines International Association. May 2017 76 Source: "Australia 2016 - Source Market Report." Cruise Lines International Association. May 2017 77 Source: Kalosh, Anne. "Royal Caribbean Continues to Battle China Skeptics.”. Aug. 2016
78 Source: Royal Caribbean Mar 2015 Press Release
79 Source: Xu, Ke. "China's Cruise Industry: Progress, Challenges and Outlook." (2016) 80 Analyst Estimates
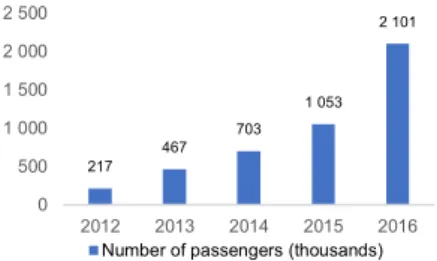
Figure 28: Cruise industry – Passengers carried from China (thousands)
Source: "Asia Cruise Trends 2017." Cruise Line International Association. July 2017
Figure 29: 2016 Market penetration ratio by origin
Source: "Australia 2016 - Source Market Report." Cruise Lines International Association. May 2017
Figure 30: 2016 Market growth by origin
Source: "Australia 2016 - Source Market Report." Cruise Lines International Association. May 2017
Furthermore, it is estimated that, in 2025, 7.3% of the Australian population will go on a cruise, a 55% increase compared to 201673.
China – The driver for the “Golden Age” of the Cruise Industry
The large growth in the cruise industry is mainly justified by the growth in the Chinese cruise industry. For the past five years, the compounded annual growth rate of cruise passengers from China was 76%74.
As a matter of fact, China currently possesses the biggest market cruise potential being the most underpenetrated market in the world - only 0.2% of the Chinese population took a cruise in 201675. In addition to this, in the past
ten years, it also enjoyed the highest growth in terms of passengers, and this trend is expected to remain until 203076. For the above reasons, the growth
potential for Royal Caribbean in this regional environment is tremendous. In 2015, 9% of Royal Caribbean total capacity was comprised in the Chinese market77. Since then, Royal Caribbean has invested highly in this market - in
2015, it deployed four ships to offer numerous regional cruises and started building new ships designed to address the Chinese regional market requirements 78.
Moreover, Royal Caribbean and Carnival Corporation were the first cruise companies to deploy several ships in order to tap this growing market. The cruise lines that own 80% of the world’s cruise share, currently possess a 95% share of the Chinese market79. For that reason, it is forecasted that, in the
following two years, Royal Caribbean, retaining 30% of the Chinese market share, will take advantage of the exponential increase in demand.
As the Chinese demand is predicted to keep growing, the Chinese market is expected to become the world biggest cruise market, overcoming the North American market. In 2025, the market penetration ratio in China is estimated to be 0.6%, which means that, in 2025, it is envisioned a 230% increase of Chinese cruise passengers when compared to 201680. The Chinese demand
is expected to thrive, not only due to the increasing awareness of the cruise industry caused by the increasing number of Chinese passengers cruising, but also due to the Chinese government measures to promote an increase in 217 467 703 1 053 2 101 0 500 1 000 1 500 2 000 2 500 2012 2013 2014 2015 2016
Number of passengers (thousands)
5,6% 3,6% 0,2% 0% 1% 2% 3% 4% 5% 6%
Australia North America China
21% 2% 89% 0% 20% 40% 60% 80% 100%
ROYAL CARIBBEAN CRUISES LTD. COMPANY REPORT
81 Source: "China Encourages Worker Holidays to Boost Domestic Consumption." Financial Times, 12 Aug. 2015 82 Source: Xu, Ke. "China's Cruise Industry: Progress, Challenges and Outlook." (2016)
83 Source: Xu, Ke. "China's Cruise Industry: Progress, Challenges and Outlook." (2016)
84 Source: Smith, Oliver. "China Plots Domination of the Global Cruise Market." The Telegraph. Feb. 2016 85 Source: Lyu, Dong. "Cruises Boom as Millions of Chinese Take to the Seas." Bloomberg Report, May 2017 86 Source: Xu, Ke. "China's Cruise Industry: Progress, Challenges and Outlook." (2016)
87 Analyst Estimates
Figure 31: Royal Caribbean -
Passengers carried from Asia – Pacific region
Source: Company Report; Analyst Estimates
worker holidays with the purpose of boosting tourism81. Moreover, the Chinese
Ministry of Transport plans to upgrade the infrastructure of 12 ports before 2030, in order to receive several mega cruise ships at the same time82. In
addition to this, the noticeable increase of the Chinese middle class and its disposable income are also important factors to take into consideration: in 2015, 15.28 million Chinese people were considered rich, being estimated that this group will be potential customers for the Chinese cruise industry83. In a
joint venture with the Taiwanese government, Royal Caribbean invested in a $530 million two-acre cruise terminal on a former military base that opened in 201784.
Nevertheless, there are several challenges Royal Caribbean still encounters in China: firstly, there is still a limited overall port capacity; secondly, being an American company, Royal Caribbean faces numerous challenges with Chinese regulations; lastly, the biggest challenge is considered to be the increasing local market competition, as Chinese companies are starting to build their own ships85. These companies can possess competitive advantage
as they are Chinese based which can help them in adapting to the fast-changing tastes of Chinese consumers thus better addressing their specific needs. Simultaneously, they are able to better adjust shipment requirements for the Chinese market cultural sensitivities, i.e., ships that are assigned to the Chinese market need to have bigger shopping areas rather than open docks86.
For these reasons, it was assumed a declining growth rate for Royal Caribbean passengers from Asia and Pacific, as the supply in the market increases. Even though the penetration ratio in the region will increase significantly, it is expected an increasing market supply - in 2020, Chinese cruise companies will enter the market, surpassing other cruise companies, due to their competitive advantage, already mentioned before87. For that
reason, it is assumed that Royal Caribbean will decrease its initial market share of 30% to 20% in China. Nevertheless, despite the slowdown in the passengers’ growth rate, Royal Caribbean, in 2019, will carry the same number of European passengers and Asia-Pacific passengers. Withal, from
0 500 1 000 1 500 2 000 2 500 3 000 20 12 20 13 20 14 20 15 20 16 20 17 E 20 18 F 20 19 F 20 20 F 20 21 F 20 22 F 20 23 F 20 24 F 20 25 F
ROYAL CARIBBEAN CRUISES LTD. COMPANY REPORT
88 Refer to Appendix 3: Royal Caribbean – Passengers source analysis 89 Source: Deloitte "2015 Latin America Outlook." (2015)
90 Source: Company Report
91 Refer to Appendix 4: On-board passenger spending revenues
Figure 32: Royal Caribbean - Passengers carried from Latin America
Source: Company Report; Analyst Estimates
Figure 33: Concession revenues and Passengers cruise days analysis
Source: Company Report; Analyst Estimates
Figure 34: Royal Caribbean - Effective tax rate
Source: Company Report; Analyst Estimates
2020 onward, the Asia-Pacific region will be the second region where more passengers from Royal Caribbean will be sourced88.
Other source of Passengers (5% of Royal Caribbean Passengers)
This group represents passengers from Latin America, embodying a small part of Royal Caribbean’s carried passengers. The recent decline in passengers originally from this area, in 2013 and 2014, was due to the economic turmoil in that region. In fact, after that, there was an average annual growth of 4.2% from 2004 to 2013 and the Latin America economy only expanded 2.8% and 1.3% in 2013 and 2014 respectively89. Due to the lack of
specific investment to attract passengers from the region and due to the small relevance for the company’s revenues90, it is forecasted, based on the
previous growth, that the growth in passengers for the future is 1%.
On-board Revenues
On-board Revenues depend on concessions revenues and on the spending of each passenger during the cruise. There are certain on-board services which cruise lines prefer to sell concessions, as the casino, spa, and gymnasium, and these services are available for guests at an additional cost. These concession revenues depend directly on the number of passenger cruise days, hence, it is forecasted that revenues from concessions will increase as the passenger cruise days increases. Based on the assumptions stated before referring to the average passenger number of overnights and the forecasted number of passengers, passengers’ cruise days was forecasted. On-board spending revenues depend directly on the spending of each passenger and on the number of passengers. As on-board spending per passenger as remained constant for the past years, it is estimated to remain constant for the years forecasted91.
Taxes
After analysing the taxation of Royal Caribbean, based on the source of its Revenues, a nominal tax rate of 12% was assumed. Its revenues from North America are taxed in the USA with a nominal tax rate of 6%, as followed by the law of Florida State, being assumed that the rest of the revenues were taxed at the UK and Australian tax rate, 19%. Chinese revenues are taxed at the UK tax rate due to U.K / China double Tax treaty. Moreover, cruise ships
0 50 100 150 200 250 300 350 20 12 20 13 20 14 20 15 20 16 20 17 E 20 18 F 20 19 F 20 20 F 20 21 F 20 22 F 20 23 F 20 24 F 20 25 F
Number of passengers (thousands)
0 20 40 60 80 0 100 200 300 400 500 600 20 12 20 13 20 14 20 15 20 16 20 17 E 20 18 F 20 19 F 20 20 F 20 21 F 20 22 F 20 23 F 20 24 F 20 25 F C ru ise d ays (mi lli on s) T h ou sa n d s ($ ) Concession revenues Passengers cruise days
0% 2% 4% 6% 8%
ROYAL CARIBBEAN CRUISES LTD. COMPANY REPORT
92 Source: Company Report
93 Refer to Appendix 5: Royal Caribbean berth capacity 94 Source: "Cruise Trends 2017." Cruise Critic, Dec. 2017 95 Source: Company Report
96 Refer to Appendix 6: Improvements per average berth
97 Source: Lee, Scott, and Sherie Brezina. "Cruise Line Efficiency." Tourism Economics 22.5 (2016)
Figure 35: Capex and berth capacity variation
Source: Company Report; Analyst Estimates
Figure 36: Capital expenditure ($) per berth
Source: Company Report
are registered in Liberia, providing numerous tax benefits to Royal Caribbean92. The effective tax rate used for the years forecasted was 4.1%.
Capital Expenditure
The capital expenditure (CAPEX) is composed by the investment in new ships, but also by the investment in equipment and software, in improvements on the current fleet and in others non-current assets. Since, on average, 93% of the investment is made on tangible assets, the investment is highly dependable on the total capacity of Royal Caribbean. The largest capital expenditure made so far was in 2016, when there was a 7.31% increase in capacity93. Moreover, the biggest capital expenditure is expected to be made
in 2019 and in 2021, as there is a 7.8% and 7% capacity increase, respectively, with the addition of two ships to the Royal’s fleet. It is also part of capital expenditures the amount invested every year in ships improvements. The current trend in the cruise industry is not only to build bigger ships, but also to invest more on improvements of the existing fleet94.
Since 2012, the amount invested in ship improvements per berth has increased95 and, as this growth trend is not sustainable, it is assumed a steady
state in 202096.
When analysing Royal Caribbean’s CAPEX per berth with its competitors for the past four years, it is possible to conclude that Royal Caribbean has a lower capital expenditure per berth than its competitors. This is explained due the fact that Royal Caribbean builds bigger ships than its competitors and consequently, despite the higher costs in building a bigger ship, it can take advantage of economies of scale and have a lower expenditure per berth built97.
Gross Margin
As explained before, the Double-Double program, which successfully ceased in 2017, generated short and long-term costs savings, transforming Royal Caribbean in a much more efficient company through the measures executed before. In fact, the company cost cutting program also benefited from the approximately 60% decrease in oil prices that occurred from 2014 to 2017. To fully understand the efficiency increase, the gross margin without fuel costs
0 1 2 3 4 5 6 7 8 9 0 500 1 000 1 500 2 000 20 13 20 14 20 15 20 16 20 17 E 20 18 F 20 19 F 20 20 F 20 21 F 20 22 F 20 23 F 20 24 F 20 25 F N u mb er of b ert h s (t h ou sa n d s) T h ou sa n d s ($ )
CAPEX Berth capacity
5 000 10 000 15 000 20 000 25 000 30 000 2013 2014 2015 2016 Royal Caribbean Carnival Norwegian Genting Hong Kong