Evaluation of low-cost MEMS accelerometers for SHM: frequency and
damping identification of civil structures
Renan Rocha Ribeiroa*
Rodrigo de Melo Lameirasa
a Departamento de Engenharia Civil e Ambiental, Universidade de Brasília (UnB), Campus Darcy Ribeiro. Brasília - DF, Brasil E-mail: renan.rocha.ribeiro@gmail.com, rmlameiras@gmail.com
* Corresponding author
http://dx.doi.org/10.1590/1679-78255308
Abstract
Sensing techniques based on accelerometers for modal parameters identification are among the most studied and applied in Structural Health Monitoring of civil structures. The advent of low-cost MEMS accelerometers and open-source electronic platforms, such as Arduino, have facilitated the design of low-cost systems suitable for modal identification, although there is still a lack of studies regarding practical application and comparison of commercially available low-cost accelerometers under SHM conditions. This work presents an experimental performance evaluation of six low-cost MEMS accelerometers for the identification of natural frequencies and damping ratios of a three-storey frame model and a reinforced concrete slab, as well as their noise characteristics. A low-cost Arduino-based data acquisition system was used. The results showed an overall good performance of the MEMS accelerometers, with identified natural frequencies errors within 1.02% and 7.76% of reference values, for the three-storey frame and concrete slab, respectively, and a noise density as low as 108 g/√Hz.
Keywords:
SHM; modal analysis; MEMS accelerometer; low-cost; Arduino. 1 INTRODUCTION
The number of aging and end-life civil structures is constantly raising, and proper monitoring must be performed to guarantee safety. Innovations in the Structural Health Monitoring (SHM) field are very welcomed as there are many problems yet to be solved, from theoretical analysis methods to real implementation issues. SHM is the process of implementing a damage identification strategy in any type of infrastructure, in a typically continuously, and preferably online and real time, system (Farrar and Worden, 2007). SHM relies heavily on electronic sensors usage, being the development of new sensors and applications one of its major research focus (Brownjohn, 2007a). Several works can be found regarding development and implementation of various sensing techniques (Xia and Hao, 2003; Moyo et al., 2005; Yan et al., 2007; Wevers and Lambrighs, 2009; Gulizzi et al., 2015; Fröjd and Ulriksen, 2018; Xi et al., 2018).
Sensing techniques based on vibration measurement for modal analysis in SHM are one of the most studied and applied. Vibration-based sensing usually involves the use of accelerometers and data acquisition systems to measure the response of the studied structure under a given excitation, aiming to determine its modal parameters (eigenfrequencies, damping ratios, mode shapes, and modal scaling factors) (Reynders, 2012). Since the accelerometer performance directly affects the quality of the data gathered, and the results they can yield, it is of paramount importance the adequate selection of accelerometers. Such decision must also consider the balance between cost and performance of the entire SHM system.
Accelerometers can be of various types regarding their internal functioning and working principles. Most common examples are piezo-electric crystals, which are materials capable of producing an electric charge when submitted to a force, or piezoresistive materials, which are based on a working principle analogous to strain gages.
From the 1990s, a new type of accelerometers based on Micro Electromechanical Systems (MEMS) technology has become increasingly mainstream, due mainly to their benefits of miniaturization, lower costs and broader applications (Chollet and Liu, 2016). MEMS refers to mechanical elements manufactured at a microelectronics scale in order to be used for various applications. Several types of transduction mechanisms can be used in MEMS sensors, such as piezoresistive, capacitive, piezoelectric or inductive mechanisms (Chollet and Liu, 2016). The capacitive type is the most common among commercial low-cost MEMS accelerometers. It consists in measuring the change in voltage caused by a change in the capacitance of a capacitor, whose plates are composed by a pair of fixed and movable micromechanical structures. The movable part is susceptible to external accelerations and can oscillate relatively to the fixed part, thus causing the changes in capacitance and, therefore, voltage in the sensing circuit. Further detailment about the transduction mechanism and electronic architecture can be found on Acar and Shkel (2003), Kavitha, Daniel and Sumangala (2016a, 2016b)and Shaeffer (2013).
With the widespread of open-source electronics platforms based on easy-to-use hardware and software, such as Arduino (Arduino, 2018a), the development of low-cost vibration-monitoring systems have been progressively explored. Several works have been conducted with the Arduino platform and commercial low-cost accelerometers, aiming the development of SHM and control systems with diverse capabilities and finalities (Andò, Baglio and Pistorio, 2014; Chacón, Oller, 2016; Peralta et al., 2014; Iacono et al., 2017; Sohn, Rim and Lee, 2015; D’Emilia et al., 2017; Duc, Anh and Dinh, 2017; Patel and Patel, 2017; Varanis, Silva and Mereles, 2018). The commercial MEMS accelerometers used in these researches are: the tri-axial accelerometer ADXL 335, 345 and 350, from Analog Devices; the MPU 6050, from InvenSense, which is an Inertial Measurement Unit (IMU) comprising a axial accelerometer and axial gyroscope; and the tri-axial accelerometer MMA 7455L and MMA 7361L, from NXP Semiconductors.
It can be found studies about the applicability of commercially available low-cost MEMS accelerometers for structural monitoring purposes involving real situations. It can be cited the works of Cigada et al (2010), Cigada et al. (2008), Lynch et al (2006) and Chung et al. (2004) as examples of the successful use of low-cost MEMS accelerometers for such purposes. Studies regarding the design of new MEMS accelerometers specifically for SHM applications are reported in literature, as in Kavitha, Daniel and Sumangala (2016a, 2016b), but, although they outline important characteristics and parameters that should be considered when analyzing accelerometers suitability, they focus in the design process rather than the evaluation of already built sensors.
Studies focusing on comprehensive comparison between commercially available MEMS sensor are still scarce. Acar and Shkel (2003) present an experimental evaluation of such sensors, but no mention is made regarding the specific SHM application. An experimental study could provide insights about the performance of various sensors in a real modal identification and discuss to which extent they can expected to provide good results in SHM applications, contributing to the widely adoption of such low-cost solutions. When considering the wide range of design options among commercially available MEMS, together with the fact that some sensor parameters are missing in specification documents, experimental studies rise in importance and utility (Acar and Shkel, 2003).
Furthermore, when analyzing practical implementations, the consideration of the effects of wiring, complementary electronic components of the system and environmental effects is of outmost importance to evaluate if the designed system (MEMS accelerometer and data-acquisition system) can provide adequate performance. The experimental evaluation becomes a good approach for performance assessments of low-cost sensors and data acquisition system, since the budget impact of comparing different sensors is reasonable and viable.
The present work evaluated experimentally the performance of six low-cost MEMS accelerometers, widely found in the market, for natural frequencies and damping ratios identification of civil structures, as well as the evaluation of their noise characteristics. The Arduino platform was used to build a low-cost data acquisition system, composed by a microcontroller sampling data from the sensors and storing in a microSD card, for later processing in MATLAB software. First, an analysis of the accelerometers documented specifications was performed, aiming initial insights about the sensor expectable performances. Then, a three-storey frame model and a concrete slab were used to assess the sensors capacity in correctly evaluating the natural frequency and damping ratio of the structural systems. Professional monitoring equipment (accelerometer and data-acquisition system), analytical and numerical results were used as benchmark. Lastly, the sensors intrinsic noise was experimentally evaluated and compared to manufacturers specifications.
2 MATERIALS AND METHODS
2.1 General outline
The work was divided in four main parts, which are briefly described:
• Part 1: comparison of the main MEMS specifications for SHM applications (range, bandwidth, sensitivity, cross-axis sensitivity, noise floor, and resolution) informed by manufacturers to the reference requirements for SHM given by Kavitha, Daniel and Sumangala (2016b);
• Part 2: identification of the natural frequencies and damping ratios of a three-storey frame using the low-cost MEMS accelerometers, with subsequent comparison to the results obtained with a professional equipment (piezo-electric accelerometer and data acquisition system), considered as the benchmark. The frame was excited by a fan, simulating an Operational Modal Analysis (OMA) condition, while the professional equipment results were obtained using an impact excitation. The experimental results were validated by comparison to analytical and numerical modal analysis results;
• Part 3: identification of the natural frequencies and damping of a concrete slab of an experimental dynamic tests, described in Carmona, Avila and Doz (2015) and Carmona, Avila and Doz (2017), with subsequent comparison to results obtained with professional equipment reported by Carmona, Avila and Doz (2017). The slab was excited by a 70 kg person single jump, of about 10 cm height, in the form of a heel impact at the centre of the slab;
• Part 4: assess the MEMS accelerometer noise level, in conjunction with the low-cost data-acquisition system, by analyzing the Power Spectral Density (PSD), to obtain the noise spectral density, and the time-domain plot, to obtain the root mean square (RMS) noise level, of a 10 minutes sampling at a state of absolute rest. The sampling was performed over a rigid concrete stand and inside a foam support to minimize external vibration effects on the results. The noise computing methods were based on Kwong (2017) and the external noise isolation scheme is guided by Brownjohn (2007b), Cigada et al. (2008), and Sekiya, Kimura and Miki (2016).
An Arduino-based low-cost data-acquisition system, further detailed, was developed to allow measurements with the MEMS accelerometers. The influence of the low-cost data acquisition system was taken in regard when analyzing the MEMS accelerometers performance, and small adaptions were performed over the data-acquisition system throughout the work, to adapt it to the various experimental situations encountered.
2.2 Low-cost sensors and data-acquisition system
The MEMS accelerometers chosen for this study are presented on the Table 1, which also contains the type (analog or digital), the manufacturer, the specification document reference (datasheet), and the breakout board used, when identifiable in the component. The references listed in Table 1 were used in Part 1 as the source for specifications.
Table 1: Summary of studied accelerometers.
Sensor Type Manufacturer Product specification doc Breakout board
MPU6050 Digital InvenSense (InvenSense, 2013) GY-521
BMI160 Digital Bosch Sensortec (Bosch Sensortec, 2015) GY-BMI160 MMA8452 Digital NXP Semiconductors (NXP Semiconductors, 2016) MMA845X module MMA7455 Digital NXP Semiconductors (NXP Semiconductors, 2009) Not identified
MMA7361 Analog NXP Semiconductors (NXP Semiconductors, 2008) MMA7361 Apex Electrix module
ADXL335 Analog Analog Devices (Analog Devices, 2010) GY-61
These accelerometers are mostly designed for consumer electronics, e.g. smartphones, quadcopters and self-balanced robots. Use in structural vibration monitoring is not informed by manufacturers. They were chosen based on commercial availability, price and amount of reported usage in the literature for SHM applications. Emphasis was given to the low-cost aspect, as these sensors can easily be bought for US$8.00 or less per unit. The Figure 1 presents the MEMS accelerometers evaluated, with a metric scale for comparison
Figure 1: MEMS accelerometers evaluated.
The low-cost data acquisition system was built upon the Arduino platform. The system was designed for two main tasks: interface with the sensors and data storage. The hardware used comprised: an Arduino UNO microcontroller board based on the ATmega328P (Arduino, 2018b); a SD card module (Wiltronics, 2018), in the experimental setup for the frame model and slab monitoring, and Wireless SD Shield (Arduino, 2018c), in the noise evaluation setup, for microSD interface; plug and play cables and breadboard for solderless connections. The system was originally powered by the USB port connect to a notebook, but, as further discussed, it was identified this could add external noise to data, which led to the use of a DC battery.
An external 16-bit analog-to-digital converter (ADC) ADS1115, from Texas Instruments (Texas Instruments, 2018), was used with the analog sensors. Even though the Arduino UNO microcontroller has its own internal ADC, its resolution is only 10-bit, which would drastically reduce the analog sensors performance when compared to the digital ones, which have dedicated internal ADC on its breakout boards. The main specifications of the ADS1115, extracted from its datasheet, are presented on Table 2.
Table 2: ADS1115 main specifications.
Specification Min Max
Power supply 2 V 5.5V
Analog inputs ±0.256 V ±6.144 V
Operating ambient temperature -40 oC +125 oC
Resolution 16 bits
Gain ± 6.144 V, ± 4.096 V, ± 2.058 V, ± 1.024 V, ± 0.512 V, ± 0.256 V Data rate (programmable) 8, 16, 32, 64, 128, 250, 475, 860 Hz
Data rate variation -10% +10%
Noise 125μV (RMS value)
Since the analog accelerometers used had output voltages at maximum of 3.3 V, the ADS1115 gain was set to 4.096 V. This configuration provides a sensitivity of 0.125 mV/LSB (4.096 V ÷ 215 logic levels, since one bit is used for positive/negative sign), where LSB refers to least significant bit and corresponds to a digital value unit.
The data acquisition system is illustrated in Figure 2, for digital and analog sensors, in its final version. A hardware filter, in the form of a capacitor connected to analog sensor data lines and ground, was also used, although not represented in Figure 2. Analog and digital sensors are represented connected to the data acquisition system at the same time, but during the experiments only one sensor is used per time, to avoid any possible interference or noise sources. As previously commented, Part 2 uses the SD card module for microSD interface, as presented in Figure 2, while Part 4 uses the Wireless SD Shield to reduce the usage of cables, aiming the reduction of external noise contributions, i.e. not from the sensor itself.
Figure 2: Data acquisition system with the digital and analog accelerometers.
The professional equipment used in Part 2 comprises: an accelerometer model 752A13 from Endevco, with sensitivity of 964.6 mV/g; a Lynx acquisition system, comprised of four board of type AI 2164 with eight acquisition channels each; and a notebook with the software AqDados 7, by which the system can be configured, and the data can be visualized, processed and stored.
2.3 Signal processing and modal identification algorithm
The experimental data is processed using an algorithm developed in the MATLAB 2017a software, which is divided in three main parts:
• Pre-processing: conversion of raw accelerometer data to equivalent gravity acceleration values, i.e. g-force (g); removal of data mean value to account for eventual calibration errors; filtering with an 8-th order lowpass Butterworth, with a cut-off frequency of 50 Hz; plotting of raw and processed signal in time-domain for visual inspection;
• Computation of frequency domain representation: computation of the data PSD using the Welch procedure with a Hamming window with 50% overlapping (Welch, 1967);
• Frequency and damping identification in the frequency domain: use of Basic Frequency Domain (BFD) methods, i.e. Peak Picking for natural frequencies and half-power bandwidth for damping ratios (Clough and Penzien, 2003; Olmos and Roesset, 2010; Reynders, 2012), and curve-fitting of an analytical single degree (SDOF) frequency response spectrum, as described in Brownjohn et al. (1989), Littler (1995) and Rodrigues (2004). The fitting is performed with a Levenberg-Marquardt method, a least-square based technique, as described in Rodrigues (2004). Lastly, the peaks and fitted curve are presented in plots.
2.4 Three-storey frame experiment
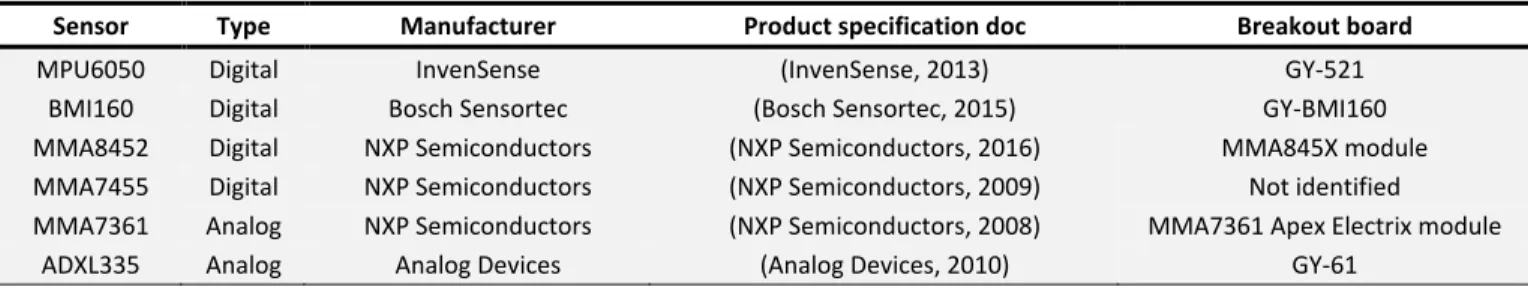
The frame construction and properties are described in Silva (2005). It consists in four aluminum horizontal bars connected to two vertical steel rulers by screws. The structure is fixed in a concrete block of 50 kg positioned over a rubber sheet to isolate external vibrations. Table 3 presents the physical properties of each element and Figure 3 illustrates the frame.
Table 3: Physical properties of frame elements (Silva, 2005).
Element Mass (kg) Elastic modulus (N/m2) Inertia (m4)
Aluminum bar #1 0.15941 70 × 109 4.336 × 10⁻⁹
Aluminum bar #2 0.15938 Aluminum bar #3 0.15903 Aluminum bar #4 0.15892
Element Mass (kg) Elastic modulus (N/m2) Inertia (m4)
Steel ruler #1 0.10503 2.06 × 10¹¹ 3.219 × 10⁻¹²
Steel uler #2 0.10469
Accelerometer support 0.11880 Not required in the shear building analysis Bar fixation screws 0.00242
Figure 3: Three-storey frame used for OMA.
The frame model experimental setup, which intended to simulate an Operational Modal Analysis condition, is illustrated in Figure 4.
Figure 4: OMA experimental setup.
The OMA ambient vibration condition was materialized with the use of a fan positioned 70 cm from the centre of the frame. Since no standard experimental setup is available on the literature regarding this methodology, the setup is based on Azenha et al. (2012) and relies on the assumption that the air flow produced by the fan on the vicinity of the frame is turbulent. This allows to consider the air excitation as a white noise with a zero-mean value, which is the essential assumption in OMA (Reynders, 2012).
The fan was used in its lowest velocity mode, which presents an average air flow of 0.790 m3/s and a power of 76.50 W (Eletrobras, 2017). The air flow was directed towards the lateral of the frame, so it could approximately excite equally the entire height of the structure, accentuating all vibration modes in the sampled data.
The sensors were positioned in the top of the frame, as indicated in Fig. 4, and fixed with adhesive tape. Cables with length of approximately 1.20 m were used to connect the sensors to the data-acquisition system. To avoid interference in the damping ratio estimative, the cables were taped along the frame vertical bar. The whole system was originally powered using a notebook USB port.
The sampling duration was 60 seconds, for all sensors. The sampling frequency was approximately 200 Hz for the digital sensors and 250 Hz for analog sensors. The sampling data was stored in a SD card and later transferred to a notebook for processing using the described algorithms. Only the first three vibrational modes, due to flexion, were studied, as they are, theoretically, the only natural frequencies of the frame, since its geometry approximates a three-storey shear building, due its horizontal bars being much stiffer than the vertical rulers.
For the digital accelerometers (MPU 6050, BMI 160, MMA 8452, MMA 7455), the experimental setup is the one presented in Figure 2. The power source and grounding from the MEMS and SD Card module are isolated, and the whole system is powered from an USB cable connected to notebook. For the analog accelerometers, this experimental setup was modified to accommodate the need for the ADC module. At first, the power and grounding of the ADC, MEMS and SD Card module were shared. This incurred in unsatisfactory performance, as further discussed. The setup was then modified, adding a hardware filter on the MEMS data line, isolating the power source and grounding of the MEMS and ADC from the SD Card module, and powering the whole system from a DC battery. The final solution is that presented in Figure 2. During the monitoring, the x-axis was used in the accelerometers MPU 6050, BMI 160, MMA 8452, and MMA 7455. The y-axis was used in MMA 7361 and ADXL 335.
To provide benchmark values for comparison, the frame was monitored with the professional equipment described previously. The frame was excited with an impact in the node between the aluminum bar #3 and the vertical ruler, in the direction of the aluminum bar. The application was fast to avoid any attenuation of the impact tool. The data-acquisition system was configured to sample data at 100 Hz during a sample time of 15 seconds. The data was stored in a text file format and posteriorly treated with the same signal processing algorithms used on the MEMS accelerometers data analysis.
An analytical and numerical modal analysis of the frame were performed to provide validation for the experimental results. The frame was analyzed analytically using the shear building hypothesis. Since the MEMs accelerometers masses are very low, their masses were disregarded in this analysis.
The numerical modal analysis was performed in the Finite Element Analysis (FEA) software SAP2000 v16. The structure was modelled with frame elements, with each span divided in 50 elements. Since the analysis is computationally costless due to the simplicity of the structure, a high number of elements was used, and the mesh convergence analysis was relinquished. To model the frame as realistic as possible, the frame supports were modelled in intermediate nodes at the bottom horizontal bar, to simulate the screws connected to the concrete block. Since only one screw is used to fix each point, it was applied only translational restraint in such nodes. Joint masses were added at joints to consider the screws masses, considering two screws per joint. An intermediate node was modelled in the top horizontal bar to allow consideration of the accelerometer support mass, which is displaced 30 cm from the centre of the bar.
2.5 Concrete slab experiment
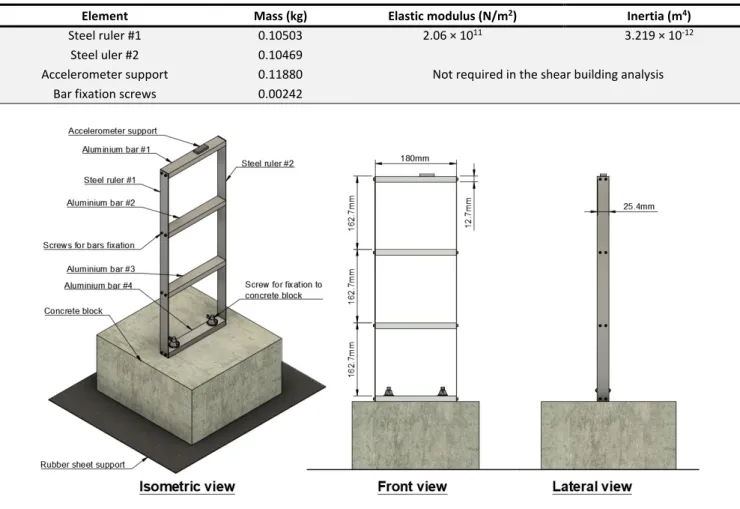
The concrete slab monitored is presented in the Figure 5. It is supported in two opposite semi-rigid edges of 6.1 m span, with two opposite free edges of 4.9 m span. The slab thickness is 0.1 m and the concrete elastic modulus is of 29 GPa. The full description is presented in the work of Carmona, Avila and Doz (2017), which also contains the natural frequencies and damping ratios experimentally determined in a free vibration test, as presented in Table 4.
Figure 5: Concrete slab monitored.
Table 4: Experimental natural frequencies and damping ratios (Carmona, Avila and Doz, 2017).
Vibration mode 1 2 3
Natural frequency (Hz) 3.320 15.332 23.047
Damping ratio (%) 2.45 0.86 0.75
A free vibration test with the MEMS accelerometers and the low-cost data acquisition system was performed, in order to perform a modal identification of natural frequencies and damping ratio using the previously described algorithms.
The sampling duration in the concrete slab monitoring was 60 seconds, for all sensors. The sampling frequency was 200 Hz for digital sensors and 250 Hz for analog sensors. A hardware low-pass filter of 100 Hz was used with the analog sensors. The data-acquisition system and was powered using a battery pack, to reduce external noise sources. During the monitoring, the x-axis was used in the accelerometers MPU 6050, BMI 160, MMA 8452, and MMA 7455, and y-axis in MMA 7361 and ADXL 335. The frequency and damping reference values are those presented in Table 4.
The concrete slab monitoring was repeated three times with each MEMS accelerometer. The slab was excited by a 70 kg person single jump, of about 10 cm height, in the form of a heel impact at the centre of the slab. In the first repetition, four heel impacts, spaced by approximately 15 seconds, were applied, to guarantee a higher excitation level and better signal-to-ratio conditions. The second and third repetitions comprised a single heel impact, in the beginning of the monitoring. The exceptions are the MMA 7361 first repetition, in which were made two impacts during sampling, and ADXL 335 first repetitions, in which only two impacts were made.
2.6 Noise performance experiment
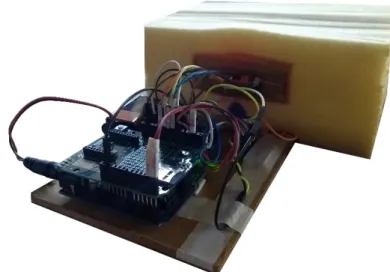
The experimental setup of the MEMS accelerometer noise performance analysis is presented in Fig. 4. In this setup, great care was given to the mitigation of external noise sources. The length of cables was reduced to the best extent, and the SD card module, presented in Fig. 2, was replaced for the Wireless SD Shield, which has soldered pins for directly connections to the Arduino microcontroller board. Cables of 12 cm length are used to connect the MEMS to the data acquisition system.
Following recommendations at the work of Cigada et al (2008), battery packs were used for power supply instead of other external sources, such as USB ports or wall plugs. The sensors were positioned inside a foam block to guarantee stillness during the test, and the whole system was mounted upon a rigid concrete stand to mitigate external noise sources influence. Figure 6 presents the experimental setup used.
Figure 6: Experimental noise setup.
The noise analysis method was based on the work of Kwong (2017), which consists in taking samples during 10 minutes with the sensors in a state of complete rest. The noise density (ND) was assessed in the frequency domain, together with the signal root mean square (RMS) in the time domain. Accordingly to Kwong (2017), the ND in the frequency band of interest between 𝑓𝑓1 and 𝑓𝑓2, is:
( )
2 1 2 11
f|
f fND
P f
f
f
==
⋅
−
∑
(1)In which: 𝑓𝑓2 is the largest frequency of interest to be detected by the accelerometer; 𝑓𝑓1is the lowest frequency of interest,
taken as 1/100 of 𝑓𝑓2, according to Kwong (2017); and 𝑃𝑃(𝑓𝑓) is the power spectral density of the signal. In the present
work, a frequency band of 100 Hz (f2 = 100) was assumed, as it covers the practical situations in civil structures monitoring.
The noise RMS value in calculated by the following equation:
( )
2 11
N rms iN
V i
N
==
⋅
∑
(2)In which: N is the total number of samples taken; 𝑉𝑉(𝑖𝑖) refers to the sampled values in the time domain.
The noise computed in these analysis accounts also for the low-cost data-acquisition noise, which, however, is expected to be low. Further studies with a professional low-noise data-acquisition system should be made to allow better insights regarding the sensor intrinsic noise contribution. Nevertheless, since the low-cost MEMS accelerometers are commonly used as part of a complete low-cost system, it is considered that the present evaluation remains valid. 3 RESULTS AND DISCUSSION
3.1 Part 1: MEMS accelerometers specifications
The Table 5 presents the accelerometers specifications (range, bandwidth, sensitivity, cross-axis sensitivity, noise floor, and resolution) informed by manufacturers on the official product specification documents presented in Table 1. Reference values used by Kavitha, Daniel and Sumangala (2016b)for the design of accelerometers for SHM-specific applications are also presented for comparison.
Table 5: Document analysis results and reference values.
Sensor Range Bandwidth Sensitivity sensitivity Cross-axis Noise density (RMS noise)1 Resolution MPU6050 ±2g 2 500 Hz 3 16384 LSB/g 4 ±2% 400μg/√Hz 5 16-bit BMI160 ±2g 2 5.06-684 Hz 16384 LSB/g 4 ±1% 180 μg/√Hz 6 (1.5 mg)7 16-bit MMA8452 ±2g 2 0.78-400 Hz 1024 LSB/g 4 - 126 μg/√Hz 8 12-bit MMA7455 ±2g 2 62.5/125 Hz 54 LSB/g 4 ±5% - 8-bit MMA7361 ±1.5g 2 400 Hz 9 800 mV/g or 6400 LSB/g 13 ±5% 300μg/√Hz ADC 10 ADXL335 ±3g 1600 Hz 11 300 mV/g or 2400 LSB/g 13 ±1% 150 μg/√Hz 9 (1.897 mg) 9 ADC 10 Reference values 12 ±2g 100 Hz 40 mV/g <1% <1 μg/√Hz - Notes:
1. RMS noise, when informed by manufacturer, is indicated in parenthesis. 2. Smallest programmable range.
3. Bandwidth limited by the Nyquist rule and the maximum output data rate (ODR). Value on table based on an ODR=1000 kHz, which is the maximum for the sensor.
4. Sensitivity for digital accelerometers is given in digital units (LSB) per g-force (g). 5. Datasheet value referenced for a 10 Hz bandwidth.
6. Datasheet value referenced for ±8g scale and power mode set to normal (full chip operation). 7. Datasheet value referenced for 200 Hz output data rate (ODR).
8. Datasheet value reference for 400 Hz output data rate (ODR). 9. Value for X and Y axis.
10. Resolution value of analog accelerometers depends on ADC characteristics of the data acquisition system. In this work, the ADC ADS1115 resolution is 16-bit.
11. Value for X and Y axis. Actual bandwidth is controlled by applying proper capacitors in data line. 12. Reference values of accelerometers for SHM applications from Kavitha, Daniel and Sumangala (2016b).
13. Datasheet informs only analog sensitivity, since digital sensitivity depends on the ADC characteristics of the data acquisition system. In this work, the ADC ADS1115 resolution is 16-bit and its highest gain possible, for both analog accelerometers used, is 4.096 V. This implies a sensitivity of 0.125 mV/LSB for both accelerometers. The division of the analog sensitivity by 0.125 mV/LSB gives the digital sensitivity of the system.
As can be observed in Table 5, characteristics such as bandwidth, sensitivity and noise PSD extracted from the datasheet are always referenced to a given configuration and environmental working conditions (Endevco, 2011). Since MEMS accelerometers can be configured in a variety of forms, the prediction of MEMS suitability, for a given purpose, based only in documentation becomes a difficult task. For analog sensors this is even more evident, since the sensor performance is dependent on the external ADC characteristics. Furthermore, the chosen reference conditions often vary among manufacturers, which not always clearly state the reference used or the methods employed to obtain a given property (Kwong, 2017). Nevertheless, a preliminary documentation analysis stands important, since it can spare work-man hours of implementation effort, avoiding testing evidently not suitable sensors.
For SHM applications, all sensors present range and bandwidth within reference values, considering the latter is adjustable for most of the sensors. ADXL 335 is the exception with a range of ±3g, which compromises its final digital resolution. The best values for these properties depend on the structure to be monitored: range will be defined based on the maximum acceleration expected, and bandwidth based on the maximum frequency of interest. If allowed by the application, e.g. if not an online real time application, bandwidth can also be treated with post-process digital filtering.
Sensitivity should be, generally, the highest possible, since the typical level of vibration in SHM is small and a high sensitivity will likely produce a higher signal to noise ratio (SNR). It is difficult to compare digital and analog sensors sensitivity in absolute terms, since the analog sensor digital sensitivity can be improved with better ADC characteristics. Although, for the low-cost data acquisition system used in this work, Table 5 indicates MPU6050 and BMI160 as the most sensitive accelerometers.
High values for cross-axis sensitivity are undesirable since it implies a given axis suffers contamination of accelerations occurring in orthogonal directions (e.g. x-axis can sense y- and z- axis accelerations). In modal analysis this may create spurious modes in a given direction, which are in fact vibration modes of another direction and nature. Among the MEMS evaluated, BMI160 and ADXL335 present the best performance regarding this characteristic.
Finally, the noise PSD is an important factor for SHM, as vibration levels are small and tend to produce small signal levels. From Table 5, it can be observed that all sensors have a noise PSD many times larger than the reference value. Thus, one should not expect good performance in low excitation conditions, since the sensor intrinsic noise may entirely overwhelm the acceleration signal. Moreover, other noise sources, such as wiring and electronic components, should also be considered, resulting in even noisier measurement systems. Still, for SHM applications in structures where a high enough excitation energy can be constantly guaranteed, such as busy bridges, footbridges or civil structures exposed to high velocity winds, these sensors may provide satisfactory performance. Also, for experimental modal analysis, commonly performed in laboratory conditions, a high enough excitation can be tuned, and these sensors can provide a reasonable cost-effective tool.
Among the evaluated sensors, MMA 8452 highlights as the lowest noise PSD sensor. However, its low resolution, inducing a relative low sensitivity, may induce poorer behaviour when compared to BMI 160, which has the second lowest noise PSD but has the highest resolution and, therefore, sensitivity. These rather ambiguous observations demonstrate, again, the difficulty of evaluating low-cost sensor performance without experimental results.
3.2 Part 2: Three-storey frame experiment
The three-storey frame experiment was divided in three main parts, which are following discussed: numerical and analytical analysis of the frame; frame monitoring with professional equipment; frame monitoring with the low-cost accelerometers and data-acquisition system.
3.2.1 Numerical and analytical analysis of the frame
Table 6 presents the mode shapes, which are normalized to the largest displacement DOF in each mode. The numerical and analytical undamped natural frequencies and mode shapes of the first three modes are presented in Table 7, which also presents the relative error taking the numerical result as reference.
Table 6: Numerical and analytical mode shape results.
Mode 1 Mode 2 Mode 3
Numerical Analytical Numerical Analytical Numerical Analytical
Table 7: Numerical and analytical natural frequencies results.
Vibration mode Numerical Analytical Relative error (%)
1st mode 8.1203 8.1820 0.76
2nd mode 24.9028 24.3677 -2.15
3rd mode 38.2049 36.0687 -5.59
It can be observed a good consistency between the analytical, which used the shear building hypothesis, and the numerical analysis, with low relative error obtained. The consistency between the mode shapes endorses such observation. The error increases in higher modes, which is expected since the analytical model diverges from the real structural behaviour, better represented in the numerical model by the consideration of the bar’s full flexibility, rotational DOFs and more realistic boundary conditions. Thus, the numerical model is considered validated and its results are taken as reference in the further analysis.
3.2.2 Frame monitoring with professional SHM equipment
The results of the impact test, performed with the professional equipment, are presented in the Figures 7 and 8. For the sake of brevity, only the damping ratio estimates plots with Peak-Picking and half-power methods for the first mode are presented.
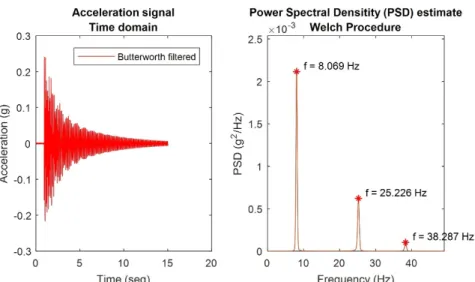
Figure 7: Time domain and PSD with Peak-Picking results plot (SHM equipment test).
Figure 8: Half-power method for the first mode (standard SHM equipment test).
The analysis of PSD peaks distribution in Figure 7 shows that the frame has very well separated vibration modes, suggesting low damping ratios. This favors the methods employed for modal identification, since they rely on the consideration that, around each natural frequency, only one vibration mode dominates the structure’s response. Figure 8 and Figure 9 show the part of the SPD used in the identification method of the first mode, indicating that other vibration modes indeed contribute very little to the response structure. The natural frequencies and damping ratios for the first three vibration modes, for each identification method, are summarized in the Table 8, together with the numerical analysis results, which are taken as reference for frequency relative error calculation. The damping ratio relative error considers the half-power method as reference.
Table 8: Results for impact with free vibration test using standard SHM equipment. Mode Numerical Peak-picking Half-power Curve-fitting SDOF response
Relative errors (%) ƒ ξ ƒ (Hz) ƒ (Hz) ξ (%) ƒ (Hz) ξ (%) PP CF CF/HP 1 8.1203 8.069 2.6485 8.048 3.2131 -0.632 -0.879 21.318 2 24.9028 25.226 1.0650 25.225 1.0686 1.298 1.297 0.338 3 38.2049 38.287 0.7494 38.287 0.7386 0.215 0.216 -1.444
It is observed very small errors in the natural frequency estimation in both identification methods, which, due to its magnitude, might be due to inaccuracy of the numerical model in representing the actual condition of the frame, in terms of material properties or joint stiffness. Nevertheless, since the differences remained around 1% or lower, the numerical model and experimental methodology are considered to reflect well the structure response, and the experimental results are considered validated. Also, either identification methods apparently lead to same results, being interchangeable.
The first mode damping ratios from different identification methods presented high discrepancy, which may be explained by the high sensitivity of the curve-fitting method to its start fitting point. In the implemented algorithm, this point is automatically calculated to standardize the process, although its manual adjustment allows to take the result closer to power’s results. Since both modal identification methods tend to overestimate the damping ratio, the half-power method results are taken as reference in the error calculation, since they produce the lowest damping values.
Based on these observations, for better conciseness, only the Peak-Picking and Half-power methods are used in the following analysis.
3.2.2 Frame monitoring with low-cost equipment
For the sake of brevity, only the time domain and PSD plots are presented for each MEMS accelerometer. All the other results are summarized in a table in the end of this section.
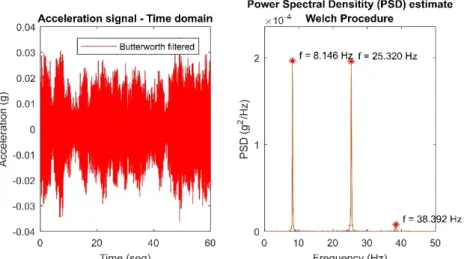
The time domain and PSD plots for MPU 6050 are presented in Figure 9. The time-domain plot shows that the frame was subjected to accelerations of the order of 0.05 g. The first and second vibration modes appear in the PSD with reasonable energy, while the third appears with considerably lower energy, which is expected as higher modes are more difficult to excite. A low noise level is observed on the PSD, and a high SNR is observed around the peaks, indicating the sensor presents good performance for the dynamic identification of structures.
Figure 9: Time domain and PSD plot for frame´s OMA with MPU 6050.
The time domain and PSD plots for BMI 160 are presented in Figure 10. The observation of the time domain plot shows that during the test the structure was under lower excitation levels when compared to the MPU 6050 test. Nevertheless, the BMI 160 presented excellent performance, since its PSD plot shows clearly the first and second vibration modes, with high energy, and the third mode, again with considerably lower energy. The PSD energy magnitude is lower than that of MPU 6050, as expected since a lower acceleration order was imposed to the structure. Still, the BMI 160 noise is not high enough to contaminate considerably its PSD data, which favoured the modal identification methods employed.
Figure 10: Time domain and PSD plot for frame´s OMA with BMI 160.
The time domain and PSD plots for MMA 8452 are presented in Figure 11. This sensor also presented good results, even having lower resolution when compared to MPU 6050 and BMI 160. Although, the time domain plot presents higher acceleration levels when comparing to the previous sensors, which might either be due to randomly higher external excitations during the sampling, which favoured the sensor response and were translated in higher PSD energy levels, or due to some external noise source. Joint analysis of the noise performance experiment is required for further insights.
Figure 11: Time domain and PSD plot for frame´s OMA with MMA 8452.
The time domain and PSD plots for the MMA 7455 are presented in Figure 12. From the time domain plot, it can be seen high values of accelerations, with an incompatible magnitude in relation to the previous tests. This suggested that a high-level noise source was acting upon the system. Again, joint analysis of the noise performance experiment is required for further insights, as no information regarding noise properties was found in the sensor’s datasheet. Due to such phenomenon, no structural vibration modes could be identified in the PSD.
Figure 12: Time domain and PSD plot for frame´s OMA with 7455.
Since the results in OMA conditions were not satisfactory, an impact test was performed to attest if the deficient results were due to experimental setup errors. The results are presented in Figure 13. The time domain plot illustrates the two impacts applied to the structure. The acceleration magnitude is many times higher than those observed in previous tests, allowing the identification of the natural frequencies. This may indicate that MMA 7455 noise and low sensitivity might jeopardize its performance, although further conclusions require analysis from the noise performance experiment. In the PSD, a spurious frequency peak appears in 15.620 Hz with a PSD higher than the third mode PSD at 38.297 Hz. Since this frequency also appeared in the previous results it might reflect the frequency of the unknow noise source. These results suggest that MMA 7455 is not suitable for SHM applications, mainly due to low sensitivity and a presumable high-level noise.
Figure 13: Time domain and PSD plot for impact with free vibration test with MMA 7455.
The time domain and PSD plots for the MMA 7361 are presented in Figure 14, for the first experimental setup used. As previously commented, some issues were found regarding the experimental setup used in digital accelerometers, and the design of a second setup was needed. To better analyse the issues with the first experimental setup, the PSD plot is extended to a 100 Hz bandwidth, with the digital Butterworth filtered adjusted to a 100 Hz cut-off frequency.
Figure 14: Time domain and PSD plot for OMA with MMA 7361, with first setup.
As can be observed, the time domain signal is dominated by noise and the PSD plot presents peaks that suggests strong noise sources in the setup. Only a peak related to the first vibration mode is identified within the three largest peaks. A zoomed inspection on the PSD, presented in Fig. 15, suggests the PSD contains at least two strong noise sources, with aliased frequencies shown by blue and red double-headed arrows. The presumably structural natural frequencies are indicated by purple squares.
Figure 15: Zoomed inspection on the frequency peaks.
This phenomenon was not present in the digital MEMS accelerometers since their breakout boards already contain dedicated signal conditioning systems, with dedicated lines of power source and grounding. Therefore, the system wiring was modified, tackling three possible noise sources, which led to the following modifications: use of a battery power source instead of the USB port; use of dedicated lines for MEMS and ADC power source and grounding apart from SD Card Module, which is a potential noise source; inclusion of a 0.1μF capacitor in the signal line to act as a hardware filter, as indicated by the manufacturer. This capacitor implied a cut-off frequency of 50 Hz, which still allows the identification of the frame’s first three vibration modes. The experimental evaluation of the impact of these modifications on the PSD peaks is presented in Table 9, which uses Figure 15 as reference for observations.
Table 9: Evaluation of the setup modifications.
Modified setup Highest frequency peaks (Hz) Observations
1st 2nd 3rd
Added filter 59.929 8.113 25.209 The 60 Hz noise peak dominated PSD. Blue arrows aliased peaks were suppressed. Read arrows aliased peaks were suppressed above 60 Hz. Filter + battery 8.162 25.299 38.316 The 60 Hz peak was suppressed. Read arrows aliased peaks below 60 Hz
persisted, with lower frequencies increasing in power. Filter + dedicated
supply 59.908 8.120 25.232 The 60 Hz peak returned. Aliased peaks suppressed. Filter + battery +
dedicated supply 8.127 25.237 38.340 Noise peaks suppressed. A 0.015 Hz peak, with PSD = 2.26E-5 g
2/Hz, appeared, probably due to DC power from the battery.
The observations presented in Table 9 suggest that the USB powering was the main noise source, responsible for the high power 60 Hz peak. The filter suppressed high aliased frequency peaks but could not eliminate the 60 Hz peak, probably due to the leakage effect of the peak’s high power. The use of a distinct supply line from the SD Card module power and ground was able to suppress aliased peaks, implying the SD module’s noise contribution is of high frequency and shows only as aliasing in a 250 Hz sampled data. Lastly, the DC battery apparently introduced a low-frequency of 0.015 Hz peak which may be eliminated with better wiring design or a high-pass analog or digital filter.
The Figure 16 presents the time domain and PSD plot for the modified setup, with added filter, battery and isolation. Comparing to Figure 14, the time domain signal is visibly less noisy, and the frame’s natural frequencies peaks are visibly clear in the PSD
Figure 16: Time domain and PSD plot for OMA with MMA 7361, with modified setup.
The ADXL 335 also presented similar noise issues as discussed in the previous section. The setup modifications previously discussed were implemented and the results are shown in Figure 17. A good performance could be achieved even with ambient excitations of the order of 0.02g, as seen in the time domain plot, which is considerably lower than in the previous tests with other MEMS.
Figure 17: Time domain and PSD plot for OMA with ADXL 335, with modified setup.
The Table 10 presents a summary of the three-storey frame OMA results, as well as the impact test performed with MMA 7455 and professional equipment.
Table 10: Summary of three-storey frame OMA results. Identification method and modal
properties Professional equip. MPU 6050 BMI 160 MMA 8452 MMA 7455 MMA 7361 ADXL 335
Impact Impact Peak-picking ƒ (Hz) 1st 8.069 8.151 8.146 8.107 8.077 8.127 8.136 2nd 25.226 25.374 25.320 25.265 25.301 25.237 25.355 3rd 38.287 38.352 38.392 38.229 38.297 38.336 38.394 Half-power ξ (%) 1st 2.6485 0.9384 0.7739 0.9672 2.1208 0.8800 0.8258 2nd 1.065 0.2490 0.3633 0.2630 0.6915 0.5977 0.4148 3rd 0.7386 0.2870 0.3846 0.3641 0.5667 0.4705 0.2973 Observation of the damping ratios results suggests that the identification methods employed produce different results for different excitation natures. The MMA 7455 results were the closest to the SHM equipment, while all the others presented much lower damping ratios. One possible explanation might be that impact tests, due to the higher displacement values induced, tend to increase the effect of damping mechanisms, e.g. friction in joints and material microfractures. In fact, this behaviour is discussed by Reynders (2012). Further assessments regarding specifically this phenomenon are necessary to provide a comprehensive answer.
Overall, the damping ratios present a high variability, among all sensors. This may indicate that the modal identification methods are highly sensitive to signal noise and the employed sensors might be too noisy and/or not sensitive enough to provide the required data quality. Since no other damping results of the frame are available for reference, further assessments regarding this matter are necessary and the damping ratios were not used to assess MEMS performance.
Table 11 presents the relative error of natural frequencies estimation considering the professional equipment results as reference.
Table 11: Relative error to professional equipment results.
Identification method MPU 6050 BMI 160 MMA 8452 MMA 7455 MMA 7361 ADXL 335
Impact
Peak-picking 1st 1.016% 0.954% 0.471% 0.099% 0.719% 0.830%
2nd 0.587% 0.373% 0.155% 0.297% 0.044% 0.511%
It can be observed consistent results for all modes, with the evaluated MEMS and low-cost data-acquisition system presenting a performance comparable to the professional equipment, with deviation lower than 1.02%. Overall, the higher the modes, the better the results are: the highest third mode frequency error was only 0.279%. This is an outstanding performance given the low-cost relation between these two systems.
It is interesting to comment on the differences between digital and analog MEMS accelerometers performances. Digital MEMS are evidently easier to use, as they do not require any type of signal conditioning hardware and are less prone to noise contamination. On the other hand, their specification in terms of resolution, noise PSD and bandwidth are rather fixed, i.e., cannot be easily controlled/modified by the user.
Analog MEMS require precautions with the ADC system employed and to noise contamination. The whole design of the data-acquisition system must consider such aspects, as secondary electronic components, e.g. the SD Card module and USB powering, may negatively affect the accelerometer performance. However, such sensors tend to offer more flexibility, as resolution, noise and bandwidth can be adjusted with external signal conditioning hardware. In this way, they can be finely tuned to different applications, obtaining optimized performance.
Lastly, usage of these results in a comparative analysis must consider that, even though all sensors were under the same experimental conditions (i.e. the fan and sensors were always on the same position), the results may have suffered influence of particularities during sampling. For example, MMA 8452 presented better performance than ADXL 335 but during its sampling it experienced higher excitation levels. Nevertheless, they show that, overall, all sensors (except MMA 7455) showed reasonable suitability for the identification of structural natural frequencies and damping ratios.
3.4 Part 3: Concrete slab experiment
The Table 12 presents the excitation levels, in equivalent gravity acceleration (g), in the form of peak values and RMS values, in parenthesis, for all tests performed. It can be observed the excitation level remained consistent during all repetitions.
Table 12: Concrete slab excitation levels during monitoring.
Sensor 1st rep. 2nd rep. 3rd rep.
MPU 6050 0.1204 g (0.0119 grms) 0.0532 g (0.0051 grms) 0.0553 g (0.0060 grms) BMI 160 0.1069 g (0.0127 grms) 0.0925 g (0.0076 grms) 0.1187 g (0.0076 grms) MMA 8452 0.1372 g (0.0134 grms) 0.1139 g (0.0067 grms) 0.1343 g (0.0083 grms) MMA 7455 0.1313 g (0.0181 grms) 0.1370 g (0.0133 grms) 0.1076 g (0.0142 grms) MMA 7361 0.0668 g (0.0089 grms) 0.0243 g (0.0043 grms) 0.0551 g (0.0057 grms) ADXL 335 0.0923 g (0.0091 grms) 0.0713 g (0.0058 grms) 0.0868 g (0.0069 grms) The signal processing of 1st and 3rd MMA 7361 repetition results required the use of a high-pass filter of 1 Hz to eliminate the influence of the aforementioned 0.015 Hz frequency peak, which caused errors in the automatic identification algorithm. Table 13 presents the average values and the standard deviations, in parenthesis, of the natural frequencies and damping ratios identified using the signals of each sensor, and the average and standard deviations considering results from all sensors.
Table 13: Average and standard deviation, in parenthesis, of frequencies and damping ratios.
Property Mode MPU 6050 BMI 160 MMA 8452 MMA 7455 MMA 7361 ADXL 335 All sensors
Frequency (Hz) 1 3.546 (0.0067) (0.0031) 3.545 (0.0078) 3.541 (0.0120) 3.553 (0.0273) 3.578 (0.0062) 3.551 (0.0166) 3.552 2 15.454 (-) 15.473 (0.0534) (0.0035) 15.4565 (0.0622) 15.453 (0.0267) 15.523 (0.0064) 15.485 (0.0393) 15.474 3 23.538 (-) 23.554 (0.0198) (0.0486) 23.581 (0.0348) 23.506 (0.2269) 23.706 (0.0397) 23.568 (0.1103) 23.576 Damping ratio (%) 1 1.591 (0.2926) (0.1920) 1.694 (0.2297) 1.835 (0.2964) 2.347 (0.1914) 1.788 (0.1705) 1.876 (0.3097) 1.855 2 1.1088 (-) 0.5430 (0.1704) (0.6829) 0.958 1.110205 (0.3021) (0.1498) 1.204 (0.1828) 0.889 (0.3401) 0.969 3 1.2206 (-) 0.6831 (0.2520) (0.1988) 0.775 (0.2084) 0.997 (0.0901) 0.953 (0.0346) 0.797 (0.2084) 0.904
The MPU 6050 did not allow the identification of the second and third mode properties in the 2nd and 3rd repetitions, and, therefore, their standard deviation could not be calculated. Overall, a low variability between repetitions is observed in the frequency estimation, both for each sensor individually and together, due to low standard deviation magnitude when compared to the average values. The damping ratios presented high variability, as observed in the three-storey frame experiment, which, as previously commented, can be due either to inaccuracy of the identification method used or to high noise/low sensitive sensors.
The Table 14 presents the relative error considering Table 4 values as reference. Small errors were observed in the frequency estimation, with a consistent deviation from the reference values. The first mode frequency presented the highest deviation, but, considering the small deviation of the other modes, this could be due to differences in the experimental methods, e.g. excitation load, in relation to the reference work. Other explanation may be the continuous gain in mechanical properties suffered by the slab concrete along the time, since the reference results were obtained more than one year before the present work. However, these results support that these sensors and data-acquisition system remain feasible on applications were high precision in frequency identification is not a requirement. The damping ratio estimation, similarly to the three-storey frame results, presented a high deviation from the reference values, evidencing that the sensor data may not be confidently used for such purposes.
Table 14: Relative error in natural frequency and damping ratio estimation.
Property Mode MPU 6050 BMI 160 MMA 8452 MMA 7455 MMA 7361 ADXL 335
Frequency (Hz) 1 6.82% 6.77% 6.66% 7.03% 7.76% 6.96% 2 0.80% 0.92% 0.81% 0.79% 1.25% 1.00% 3 2.13% 2.20% 2.32% 1.99% 2.86% 2.26% Damping ratio (%) 12 -35.05%28.93% -30.87%-36.85% -25.08%11.42% 29.09%-4.21% -27.03%39.98% -23.44%3.36% 3 62.75% -8.91% 3.28% 33.00% 27.07% 6.31%
3.5 Part 4: Noise performance analysis
The Table 15 presents the noise performance analysis in terms of noise density and RMS value in the time domain, shown in parenthesis, together with the reference values from Table 5. Observations regarding PSD characteristics are also presented. The experimental results refer to a 100 Hz bandwidth for the digital accelerometers and 125 Hz bandwidth for analog.
Table 15: Experimental noise density, in g/√Hz, RMS value, in grms, presented in parenthesis., for a bandwidth of 100 Hz.
MEMS X Axis Y Z Reference Observation
MPU 6050 355
(0.0035) (0.0034) 337 (0.0045) 449 400 White noise, with peaks in 26Hz, 46 Hz and 51 Hz, in X and Y axis, and no peaks in Z axis.
BMI 160 508
(0.0051) (0.0040) 396 (0.0049) 496 180 (0.0015) Noise approximately white MMA 8452 224
(0.0022) (0.0025) 249 (0.0031) 316 126 Noise approximately white MMA 7455 1404
(0.0140) (0.0137) 1373 (0.0154) 1544 - A small non-linear drift is seen in time domain data. Noise approximately pink.
MMA 7361 286 (.0036) 292
(0.0034) (0.0051) 321 300 A non-linear drift is observed in time domain data. Noise predominantly white.
ADXL 335 111
(0.0013) (0.0013) 108 (0.0024) 187 150 (0.0018) A non-linear drift is observed in time domain data, a 26 Hz noise peak is observed. Noise approximately pink. Roughly, the reference values from datasheets were observed experimentally in the MEMS MPU 6050, MMA 7361 and ADXL 335. The other sensors presented larger noise, specially BMI 160. A possible explanation may be that these results include also the data-acquisition system noise, although the good results for the other sensors suggest that such
influence should be minimum. Also, the reference values do not correspond to the experimental conditions, e.g. BMI 160 reference value is for ±8g scale with 200 Hz output data rate (ODR), while the experimental result refer to a ±2g scale with 250 Hz. The greatest noise is observed in MMA 7455, which corroborates the results observed in the frame OMA experiments. The ADXL 335 presented the lowest noise density and the closest experimental values to reference values, both in terms of density and RMS value. Differences in performances are observed between axis, for all sensors, with the z-axis consistently the noisiest, which may be an architecture related characteristic since this axis is always orthogonal to the sensor die plane.
The observations regarding the signal PSD show that not always the white noise assumption, which is, for example, required in OMA analysis, is completely true, since some sensors present a pink noise. Unlike white noise, pink noise does not distribute its power equally among all frequencies, presenting higher power in low frequencies and then progressively reducing it in high frequencies. Sensors with such property shall not be adequate for sensing structures with low natural frequencies, e.g. bridges, in a low signal-to-ratio environment, since the uneven noise distribution may mask the lowest natural frequencies. Also, the observed drift in some sensors, which remained even after detrending the data, might jeopardize the sensor in applications where not only the signal frequency but also the numerical values of the accelerations are of interest. It is important to highlight that such phenomena might be due to the data-acquisition system, and not the sensor itself.
The Table 16 also presents the highest acceleration peak observed during the noise performance experiment. Along with the RMS value, these can be used to infer the smallest acceleration values required for a good signal to ratio experiment. The results are consistent to those in Table 16, i.e. higher/lower peak values are associated with higher/lower noise parameters. Again, the ADXL 335 presents the best performance, with the lowest acceleration peaks.
Table 16: Peak values observed in the noise performance experiment, in equivalent gravity acceleration force (g).
MEMS Axis X Y Z MPU 6050 0.0148 0.0146 0.0217 BMI 160 0.0238 0.0186 0.0218 MMA 8452 0.0110 0.0105 0.0127 MMA 7455 0.0574 0.0681 0.0769 MMA 7361 0.0308 0.0236 0.0614 ADXL 335 0.0083 0.0063 0.0115 4 CONCLUSIONS
This work evaluated experimentally the performance of six low-cost MEMS accelerometers, comprising an analysis of documented specifications, real monitoring of a three-storey frame model excited by a fan and a concrete slab excited by a heel impact and an experimental noise performance evaluation. Reference values for comparison are obtained in the literature and with a professional equipment.
The specification analysis showed some that the range, bandwidth and cross-axis sensitivity of low-cost MEMS accelerometers can meet the literature’s requirement for SHM applications. The noise density, however, are very far from the low-noise requirement in structural monitoring, which sometimes require the capacity of detecting micro vibrations (10-6 g). Nevertheless, the studied sensors might still be adequate for monitoring of high excitable structures, e.g. footbridges or bridges submitted to ambient excitation of winds or usage loads. Also, the specification analysis evidenced the difficulty in comparing sensor only using datasheets, since the information given by different manufactures were not always referring to same experimental determination conditions.
The MEMS accelerometer presented an overall good performance for the estimation of natural frequencies both in the three-storey frame and concrete slab monitoring. In the three-storey frame, which was excited by a fan to simulate an OMA condition, the natural frequency identification presented errors of less than 1.02% relative to the professional SHM equipment, while in the concrete slab the differences were smaller than 7.76% of the reference values, reaching errors as low as 0.79%. The slab reference values, however, were obtained from previous experimental results, which might differ in testing conditions and partially explain the observed differences. The damping ratios presented high variability among all sensors and in both structures, indicating either high noise sensitiveness of the identification methods or non-suitability of the employed sensors for damping ratios estimates due to high SNR. Further studies focusing the damping ratio estimation with these low-cost MEMS accelerometers are required.
The noise performance evaluation allowed the experimental determination of noise density, RMS and peak noise value, which can be used to orient the suitability of the tested systems for structural monitoring. The noise evaluation, however, accounted also for the noise of the low-cost data-acquisition system developed, which may explain the high noise observed in some sensors, way above the documented reference in datasheets. The ADXL 335 was the sensor with best performance, with a noise density as low as 108 g/√Hz, and 0.0013 gRMS, although it contains a non-linear drift and an approximately pink noise which might restrain its performance in some applications.
From the evaluations performed in this work, it can be concluded that low-cost SHM monitoring systems are viable and low-cost MEMS accelerometers present reasonable behaviour in terms of resolution, sensitivity and noise level. The data gathered with such systems allowed the identification of the first three natural frequencies of a three-storey frame model and a concrete slab within acceptable approximation reference values, although damping ratio estimation were not possible. The comparative evaluation, which submitted all MEMS to similar tests condition, aims to support decision making between which sensor to use in future applications. Low-cost monitoring system might be a valuable tool for applications were high precision is not a requirement and the budget is an important aspect. Further studies shall focus in the application of these sensors in real SHM situations, comprehensive studies involving the damping ratio evaluation, and the identification of other modal parameters, such as mode shapes.
Acknowledgements
The authors thank the support of CNPq (Conselho Nacional de Desenvolvimento Científico e Tecnológico) and FAP-DF (Fundação de Apoio a Pesquisa do Distrito Federal) for the financial aid for this work.
Author’s Contributions: Conceptualization, RR Ribeiro and RM Lameiras; Formal analysis, RR Ribeiro; Funding
acquisition, RM Lameiras; Investigation, RR Ribeiro; Methodology, RR Ribeiro and RM Lameiras; Project administration, RR Ribeiro and RM Lameiras; Resources, RM Lameiras; Software, RR Ribeiro; Supervision, RM Lameiras; Validation, RR Ribeiro; Visualization RR Ribeiro; Writing – original draft, RR Ribeiro; Writing – review & editing, RR Ribeiro and RM Lameiras.
Editor: Adnan Ibrahimbegovic; Paulo de Mattos Pimenta
References
Acar, C. & Shkel, A. M., 2003. Experimental evaluation and comparative analysis of commercial variable-capacitance MEMS accelerometers. Journal of Micromechanics and Microengineering, 13(5), pp. 634-645.
Analog Devices, 2010. ADXL335 - Rev. B, Norwood: Analog Devices, Inc.
Andò, B., Baglio, S. & Pistorio, A., 2014. A Low Cost Multi-Sensor Strategy for Early Warning in Structural Monitoring Exploiting a Wavelet Multiresolution Paradigm. Procedia Engineering 87, 1(1), pp. 1282-1285.
Arduino, 2018a. What is Arduino? [Online]. Available at: https://www.arduino.cc/en/Guide/Introduction [Accessed 23 May 2018].
Arduino, 2018b. Arduino UNO Rev3. [Online] Available at: https://store.arduino.cc/usa/arduino-uno-rev3 [Accessed 23 May 2018].
Arduino, 2018c. Arduino Wireless SD Shield. [Online] Available at: https://store.arduino.cc/usa/arduino-wirelss-sd-shield [Accessed 23 May 2018].
Azenha, M. Faria, R., Magalhães, R., Ramos, L., Cunha, A. 2012. Measurement of the E-modulus of cement pastes and mortars since casting, using a vibration based technique. Materials and Structures/Materiaux et Constructions, v. 45, n. 1–2, p. 81–92. Bosch Sensortec, 2015. BMI160 - Data sheet, Reutlingen: Bosch Sensortec.
Brownjohn, J. M. W., 2007a. Structural Health Monitoring of Civil Infrastructure. Philosophical Transactions: Mathematical, Physical and Engineering Sciences, pp. 589-622
Brownjohn, J. M. W., 2007b. Noise Characteristics of Sensors for Extreme Low Level Vibration Measurements. 25th International Modal Analysis Conference (IMAC XXV), 19-22 February.
Brownjohn, J. M. W., Dumanoglu, A. A., Severn, R. T. & Blakeborough, A., 1989. Ambient vibration survey of the Bosporus suspension bridge. Earthquake engineering and structural dynamics, Volume 18, pp. 263-283.
Carmona, J. E. C., Avila, S. M., Doz, G. Dynamic Tests on a Concrete Slab with a Tuned Mass Damper. MATEC Web of Conferences, v. 24, n. October, 2015.
Carmona, J. E. C., Avila, S. M., Doz, G. Proposal of a tuned mass damper with friction damping to control excessive floor vibrations. Engineering Structures, v. 148, p. 81–100, 2017.
Chacón, R.; Oller, S. 2016 Designing Experiments Using Digital Fabrication in Structural Dynamics. Journal of Professional Issues in Engineering Education and Practice V. 143.
Chollet, F. & Liu, H., 2016. A (not so) short Introduction to Micro Electromechanical Systems. version 5.3: http://memscyclopedia.org/introMEMS.html.
Chung, H.-C., Enomoto, T., Loh, K. & Shinozuka, M., 2004. Real-time visualization of bridge structural response through wireless MEMS sensors. Proceedings of SPIE, Volume 5045, pp. 239-246.
Cigada, A., Moschioni, G., Vanali, M. & Caprioli, A., 2010. The measurement network of the san siro meazza stadium in milan: origin and implementation of a new data acquisition strategy for structural health monitoring. Experimental Techniques, 34(1), pp. 70-81.
Cigada, A., Lurati, M., Redaelli, M. & Vanali, M., 2008. Evaluation of the metrological perfomances of MEMS accelerometers to the aim of their application in Structural Health Monitoring. IMAC XXVI Internation Modal Analysis Conference, pp. 1-9. Clough, R. W. & Penzien, J., 2003. Dynamics of Structures. 3rd ed. Berkeley: Computers & Structures.
D’Emilia, G., Di Gasbarro, D., Gaspari, A. & Natale, E., 2017. Identification of calibration and operating limits of a low-cost embedded system with MEMS accelerometer. Journal of Physics: Conference Series, Volume 882, p. 012006.
Duc, T. T., Anh, T. L. & Dinh, H. V., 2017. Estimating Modal Parameters of Structures Using Arduino Platform. Singapore, s.n. Eletrobras, 2017. PROCEL INFO - Programa Nacional de Conservação da Energia Elétrica. [Online] Available at:
http://www.procelinfo.com.br/services/DocumentManagement/FileDownload.EZTSvc.asp?DocumentID={A4E6BE83-9C63-44E0-9FD0-5C660812F0FD}&ServiceInstUID={46764F02-4164-4748-9A41-C8E7309F80E1} [Accessed 22 July 2018]. Endevco, 2011. TP 328 - Practical understanding of key accelerometer speciications. [Online] Available at:
https://www.endevco.com/news/emails/2011_12/tp328.pdf [Accessed 21 07 2018].
Farrar, C. & Worden, K., 2007. An Introduction to Structural Health Monitoring. Philosophical Transactions: Mathematical, Physical and Engineering Sciences, 15 Feb., 365(1851), pp. 303-315.
Fröjd, P. & Ulriksen, P., 2018. Detecting damage events in concrete using diffuse ultrasound structural health monitoring during strong environmental variations. Structural Health Monitoring, 17(2), pp. 410-419.
Gulizzi, V., Rizzo, P., Milazzo, A. & Ribolla, E. L. M., 2015. An integrated structural health monitoring system based on electromechanical impedance and guided ultrasonic waves. Journal of Civil Structural Health Monitoring, 5(3), pp. 337-352. InvenSense, 2013. MPU-6000 and MPU-6050 - Product Specification - Revision 3.4, Sunnyvale: InvenSense Inc.
Kavitha, S., Daniel, R. J. & Sumangala, K., 2016a. Design and Analysis of MEMS Comb Drive Capacitive Accelerometer for SHM and Seismic Applications. Measurement, Volume 93, pp. 327-339.
Kavitha, S., Daniel, R. J. & Sumangala, K., 2016b. High performance MEMS accelerometers for concrete SHM applications and comparison with COTS accelerometers. Mechanical Systems and Signal Processing, Volume 66, pp. 410-424.
Kwong, K.-M., 2017. MEMS Accelerometer Specifications and Their Impact in Inertial Applications. Master dissertation ed. Toronto: University of Toronto.
Littler, J. D., 1995. An assessment of some of the different methods for estimating damping from full-scale testing. Journal of Wind Engineering and Industrial Aerodynamics, Volume 57, pp. 179-189.
Lynch, J. P., Wang, Y., Loh, K. & Yi, J.-H., 2006. Performance monitoring of the Geumdang Bridge using a dense network of high-resolution wireless sensors. Smart Materials and Structures, 15(6), pp. 1561-1575.