Does Quantitative Easing impacts
firms´ Capital Structure?
Pedro Gabriel Gonçalves da Rocha
Católica Porto Business School 2019
Does Quantitative Easing impacts
firms´ Capital Structure?
Dissertation presented to Universidade Católica Portuguesa to earn the Master´s degree in Finance
Made by
Pedro Gabriel Gonçalves da Rocha
Under supervision of
Professor João Filipe Monteiro Pinto
Católica Porto Business School April 2019
iv
Acknowledgements
In first place, I would like to praise Professor João Pinto, for accepting being my supervisor in this last part of my master program. Also, I would like to thank him for his dedication, readiness and support. For me, it is absolutely clear that without him I wouldn´t have complete this last phase.
In second place, I am grateful for receiving the support from my family, especially from my parents, who inspire me, encourage me and financially supported me to conclude another step in my academic path and my brother who always believed in me.
In last but not least, I would like to recognize all of my friends, but in particular, the friends from my master program that allow me to go further than I would otherwise have gone.
vi
Resumo
Esta tese tem como principal objectivo verificar a ocorrência e quantificar o impacto da política monetária Quantitative Easing (ou usando uma tradução livre, flexibilização quantitativa) na estrutura de capitais das empresas. Vai ser apresentadas teorias de política monetária convencionais e não convencionais. De seguida, vai-se analisar a implementação de Quantitative Easing por varios bancos centrais, entre eles a Reserva Federal, o Banco Central Europeu e o Banco de Inglaterra. Por fim, irá ser apresentado uma descrição das principais teorias da estrutura de capitais (teoria trade-off e pecking-order).
Os nossos resultados vão contra a literatura existente. De acordo, com os nossos resultados o impacto da política de Quantiative Easing não tem impacto estatistico significativo na politica de financiamento da empresa.
Palavras-chave: Política monetária convencional; Política monetátia não convencional; Estruturas de capitais
viii
Abstract
The main goal of this thesis is to verify and quantify the impact of monetary policy Quantitative Easing on firms´ capital structure. It will be presented theories about conventional and unconventional monetary theory. Following, it will be analyze the implementation of Quantitative Easing by a few central banks, like the Federal Reserve, the European Central Bank and the Bank of England. Finally, it will be presented a description of the prominent theories of capital structure (trade-off theory and pecking-order).
Our results go against existing literature. According to our results the Quantitative Easing impact does not have statistically significance impact on the financing decision policy.
Keywords: Conventional monetary policy; Unconventional monetary policy; Capital Structure;
Table of Contents
Acknowledgements ... iv Resumo ... vi Abstract ... viii 1. Introduction ... 14 2. Literature Review ... 16 2.1. Monetary Policy ... 162.1.1. Conventional monetary policy ... 17
2.1.2. Unconventional monetary policy ... 17
2.2. Quantitative Easing (QE) around the world... 18
2.2.1. Federal Reserve ... 19
2.2.2. European Central Bank (ECB) ... 21
2.2.3. Bank of England (BOE) ... 23
2.3. Capital Structure ... 24
2.3.1. Modigliani-Miller ... 25
2.3.2. Pecking-Order theory ... 25
2.3.3. Static trade-off ... 25
3. Sample selection, methodology and variables ... 27
3.1. Data Description ... 27
3.2. Methodology ... 27
3.3. Capital Structure determinants ... 28
3.3.1. Taxes ... 28
3.3.2. Tangibility (tang) ... 29
3.3.3. Profitability (profit) ... 29
3.3.4. Growth opportunity (growth) ... 29
3.3.5. Firm size (size) ... 30
3.3.6. Business risk (risk) ... 30
3.3.7. Non-debt tax shields (NDTS) ... 30
3.3.8. Investment opportunity (Invest) ... 31
4. Main Results ... 32
4.2. Regression analysis... 32
5. Conclusion ... 36
6. References ... 38
xii
List of Tables
Table 1- The results obtain from the OLS regression ... 33 Table 2- Data description and Wilcoxon sum rank test ... 43 Table 3 - Data description and Fisher´s exact test ... 44
14
1. Introduction
In recent years, central banks around the world have used both conventional and unconventional monetary policies to respond to the 2007-2008 financial crisis. Central banks have tried to reach a perfect combination between conventional (interest rate) and unconventional (credit easing) monetary strategies (De Fiore and Tristani, 2018).
The topic of capital structure is one of the most searched topics and authors try to answer the following question: how firms choose the mix between equity and debt to finance their activities. The first widely accept theory was proposed by Modigliani and Miller (1958) which, in a perfect world, capital structure is irrelevant.
In the best of our knowledge, research on impact of unconventional monetary policy (Quantitative Easing) on companies´ capital structure is scarce. So, the research question of this thesis is: Does Quantitative Easing impacts firms´ capital structure?
In first place, it will be define what monetary policy is, after we will define and distinguish the difference between conventional and unconventional monetary policy. Next, it will be described the way each central bank implemented their Quantitative Easing (QE) and which channels chosen that allow this unconventional policy to affect the economy. Following that, it will be provided a definition of the most prominent capital structure theories, namely pecking-order theory and static trade-off theory. Then, it will be necessary to recover data to try to prove and quantify said impact.
In order to limit the analyses, we opted to quantify the impact for the euro-area companies. To do so, we gathered information from 129 public companies by analyzing information obtained from Thompson Reuters and their annual
15
report. Our main results concluded that the Corporate Sector Purchase Programme (CSPP) was not statistically significance in explaining the capital structure for the 129 public companies chosen, so our data cannot quantify the impact of QE on those firms´ capital structure.
The structure of the thesis will be as follow, section 2 will be the literature review regarding monetary policy, namely conventional and unconventional monetary policies. Also, it will provide a description and implementation mechanism of the different Quantitative Easing used by central banks in the study (Federal Reserve, European Central Bank and Bank of England). Then, it will be studied the most important capital structure theories. Section 3 will show the data description, the methodology adopted and the capital structure determinants. In section 4, it will be discuss the main results of the study including the univariate analysis and the regression analysis results. Finally, section 6 will present a brief summary of the thesis, including the final answer to our research question and suggestions for future research regarding this topic.
16
2. Literature Review
On this chapter, it will be presented a literature review of monetary policy, quantitative easing and capital structure theories. Regarding monetary policy, we will provided a definition and will distinguish conventional from unconventional monetary policies. About quantitative easing, it will be described and it will be explained its implementation mechanism from different central banks, like Federal Reserve, European Central Bank and Bank of England. Finally, we will present an explanation of the different capital structure passing from Modigliani and Miller, to Pecking-order theory and to Static Trade-off.
2.1.
Monetary Policy
The dominant objective of central banks are to create monetary policy that provide price stability to the economy (Castelnuovo, Nicoletti-Altimari and Rodríguez-Palenzuela, 2003; Fullwiler and Wray, 2010; Hellwig, 2014; Issing, 2002; Johnson, Small and Tryon, 1999; Koetter et al., 2012; White, 2006). Monetary policy to be effective has to have transmission mechanism that allows central banks to affect actions and decisions of financial and non-financial companies and families (Balaceanu and Dragne, 2014).
According to Galariotis, Makrichoriti and Spyrou (2017), central banks use monetary policy tools as a response to the volatility correlated with financial crisis or economic bubbles.
Monetary policy should prevent money itself from being a foremost foundation of economic disturbance, should also offer a steady back-ground for the economy and should contribute to counterbalance major disruption in economic system arising from additional sources (Friedman, 1968). According to
17
Clarida, Galí and Gertler (1999), “monetary policy significantly influences the short-term course of the real economy”.
During atypical times, communication of monetary policy is crucial due to the high volatility of the economy. The addition of new policy tools can damage the expectation of policy actions (Coenen et al., 2017).
In the next section, we will analyze the categorization of conventional and unconventional monetary policies.
2.1.1. Conventional monetary policy
According to Cúrdia and Woodford (2009), conventional monetary policy should center around interest rate. Also, conventional monetary policy can set nominal interest rate and can determine expected inflation, which in turn may determine structure of long-term interest rate on debt (Cochrane, 2014).
Regarding Joyce, Miles, Scott and Vayanos (2012), conventional monetary policy changes “… short-term interest rate at which the central bank provided funds to banks or to the interbank market and the impact of official rate on market rates and the wider economy was reliably.”
2.1.2. Unconventional monetary policy
Unconventional monetary policy is out of the normal strategy of monetary policy (Lenza, Pill and Reichlin, 2016). Unconventional policy can be interpreted as the “monetary policy expanding central bank credit intermediation to offset a disruption of private financial intermediation” (Gertler and Karadi, 2011).
Unconventional monetary policy can be seen as an alternative for interest rate policy (conventional policy) in the face of financial shock (De Fiore and Tristani, 2018). As point out by Micossi (2015), unconventional policies used by central
18
banks were primarily directed to stabilize unique sectors of the financial systems, which were severely damaged by the crisis.
As studied by Williams (2011), unconventional monetary policies tools are forward policy guidance and large-scale asset purchases (LSAPs). The forward policy guidance says that central banks have to keep short-term interest rate lower than they otherwise would and have to let inflation to be higher than otherwise would, however families and businesses may have a different set of expectations for the monetary policy and for the economy, so is crucial that the expectation channel is align for the optimal effectiveness of the forward guidance policy. On the other hand, LSAPs is the major substitute of the forward policy guideline. The LSAPs consist on the central bank acquiring securities financed by an increment of reserves.
Another type of unconventional policy that was introduced by ECB as an answer to the European sovereign debt crisis, was the Outright Monetary Transaction (OMT). This policy grant ECB to acquire an unlimited amount of government bonds in secondary markets. As a consequence, there was a reduction of the spreads in sovereign bonds issued by Europeans countries more affected by the crisis (Acharya et al., 2016; Szczerbowicz, 2015).
2.2.
Quantitative Easing (QE) around the world
According to Van Binsbergen et al. (2019), after the recent financial crisis government bonds yields had its premium reduced because of central bank use of conventional and unconventional monetary policies, in particular the use of Quantitative Easing (QE). QE is define by this author as the purchase of long-term government treasury bonds. Recent literature, like Orphanides (2017), shows that QE policies have been efficiently “… printing money and purchasing government debt with the proceeds.” Despite concerns about rising inflation, the
19
Fed and the ECB have, on average, inflation under their respective goal since the recent crisis.
As pointed out by Pinto and Correia (2017), by Szczerbowicz (2015) and by Beirne et al., (2011), the European Central Bank first Covered Bond Purchase Program allowed a decrease of the mortgage covered bonds (MCB) in the Euro area. Also, according to Pinto and Correia (2017) the second Covered Bond Purchase Program is positive correlated with the credit spreads for public covered bonds, but has no significant impact on MCB. The another result studied by Pinto and Correia (2017) was an indirect result, because they observed that despite not being included in the covered bond purchase program, asset-backed securities decreased its credit spread, this decrease was more intensely in countries like Portugal, Ireland, Italy, Greece and Spain.
Fawley and Neely (2013) defends that QE policies increase the monetary base through asset purchase programs and lending programs, these programs are intended to upgrade the credit easing, so there is a catalyst for economic growth.
In the next part of this chapter, we will analyze further QE instruments used by the Federal Reserve Bank, the European Central Bank and the Bank of England
2.2.1. Federal Reserve
As a response to the 2007-2008 financial crisis, the Fed lowered its traditional instrument (target federal funds rate) to the zero lower bound (ZLB). As the economy gone worse, and with this instrument on the maximum capacity, the Fed started to acquire vast amounts of assets (securities and bonds), denominated large scale asset purchases (LSAPs) with medium and long maturities, trying to decrease the interest rate to the private sector (families and business), specially with longer maturities. This action tries to increase inflation to the levels close to 2% in the medium term (Altavilla and Giannone, 2016; Gagnon et al., 2011; Hudson, 2010). Building on that, Bernanke and Reinhart
20
(2004) affirms that a way to stimulate the economy is to grow “…the size of the central banks’ balance sheet beyond the level needed to set the short term policy rate at zero (“quantitative easing”)”.
As stated before, the Fed in response to the financial crisis implemented LSAPs or commonly known as Quantitative Easing (QE). The first wave of LSAPs or QE1 commenced on November 25, 2008, when Federal Open Market Committee (FOMC) publicized a program to acquire agency mortgage-backed securities (MBS), federal agency debt (issued by Ginnie Mae, Fannie Mae and Freddie Mac) and long-term treasury bonds. The Fed purchase $1.725trillion that were divided by the following amount: $1.25 trillion in MBS, $175 billion in agency federal debt and $300 billion in long-term treasuries. Despite this aggressive program, the US was going into a deflationary trajectory, so FOMC introduced QE2, which entailed a total purchase of $778 billion in long-term Treasuries ($600 billion new and $178 billion reinvested from QE1. This program´s duration was from November 3, 2010 to June 30, 2011 at a rate of $75 billion a month. Lastly, on September 13, 2012, FOMC launched QE3, which involves acquisition of $40 billion in MBS per month. On December 2012, FOMC added a $45 billion in long-term treasuries to the per month basis. One year later (December 2013), FOMC reduced in $10 billion the per month acquisition to $75 billion, reducing $5 billion in MBS and $5 billion in treasuries. The end of QE3 was on October 29, 2014 (Rodnyansky et al., 2017).
In the next part, we will discuss channels through which QE operated. The first channel studied is Duration Risk Channel. When the Fed buys long-term treasuries, agency debt and MBS, this channel allows a decrease in the yield of all long-term assets, like treasuries, corporate bonds and mortgage, also, through this channel it is expected that longer duration assets suffers a higher reduction on the yield than shorter ones (Gagnon et al., 2010; Krishnamurthy and Vissing-Jorgensen, 2011). Another channel use is the refinancing channel, regarding
21
Maggio et al. (2016) “Quantitative easing works through a refinancing channel by improving credit availability and lowering rates for affected households.”, also, there is an increase in the demand because of the improving credit and lower rates, this will imply a diminution of the monthly mortgage. The signaling channel may affect the price of assets because the market agents know about the economy performance and know how the central bank will react (Christensen and Krogstrup, 2018; Christensen and Rudebusch, 2012; Rosa, 2012). The QE3 encouraged extra commercial and industrial lending and increased origination of home purchase mortgages, which conduced economically sizable growth in total employment, so LSAPs, like the conventional reduction of interest rate, affected real economic outcomes via a bank lending channel (Luck et al., 2018).
2.2.2. European Central Bank (ECB)
In response to the crisis of 2007-2008, the ECB started to implement its QE through the Asset Purchase Programme (APP). The first program was the Covered Bond Purchase Programme (CBPP1), it started at €60 billion and its duration was from July 2009 until June 2010. The second Covered Bond Purchase Programme (CBPP2) was from November 2011 to October 2012 and about €16.4 billion. Another important program implemented was the Securities Markets Programme (SMP) that extended from May 2010 until September 2012 and its main goal was to acquire sovereign bonds through secondary markets. At the maximum the SMP portfolio was about €210 billion, the assets bought through this programme were held to maturity. Another additional programs started to respond to the sovereign debt crisis installed in Europe were the Asset-Backed Securities Purchase Programme (ABSPP) and the third Covered Bond Purchase Programme (CBPP3). They were implemented at September 2014. In January 2015, there was an addition to the previous ABSPP and CBPP3, which was the inclusion of the Public Sector Purchase Programme (PSPP). The total program
22
started with acquisition of €60 billion per month. In March 2016, APP was increased to 80€ billion per month with the inclusion of the Corporate Sector Purchase Programme (CSPP). In April 2017, PSPP was decreased to 60€ billion. Finally reducing to 30€ billion per month until the end (Abidi and Miquel-Flores, 2018; Koijen, Koulischer, Nguyen and Yogo, 2018).
As said earlier, APP comprised of €60 billion per month that were allocating the following away: €10 billion of ABS and covered bonds; 50€ billion of PSPP (6€ billion from supranational institution and 44€ billion to acquire purchase sovereign debt securities). The ECB has planned to acquire 836€ billion of euros of sovereign bonds. One of the main goals of the APP, in particularly PSPP is to help European public finances because there is a decrease of yields. (Claeys, Leandro and Mandra, 2015).
The covered bond market is a very important privately issued bond segment in capital market of Europe. During the recent financial crisis, the credit spreads of covered bonds in the secondary markets widened and there was a stalled issuance in the primary market, also, liquidity in the secondary market worsened. As a response, ECB implemented the CBPP. The CBPP objectives were: (i) encouraging decline in money market term rates; (ii) easing funding conditions for credit institutions; (iii) Encouraging credit institutions to maintain and expand their lending to clients; and (iv) improving market liquidity in important segments of private debt securities market (Beirne et al., 2011).
On March 10, 2016, ECB announced an addition to its APP, with the inclusion of the CSPP, which is usually named by corporate quantitative easing. So, APP consists of: (i) CBPP3; (ii) ASBPP; (iii) PSPP; and (iv) CSPP. The main objective of CSPP was to improve the financing conditional of Eurozone´s real economy. This was achieved by the fact that after March 2016, there was a decrease of yields on corporate bonds and a reduce of cost of borrowing for Eurozone non-financial
23
firms (Abidi and Miquel-Flores, 2018). Also, according to the author APP was constructed to bring inflation close to 2%.
As mentioned by Andrade, Breckenfelder, Fiore, Karadi and Tristani (2016), there are three main transmission channels of QE purchases: (i) signaling channel; (ii) portfolio rebalancing channel; and (iii) reanchoring channel. The signaling channel works as a declaration from the central bank stating the interest rate policy will be preserved at the lower bound for a long time (Andrade et al., 2016; Bhattarai, Eggertsson, Gafarov and State, 2014; Krishnamurthy, Nagel and Vissing-Jorgensen, 2017). The portfolio rebalancing or asset valuation channel that provides the market with an alteration of future expected returns (Andrade et al., 2016). And, finally, the last transmission channel is the reanchoring channel which means to give the private sector the confidence necessary to impulse the price level stability to normal levels, which implies inflation close to 2% (Andrade et al., 2016; Benhabib, Schmitt-Grohé and Uribe, 2001; Gurkaynak, Sack and Swanson, 2005).
2.2.3. Bank of England (BOE)
To respond to the financial crisis of 2007-2008, BOE untied both conventional and unconventional monetary policies. The main element of the unconventional monetary policy tool used was the asset purchases financed by central bank, or quantitative easing (QE) (Joyce, Michael; Tong, Matthew; Woods, 2011) . The main goal of BOE´s QE was to restore confidence in the market to make inflation achieve the 2% goal (Christensen and Rudebusch, 2012b). The BOE asset purchase program was planned to disturb the yields and prices on a varied range of assets, in particularly bonds issued to finance lending to firms and families (M. Joyce, Miles, Scott and Vayanos, 2012b).
The Bank of England created the Asset Purchase Fund (APF) and started to buy corporate bonds, commercial paper and government (gilts) bonds. The
24
commercial paper acquisition began on February 13, 2009. By February 2010, BOE had bought £200 billion of which £198 billion were gilts, and by 2012 BOE had purchased up to £375 billion of assets (M. A. S. Joyce, Lasaosa, Stevens and Tong, 2011; Ledenyov and Ledenyov, 2013).
According to Gagnon, Joseph E (1999) BOE utilized three channels of QE´s transmission: (i) reducing risk spreads associated with market panics; (ii) reducing expectations of the future short-term interest rate policy; and (iii) reducing the term premium in gilts yields by reducing its long-term supply in the market which caused an increase in the gilts´ price. Building on that, Berry, Benfor and Robson (2009) argues that the main channel is the economic channel. This channel injects “… money into the economy, in return for other assets, increases the liquidity of private sector balance sheets”. This causes monetary expansion which drives spending, which is expected to increase inflation.
2.3.
Capital Structure
This next section will provide a literature review of the main theories about capital structure, namely Modigliani-Miller, Pecking-Order Theory and Static trade-off.
Despite capital structure theories being one of the most studied topics in the area of corporate finance, there more space for additional research in this topics, because this topic answers one of the most important decision of any firm, which is the decision of how to finance the firms´ activities.
25
2.3.1. Modigliani-Miller
The first modern capital structure theory was proposed by Modigliani and Miller (1958). This theory defends that exist a perfect competition in the capital market and an effortlessness access to those market, the market value of firms is independent of its capital structure and the expected return on equity (ROE) increases in the same dimension to the debt-equity ratio, this holds true because equity holders of the levered firm require a premium related to financial risk equivalent to the debt-to-equity ratio times the spread between expected rate of return in firms´ total assets and expected rate of return on debt (Chang, 2015; Glickman, 1996).
2.3.2. Pecking-Order theory
This model of financing decision assumes that firms do not target a specific debt ratio, however they only use money outside of the company when internal funds are insufficient. External funds are less desired because of the existence of asymmetries of information between management and investors. Also, the business prefer debt to equity if it has to issue securities. Companies pursue financial reserves to evade the use of external, so the way that funds are used is the following, first the company uses internal funds (reserves), after issues new debt and as last resort, the firm will issue new equity (Graham and Harvey, 1999; Myers, 1984; Myers and Majluf, 1984).
2.3.3. Static trade-off
The other famous capital structure theory is the static trade-off theory, that according to Frydenberg (2004) defends that firms might try to adjust their capital structure to some target, leverage depends on restrictions in the debt-contracts, take-over possibilities and managements´ reputation.
26
The trade-off theory affirms that companies have an optimal debt-equity ratio, which is determined by trading off the benefits of debt. After established a target debt-to-equity value ratio, the firms gradually moves towards that target and the firms will be adjusting its dividends policy to move to the optimal target payout ratio. So, this model express a trade-off between the benefits of the use of debt and the expected costs of bankruptcy (Graham and Harvey, 1999; Miglo, 2010; Myers, 1984).
27
3. Sample selection, methodology and variables
This next section is divided in three parts. The first is entitled data description and will provide a description of the database used, the second part is the methodology adopted and will indicate the specification of our model and the type of regression used, lastly, the third part is the capital structure determinants and will specify the determinants used in our model.3.1.
Data Description
We chose 129 firms with headquarters in the euro area. Firms´ accounting and market data were extracted from Thompson Reuters DataStream. The firms´ credit rating was manually extracted from their annual reports.
To achieve to this 129 companies, we extracted data from Thompson Reuters, then we eliminated the companies that did not provided the full information for: (i) market value of total debt; (ii) market value of total assets; (iii) fixed assets; (iv) depreciation and amortization; (v) CAPEX; (vi) market to book ratio; (vii) EBIT; (viii) EBITDA and (ix) Effective tax rate.
As in Grosse-Rueschkamp et al. (2018) we chose companies from all sectors of the economy with the exception of financial firms.
Data were extracted for the 2009-2018 period so that the determinants of capital structure could be analyzed before and after the beginning of the CSPP, this program begin in 2016.
3.2.
Methodology
To address our research question, it is vital to our dependent variable, define leverage. Harris and Raviv (1991) define leverage as the ratio between total debt
28
and total assets. Silva and Pinto (2018) define leverage as the ratio between book value of debt and book value of equity because they analyze a sample of private companies. As our study examines euro-area public firms, we define leverage as: 𝐿𝑒𝑣𝑖𝑡 = 𝑇𝑜𝑡𝑎𝑙 𝐷𝑒𝑏𝑡𝑖𝑡
𝑇𝑜𝑡𝑎𝑙 𝐴𝑠𝑠𝑒𝑡𝑠𝑖𝑡 , where 𝐿𝑒𝑣𝑖𝑡 is the leverage ratio for company i in year t,
𝑇𝑜𝑡𝑎𝑙 𝐷𝑒𝑏𝑡𝑖𝑡 is the market value of total debt for company i in year t and 𝑇𝑜𝑡𝑎𝑙 𝐴𝑠𝑠𝑒𝑡𝑠𝑖𝑡 is the market value of total asset for company i in year t.
Grosse-Rueschkamp et al, (2018), Abidi and Miquel-Flores (2018), and Arce, Gimeno and Mayordomo (2017) use the dummy variable CSPP that takes value 1 if the period is after the implementation of the CSPP, so if the year is 2016-2018 period, the dummy takes the value one and zero otherwise. The authors also use a dummy variable that take value one if firm is eligible for the program and zero otherwise; i.e., takes the value one if companies has a credit rating of BBB by Standard and Poors and Fitch or Baa3 by Moody or higher, and zero otherwise. We estimate the impact of the CSPP program on firms´ leverage using an ordinary least square (OLS) model. The specification of the model is:
𝐿𝑒𝑣𝑖𝑡 = 𝛽0+ 𝛽1𝐶𝑆𝑃𝑃𝑡+ 𝛽2𝐶𝑆𝑃𝑃𝑡∗ 𝐸𝑙𝑖𝑔𝑖𝑏𝑙𝑒𝑖 + 𝛽3 𝑇𝑎𝑥𝑒𝑠𝑖𝑡+ 𝛽4𝑇𝑎𝑛𝑔𝑖𝑡+ 𝛽5𝑃𝑟𝑜𝑓𝑖𝑡𝑖𝑡 + 𝛽6𝐺𝑟𝑜𝑤𝑡ℎ𝑖𝑡+ 𝛽7𝑆𝑖𝑧𝑒𝑖𝑡+ 𝛽8𝑅𝑖𝑠𝑘𝑖𝑡+ 𝛽9𝑁𝐷𝑇𝑆𝑖𝑡+ 𝛽10𝐼𝑛𝑣𝑒𝑠𝑡𝑖𝑡+ 𝜀𝑖𝑡
3.3.
Capital Structure determinants
In this next part of the chapter, it will be discussed the determinants that influence the level of leverage in a firm and its predicted effect on leverage.
3.3.1. Taxes
According to DeAngelo and Masulis (1980), Kraus and Litzenberger (1973) and Miller (1977), when tax rates are higher, firms will have more debt to capture higher interest tax shields. We calculate the effective tax rate as in Silva and Pinto (2018), using the ratio between effective tax paid and pre-tax earnings. Our
29
expectation is to find a positive correlation between effective corporate tax rates and leverage.
3.3.2. Tangibility (tang)
As pointed out by Harris and Raviv (1991), Myers (1977), and Scott (1977), tangible assets are easily collateralize and, as a consequence, will decrease the agency cost of debt. So, we are expecting that tangibility will have a negative impact on leverage.
Like Bevan and Danbolt (2000), Huang and Song (2002), and Pandey (2001), we will use the ratio between fixed assets and total assets as a proxy for tangibility.
3.3.3. Profitability (profit)
Fama and French (2002), Harris and Raviv (1991), Jensen (1986), and Myers and Majluf (1984), asset that profitability is the quantity of earnings accessible to be used by the company. Fama and French (2002) argues that an increase of profitability decrease the leverage and this interaction is in line with pecking-order theory. As in Frank and Goyal (2007), we use the EBITDA divided by total assets as a proxy for profitability.
3.3.4. Growth opportunity (growth)
According to Fama and French (2002) and Silva and Pinto (2018), firms with a higher growth potential have less debt because: (i) they reinvest their retained earnings in opportunities to expand, leaving them with no cash to “…invest in organizational inefficiencies;” and (ii) they are specially keen to avoid problems of underinvestment and asset substitution problems. Trade-off theory predicts that higher growth opportunities will lead to less leverage, but pecking-order
30
predicts that companies with higher investment plans will tend to accumulate more debt [Frank and Goyal (2007), Harris and Raviv (1991), and Myers (1977)]. As in Frank and Goyal (2007) and Silva and Pinto (2018), our proxy for growth opportunities is the division between CAPEX and total assets.
3.3.5. Firm size (size)
On the one hand, pecking-order theory predicts that larger firms tend to need less debt than smaller firms. On the other hand, trade-off theory points out that larger firms are more diversified and face a lower default risk [Frank and Goyal (2007), Harris and Raviv (1991), and Titman and Wessels (1988)]. The evidence about this impact on leverage are diverse: on the one hand, Harris and Raviv (1991) found a positive correlation; on the other hand Frank and Goyal (2007) found evidence of the two situations (positive and negative correlations). We will use logarithm of total assets as a proxy for the firm size as in Frank and Goyal (2007), and Silva and Pinto (2018).
3.3.6. Business risk (risk)
According to Frank and Goyal (2007) and Myers (1984), business risk disturbs companies´ financing decision. Following the thought of trade-off theory, a company with higher earnings volatility faces higher expected costs of financial distress, so it will have a lower leverage. Following the thought of pecking-order theory, it is predicted that riskier companies have higher leverage.
As in Silva and Pinto (2018), we will use standard deviation of EBIT as a proxy for business risk.
3.3.7. Non-debt tax shields (NDTS)
Non-debt tax shields are an alternative for tax advantages of issuing debt. Companies with higher non-debt tax shields have lower debt [DeAngelo and
31
Masulis (1980) and Titman and Wessels (1988)]. We use depreciation and amortizations divided by total assets as a proxy for non-debt tax shields as in Silva and Pinto (2018).
3.3.8. Investment opportunity (Invest)
Following Bevan and Danbolt (2000) and Pandey (2001), we use market to book value of total assets as a proxy for investment opportunities. Myers (1977) stresses that firms with large quantities of investment opportunities will have a lower debt ratio.
32
4. Main Results
In this chapter we present both the univariate and the regression analyses.
4.1.
Univariate analysis
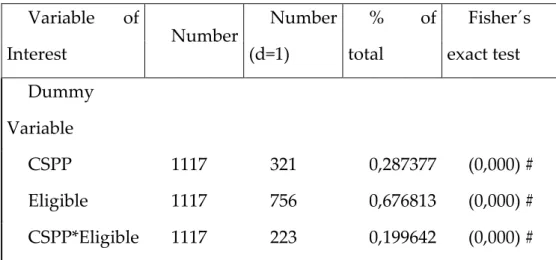
Table 2 and Table 3, present the descriptive statistics for the dependent variable Leverage (Lev) and for the independent variables CSPP, CSPP*Eligible, Taxes, Tang, Profit, Growth, Size, Risk, NDTS and Invest. Also, it presents Wilcoxon tests for discrete variables and Fisher´s exact test for dummies variables.
The mean effective tax rate increased from 32.23% to 44.86%, while the median decreased from 28.05% to 26.19%. Also, we verify that the mean tangibility has a very low decrease from 26.45% to 25.55%, the median tangibility maintains around 23%, we can say the same from the mean and median of the profitability, which means that the CSPP do not interfere with the profitability of firms. We confirm that growth opportunity upholds stable with the introduction of this program. We note that there was a slightly increase in the firms size from 16.06 to 16.30. We also conclude that the mean (median) risk decrease from 0.3333 (0.3025) to 0.2928 (0.2372). While the non-debt tax shield remained stable there has been an increase in the investment opportunity after the implementation of the CSPP.
4.2.
Regression analysis
To answer our research question, we perform an OLS regression. Our model is the following:
𝐿𝑒𝑣𝑖𝑡 = 𝛽0+ 𝛽1𝐶𝑆𝑃𝑃𝑡+ 𝛽2𝐶𝑆𝑃𝑃𝑡∗ 𝐸𝑙𝑖𝑔𝑖𝑏𝑙𝑒𝑖 + 𝛽3 𝑇𝑎𝑥𝑒𝑠𝑖𝑡+ 𝛽4𝑇𝑎𝑛𝑔𝑖𝑡+ 𝛽5𝑃𝑟𝑜𝑓𝑖𝑡𝑖𝑡 + 𝛽6𝐺𝑟𝑜𝑤𝑡ℎ𝑖𝑡+ 𝛽7𝑆𝑖𝑧𝑒𝑖𝑡+ 𝛽8𝑅𝑖𝑠𝑘𝑖𝑡+ 𝛽9𝑁𝐷𝑇𝑆𝑖𝑡+ 𝛽10𝐼𝑛𝑣𝑒𝑠𝑡𝑖𝑡+ 𝜀𝑖𝑡
33
We will provide the estimation of coefficients for three different set: (i) it will research the full database provided from 2009-2018; (ii) it will be research the data from before 2016, which is before the CSPP implementation and (iii) it will research the dataset from after 2016 (after the implementation of CSPP).
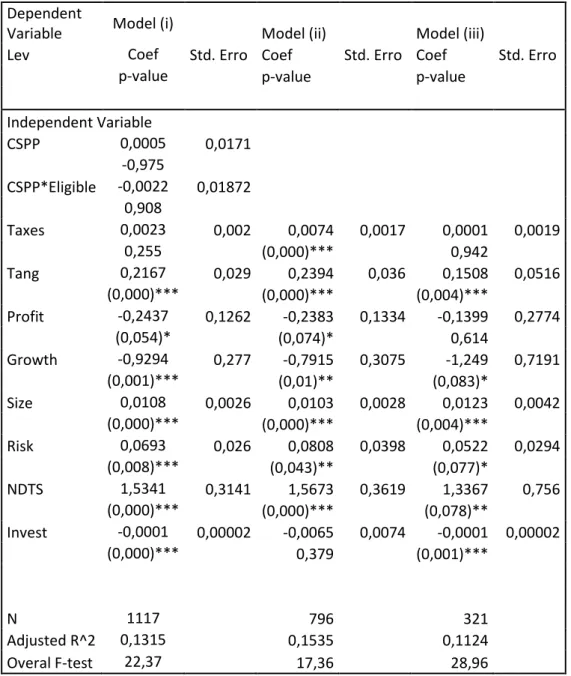
In the following table, Table 1, it will be shown the results obtain from the OLS regression of euro-area public firms for the 2009-2018 period. Our sample consists of 1117 results. For each independent variable we provide the coefficient, p-value and standard error. We use robust. *, ** and *** denote statistical significance at the 10%, 5%, 1% levels, respectively.
Dependent
Variable Model (i) Model (ii) Model (iii)
Lev Coef Std. Erro Coef Std. Erro Coef Std. Erro
p-value p-value p-value
Independent Variable CSPP 0,0005 0,0171 -0,975 CSPP*Eligible -0,0022 0,01872 0,908 Taxes 0,0023 0,002 0,0074 0,0017 0,0001 0,0019 0,255 (0,000)*** 0,942 Tang 0,2167 0,029 0,2394 0,036 0,1508 0,0516 (0,000)*** (0,000)*** (0,004)*** Profit -0,2437 0,1262 -0,2383 0,1334 -0,1399 0,2774 (0,054)* (0,074)* 0,614 Growth -0,9294 0,277 -0,7915 0,3075 -1,249 0,7191 (0,001)*** (0,01)** (0,083)* Size 0,0108 0,0026 0,0103 0,0028 0,0123 0,0042 (0,000)*** (0,000)*** (0,004)*** Risk 0,0693 0,026 0,0808 0,0398 0,0522 0,0294 (0,008)*** (0,043)** (0,077)* NDTS 1,5341 0,3141 1,5673 0,3619 1,3367 0,756 (0,000)*** (0,000)*** (0,078)** Invest -0,0001 0,00002 -0,0065 0,0074 -0,0001 0,00002 (0,000)*** 0,379 (0,001)*** N 1117 796 321 Adjusted R^2 0,1315 0,1535 0,1124 Overal F-test 22,37 17,36 28,96
34
Next, we interpret the results obtained and compare them to the expected result from the extant literature.
Abidi and Miquel-Flores (2018), Arce et al. (2017), and Grosse-Rueschkamp et al. (2018) find that the CSPP and CSPP*Eligible should be statistically significance. However our results indicate that they are not. One of the reason might be that their model used quarterly data while we use annual data.
Contrary to what is pointed out by DeAngelo and Masulis (1980), Kraus and Litzenberger (1973), and Miller (1977), which predicts taxes have a positive impact on leverage, we find an insignificance relationship between these two variables..
In line with Frank and Goyal (2007), Harris and Raviv (1991), Myers (1977), and Scott (1977) we find that tangibility have a negative relationship with leverage.
We find that profitability have a negative relationship with leverage, as predicted by extant literature [Fama and French (2002); Frank and Goyal (2007), Harris and Raviv (1991), Jensen (1986), and Myers and Majluf (1984)].
Our data allows us to conclude that growth opportunity is negatively correlated with leverage, this goes in accordance with trade-off theory that says that firms with high growth potential reinvest its gains to expand and don’t waste money with organizational inefficiencies Fama and French (2002).
On one hand, following static trade-off theory large firms tend to have higher levels of debt, on the other hand, following pecking-order theory larger firms tend to have less debt than smaller firms Frank and Goyal (2007) and Harris and Raviv (1991). We find that size has a positive relationship with leverage, which goes in favor of static trade-off theory.
Frank and Goyal (2007) and Myers (1984) defends that risk has a negative relationship with leverage according to static trade-off theory, however,
35
according to pecking-order theory affirms that risk has a positive relationship with leverage. Our data indicates that risk has a positive impact on leverage.
Literature review of DeAngelo and Masulis (1980) and Titman and Wessels (1988) defends that non-debt tax shields have a negative impact on leverage. However, our data shows that non-debt tax shields have a positive impact on leverage.
Finally, according to Myers (1977) and Titman and Wessels (1988) investment opportunity have a negative impact on leverage. Our results defend that investment opportunity has, indeed, a negative impact on leverage, but its impact it nearly zero.
36
5. Conclusion
This thesis analyses whether Quantitative easing programs have an impact on firms´ capital structure. Prior to this study, literature review around this specific topic is scarce. We, thus, intend to fill this gap in the literature.
QE programs were used as a response to the recent financial crisis which created a lack of liquidity in the overall economy. Its effects are felt in both the short-term and in the long-term.
This study aggregates 129 companies from the euro area and analyses data from 2009 to 2018. Some of the information was either not completed on Thomson Reuters or it didn’t exist at all, so to overcome this, we had to gather information from other sources, specially their annual report and do a cross-section of information to obtain a more complete database. Since, the credit rating was not available at our Thomson Reuters database, we had to obtain each of the public company’s annual report.
This work intends to contribute to the available literature about QE and capital structure in multiple ways. First, we review the literature on monetary policies, focusing on both conventional and unconventional monetary policies. Conventional monetary policy are the direct interference of the short term interest rate Friedman (1968). As pointed out by De Fiore and Tristani (2018), unconventional monetary policy takes a different approach and tries to create credit easing.
After, we describe the different implementation of the QE around the world, in specific, the programs implemented by Fed, ECB and BOE. The Fed implemented the LSAP, the ECB implemented the APP and the BOE implemented the APF. These programs intended to increase the central banks’ lending to the banks and a decrease the overall interest rate. With lower cost of
37
borrowing and a more aggressive purchases program there would increase the economy wealth. With that, it should be expected an increase of spending and income that would result the inflation to achieve 2%, which is the one of the goals of the mentioned central banks.
As stated before, capital structure is one of the most reviewed topics in the literature of corporate finance. We had to find the most prominent determinants that influence the financial decision of companies. We chose the following determinants: (i) taxes; (ii) tangibility; (iii) profitability; (iv) growth opportunity; (v) firm size; (vi) risk; (vii) non-debt tax shields; (viii) investment opportunity. To measure the QE we introduced a dummy (CSPP) to quantify if the leverage changed after the introduction of the program. Another variable was introduced, the CSPP*Eligible, this dummy quantified the impacted of the companies that were eligible for the CSPP had on its leverage ratio.
Our results indicate that the impact of both variables CSPP and CSPP*Eligible – measures for the impact of the Corporate Sector Purchase Programme – on capital structure is insignificant. Similar results were obtain for Taxes variable. According to our results, tangibility, firm size, risk and non-debt tax shields have a positive relationship to the leverage ratio. On the contrary, profitability and growth opportunities have a negative impact on firms´ leverage.
Our data has mixed results when compared with the most prominent capital structure theories: on the one hand, we verify a negative impact of growth opportunities and firm size on leverage, which is in line with the static trade-off theory; on the other hand, in line with pecking-order theory, we find a positive impact of risk on leverage.
A possible future research could be an analysis of this study but applied to other regions where a similar QE programs were implemented, also we could analyze the impact of the CSPP on European equity market.
38
6. References
Abidi, N., & Miquel-Flores, I. (2018). Working Paper Series Who benefits from the
corporate QE? A regression discontinuity design approach.
Acharya, V. V, Eisert, T., Eufinger, C., Hirsch, C., Agarwal, S., Begley, T., … Vissing-Jorgensen, A. (2016). Measurement and Mitigation.
Altavilla, C., & Giannone, D. (2016). Working Paper Series The effectiveness of
non-standard monetary policy measures: evidence from survey data.
Andrade, P., Breckenfelder, J., Fiore, F. De, Karadi, P., & Tristani, O. (2016). Working
Paper Series The ECB’s asset purchase programme: an early assessment Discussion Papers.
Arce, O., Gimeno, R., & Mayordomo, S. (2017). Making room for the needy: The effects
of the Eurosystem’s Corporate Sector Purchase Programme on Spanish firms*.
Balaceanu, C., & Dragne, L. (2014). Theories and Monetary Policy. International
Journal of Academic Research in Economics and Management Sciences, 3(2), 303.
Beirne, J., Dalitz, L., Ejsing, J., Grothe, M., Manganelli, S., Monar, F., … Vong, T. (2011). O cc a s i O n a l Pa Pe r s e r i e s n O 1 2 2 / ja n ua ry 2 011 The imPacT
Of The eurOsysTem’s cOvered bOnd Purchase PrOgramme On The Primary and secOndary markeTs.
Benhabib, J., Schmitt-Grohé, S., & Uribe, M. (2001). Monetary Policy and Multiple
Equilibria.
Bernanke, B. S., & Reinhart, V. R. (2004). Conducting Monetary Policy at Very Low
Short-Term Interest Rates.
Berry, S., Benfor, J., & Robson, M. (2009). Bank of England Quarterly Bulletin 2009 Q2. Bevan, A. A., & Danbolt, J. (2000). CAPITAL STRUCTURE AND ITS DETERMINANTS
IN THE UNITED KINGDOM A DECOMPOSITIONAL ANALYSIS Capital Structure and its Determinants in the UK-A Decompositional Analysis CAPITAL STRUCTURE AND ITS DETERMINANTS IN THE UK-A DECOMPOSITIONAL ANALYSIS.
Bhattarai, S., Eggertsson, G. B., Gafarov, B., & State, P. (2014). Time Consistency and
the Duration of Government Debt: A Signalling Theory of Quantitative Easing.
Castelnuovo, E., Nicoletti-Altimari, S., & Rodríguez-Palenzuela, D. (2003). E U R O P
E A N C E N T R A L B A N K DEFINITION OF PRICE STABILITY, RANGE AND POINT INFLATION TARGETS: THE ANCHORING OF LONG-TERM INFLATION EXPECTATIONS.
Chang, K.-P. (2015). A Reconsideration of the Modigliani-Miller Propositions.
Christensen, J. H. E., & Krogstrup, S. (2018). Federal Reserve Bank of San Francisco Working Paper, 2016–2028.
39
and U.K. Quantitative Easing The Response of Interest Rates to.
Christensen, J. H. E., & Rudebusch, G. D. (2012b). THE RESPONSE OF INTEREST RATES TO US AND UK QUANTITATIVE EASING. Source: The Economic
Journal, 122, 385–414.
Claeys, G., Leandro, Á., & Mandra, A. (2015). EUROPEAN CENTRAL BANK
QUANTITATIVE EASING: THE DETAILED MANUAL.
Clarida, R., Galí, J., & Gertler, M. (1999). The Science of Monetary Policy: A New
Keynesian Perspective. Journal of Economic Literature (Vol. XXXVII).
Cochrane, J. H. (2014). Monetary Policy with Interest on Reserves.
Coenen, G., Ehrmann, M., Gaballo, G., Hoffmann, P., Nakov, A., Nardelli, S., … Strasser, G. (2017). Working Paper Series Communication of monetary policy in
unconventional times.
Cúrdia, V., & Woodford, M. (2009). Federal Reserve Bank of New York Staff Reports
Conventional and Unconventional Monetary Policy.
De Fiore, F., & Tristani, O. (2018). Working Paper Series (Un)conventional policy and
the effective lower bound.
DeAngelo, H., & Masulis, R. W. (1980). Optimal Capital Structure Under Corporate and Personal Taxation. Journal of Financial Economics, 8(1), 3–29.
Fama, E. F., & French, K. R. (2002). The Society for Financial Studies Testing Trade-Off
and Pecking Order Predictions about Dividends and Debt. Source: The Review of Financial Studies (Vol. 15).
Fawley, B. W., & Neely, C. J. (2013). Federal Reserve Bank of St. Louis REVIEW Four
Stories of Quantitative Easing.
Frank, M. Z., & Goyal, V. K. (2007). Capital Structure Decisions: Which Factors are
Reliably Important?
Friedman, M. (1968). THE ROLE OF MONETARY POLICY. Frydenberg, S. (2004). Theory of Capital Structure-A Review.
Fullwiler, S., & Wray, L. R. (2010). Quantitative Easing and Proposals for Reform of
Monetary Policy Operations.
Gagnon, J., Raskin, M., Remache, J., Sack, B., Ezer, M., Fleming, M., … Wright, J. (2010). Federal Reserve Bank of New York Staff Reports Large-Scale Asset
Purchases by the Federal Reserve: Did They Work? Large-Scale Asset Purchases by the Federal Reserve: Did They Work?
Gagnon, J., Raskin, M., Remache, J., Sack, B., Fleming, M., Forster, J., … Wright, J. (2011). The Financial Market Effects of the Federal Reserve’s Large-Scale Asset
Purchases.
Gagnon Joseph E, J. E. (1999). Quantitative Easing: An Underapprecciated Success. Galariotis, E., Makrichoriti, P., & Spyrou, S. (2017). The Impact of Conventional and
Unconventional Monetary Policy on Expectations and Sentiment.
Gertler, M., & Karadi, P. (2011). A model of unconventional monetary policy.
40
Critique Modigliani and Miller on Capital Structure: A Post Keynesian Critique.
Graham, J. R., & Harvey, C. R. (1999). The theory and practice of corporate finance:
Evidence from the field 1.
Grosse-Rueschkamp, B., Steffen, S., Streitz, D., Acharya, V., Ahnert, T., Andrade, P., … Welch, I. (2018). A Capital Structure Channel of Monetary Policy.
Gurkaynak, R. S., Sack, B., & Swanson, E. (2005). The Sensitivity of Long-Term Interest
Rates to Economic News: Evidence and Implications for Macroeconomic Models.
Harris, M., & Raviv, A. (1991). The Theory of Capital Structure. The Journal of Finance (Vol. 46).
Hellwig, M. (2014). Financial Stability, Monetary Policy, Banking Supervision, and
Central Banking.
Huang, S. G. H., & Song, F. M. (2002). The Determinants of Capital Structure: Evidence
from China.
Hudson, M. (2010). US “Quantitative Easing” is Fracturing the Global Economy. SSRN. Issing, O. (2002). Should We Have Faith in Central Banks?
Jensen, M. C. (1986). Agency Costs of Free Cash Flow, Corporate Finance, and
Takeovers.
Johnson, K., Small, D., & Tryon, R. (1999). Board of Governors of the Federal Reserve
System International Finance Discussion Papers Number 641 MONETARY POLICY AND PRICE STABILITY MONETARY POLICY AND PRICE STABILITY.
Joyce, Michael; Tong, Matthew; Woods, R. (2011). Transmission channels for asset
purchases How do asset purchases affect spending and inflation?
Joyce, M. A. S., Lasaosa, A., Stevens, I., & Tong, M. (2011). The Financial Market
Impact of Quantitative Easing in the United Kingdom The Financial Market Impact of Quantitative Easing in the United Kingdom *. Article in International Journal of Central Banking.
Joyce, M., Miles, D., Scott, A., & Vayanos, D. (2012a). QUANTITATIVE EASING AND UNCONVENTIONAL MONETARY POLICY-AN INTRODUCTION. Joyce, M., Miles, D., Scott, A., & Vayanos, D. (2012b). QUANTITATIVE EASING
AND UNCONVENTIONAL MONETARY POLICY-AN INTRODUCTION.
Source: The Economic Journal, 122, 271–288.
Koetter, M., Roszbach, K., Spagnolo, G., Allen, F., Bergman, M., Dewatripont, M., … Rocci, R. (2012). Financial stability and Central Bank Governance.
Koijen, R. S. J., Koulischer, F., Nguyen, B., & Yogo, M. (2018). Inspecting the
Mechanism of Quantitative Easing in the Euro Area.
Kraus, A., & Litzenberger, R. H. (1973). American Finance Association A
State-Preference Model of Optimal Financial Leverage. Source: The Journal of Finance
(Vol. 28).
Krishnamurthy, A., Nagel, S., & Vissing-Jorgensen, A. (2017). ECB Policies Involving
Government Bond Purchases: Impact and Channels.
41
on Interest Rates.
Ledenyov, D. O., & Ledenyov, V. O. (2013). To the problem of turbulence in quantitative
easing transmi ssion channels and trans actions networ k chan nels at qu antitative easing policy implementation b y central ban ks.
Lenza, M., Pill, H., & Reichlin, L. (2016). Wo r k i n g Pa Pe r S e r i e S n o 1 2 5 3 / o
c to b e r 2 0 1 0 Monetary Policy in excePtional tiMeS.
Luck, S., Zimmermann, T., Arseneau, D., Berrospide, J., Bhutta, N., Byrne, D., … Zakrasjek, E. (2018). Employment effects of unconventional monetary policy:
Evidence from QE Federal Reserve Bank of New York.
Maggio, M. Di, Kermani, A., Palmer, C., Heider, F., Kashyap, A., Lucas, D., … Willen, P. (2016). How Quantitative Easing Works: Evidence on the Refinancing Channel. Micossi, S. (2015). The Monetary Policy of the European Central Bank (2002-2015). Miglo, A. (2010). The Pecking Order, Trade-off, Signaling, and Market-Timing Theories
of Capital Structure: a Review.
Miller, M. H. (1977). American Finance Association. Source: The Journal of Finance (Vol. 32).
Modigliani, F., & Miller, M. H. (1958). American Economic Association. Source: The
American Economic Review (Vol. 48).
Myers, S. C. (1977). DETERMINANTS OF CORPORATE BORROWING. Journal of
Financial Economics (Vol. 5). North-Holland Publishing Company.
Myers, S. C. (1984). The Capital Structure Puzzle. The Journal of Finance (Vol. 39). Myers, S. C., & Majluf, N. S. (1984). CORPORATE FINANCING AND INVESTMENT
DECISIONS WHEN FIRMS HAVE INFORMATION THAT INVESTORS DO NOT HAVE*. Journal of Financial Economics (Vol. 13).
Orphanides, A. (2017). MIT Sloan School of Management Central Bank Policies and the
Debt Trap Athanasios Orphanides* MIT.
Pandey, I. M. (2001). CAPIAL STRUCTURE AND THE FIRM CHARACTERISTICS:
EVIDENCE FROM AN EMERGING MARKET.
Pinto, J. M., & Correia, M. C. (2017). ARE COVERED BONDS DIFFERENT FROM
ASSET SECURITIZATION BONDS? Are Covered Bonds Different from Asset Securitization Bonds? Are Covered Bonds Different from Asset Securitization Bonds?
Rodnyansky, A., Darmouni, O., Aguiar, M., Bigio, S., Brunnermeier, M., Far-Boodi, M., … Xiong, W. (2017). The Effects of Quantitative Easing on Bank Lending Behavior. Rosa, C. (2012). How “Unconventional” Are Large-Scale Asset Purchases? The Impact
of Monetary Policy on Asset Prices.
Scott, J. H. (1977). American Finance Association Bankruptcy, Secured Debt, and
Optimal Capital Structure. Source: The Journal of Finance (Vol. 32).
Silva, C. S., & Pinto, J. M. (2018). A Comparative Analysis of Firms’ Financing
Decisions in Export and Non-Export Sectors: Evidence from Portugal.
42
Lowered Market Borrowing Costs for Banks and Governments?
Titman, S., & Wessels, R. (1988). The Determinants of Capital Structure Choice. Source:
The Journal of Finance (Vol. 43).
Van Binsbergen, J. H., Diamond, W. F., Grotteria, M., Berk, J., Du, W., Glode, V., … Wright, J. (2019). Risk Free Interest Rates.
White, W. R. (2006). Is price stability enough? Monetary and Economic Department. Williams, J. C. (2011). Unconventional Monetary Policy: Lessons from the Past Three
43
7. Appendix
Variable
Complete Database Before 2016 After 2016 Wilcoxon
test
Obs. Mean Median Obs. Mean Median Obs. Mean Median
Lev 1117 0,2725 0,2495 796 0,2734 0,2497 321 0,27 1 0,9101 Taxes 1117 0,3586 0,2723 796 0,3223 0,2805 321 0,4486 0,2312 0,0063 * Tang 1117 0,2619 0,2324 796 0,2645 0,2365 321 0,2555 0,1033 0,2959 Profit 1117 0,1155 0,1063 796 0,1165 0,1073 321 0,1128 0,034 0,4078 Growth 1117 0,0423 0,034 796 0,0433 0,0348 321 0,0399 16,8656 0,3223 Size 1117 16,1261 16,6342 796 16,0565 16,4822 321 16,2989 0,2372 0,0432** Risk 1117 0,3216 0,2813 796 0,3333 0,3025 321 0,2928 0,2372 0,000 *** NDTS 1117 0,04 0,036 796 0,0404 0,0361 321 0,0376 0,0336 0,087* Invest 1117 3,2104 1,78 796 2,0032 1,68 321 6,2038 2,04 0,0003 ***
44 Variable of Interest Number Number (d=1) % of total Fisher´s exact test Dummy Variable CSPP 1117 321 0,287377 (0,000) # Eligible 1117 756 0,676813 (0,000) # CSPP*Eligible 1117 223 0,199642 (0,000) #