Capital structure: the role of the funding sources on which Brazilian
listed companies are based
Wilson Tarantin Junior
Universidade de São Paulo, Faculdade de Economia, Administração e Contabilidade de Ribeirão Preto, Departamento de Contabilidade, Ribeirão Preto, SP, Brasil
Maurício Ribeiro do Valle
Universidade de São Paulo, Faculdade de Economia, Administração e Contabilidade de Ribeirão Preto, Departamento de Contabilidade, Ribeirão Preto, SP, Brasil
Received on 11.22.2013 – Desk acceptance on 12.09.2013 – 4th version approved on 03.18. 2015
ABSTRACT
This study evaluated the capital structure of Brazilian listed companies, within the period from 2005 to 2012, verifying the role of the funding sources on which such companies are based. To do this, the debt ratio in 3 different sources was evaluated: financial institutions, capital market, and sources with subsidized interest rates, the latter representing an institutional factor of the Brazilian economy. A sam-ple of 95 companies was used, out of the 150 largest companies listed on the São Paulo Securities, Commodities, and Futures Exchange (BM&FBOVESPA). By using models with panel data, the results show that the funding sources impact on the companies’ capital structure formation, influencing both in leverage and in debts maturity. Regarding leverage, companies that have a higher proportion of their funds raised in the capital market are more leveraged. The same is not true for companies that have a higher proportion of subsidized resources. Regarding debts maturity, resources of different maturities are obtained from different sources: the resources of lower maturities are ob-tained from financial institutions and the resources of higher maturities are obob-tained from the capital market and sources with subsidized interest rates – i.e. the Brazilian National Bank for Economic and Social Development (BNDES). Comparing the resources from the capital market to subsidized resources, it is concluded that the former have higher maturity. Such a result may be explained by the growth of the Brazilian capital market in recent years, since 2009, so that companies have been based on the capital market for their funding with higher maturity and on subsidized resources, from BNDES, for their funding with intermediate maturities.
Keywords: capital structure, funding sources, institutional factors, BNDES.
1 INTRODUCTION
as firm profitability and firm size” (Rajan & Zingales, 1995, p. 1422).
In Brazil, there is an institutional factor closely re-lated to the issue of supply of resources: capital sour-ces with interest rates subsidized by government agen-cies, such as the Brazilian National Bank for Economic and Social Development (BNDES). Valle and Albanez (2012, p. 68) emphasize that in the Brazilian case the differential sources are:
[...] the synthesis of the institutional element and resource supply with regard to the solution that the country and its institutions found to counteract the high interest rate level. If, on the one hand, the country conditions were a burden, on the other hand, its institutions withstood such a load.
Faced with evidence of the importance of issues re-lated to resource availability and institutional factors in the companies’ capital structure formation, this study aims to verify how the funding sources, on which the companies are based, explain the capital structure of Brazilian listed companies. To do this, we will analyze how proportions of loans raised from the financial ins-titutions, sources with subsidized interest rates, the lat-ter representing a Brazilian institutional factor, and the capital market may be relevant factors for explaining leverage and their debts maturity.
Capital structure studies with Brazilian companies evaluated them in in order to verify the impact of the cha-racteristics of these companies on leverage and debt ma-turity (Albanez & Valle, 2009; Bastos & Nakamura, 2009; Terra, 2009; Nakamura, Jucá & Bastos, 2011; Correa, Basso & Nakamura, 2013). Companies were evaluated by incorporating institutional issues (Bastos, Nakamura & Basso, 2009; Albanez, Valle & Corrar, 2012; Bogéa Sobri-nho, Sheng & Lora, 2012) and issues related to providers (Valle & Albanez, 2012; Póvoa & Nakamura, 2014).
Given the context of studying the Brazilian compa-nies’ capital structure, this article hopes to contribute by evaluating jointly the role of the subsidized resources and the resources from the capital market to form the capital structure of these companies. It is understood that this is still a gap to be addressed by the national literature and that the analysis period, as discussed be-low, favors such an examination.
Therefore, in order to delimit the study, the focus herein is not merely addressing the capital structure in Brazil, but rather evaluating how the Brazilian institu-tional issue pointed out, along with other funding sour-ces, highlighting the capital market, may be relevant when explained.
Modigliani and Miller (1958; 1963) are the initial refe-rences to a large part of the studies that try to explain which are the determinants of companies’ capital structure. he initial argument that the funding mode does not matter, i.e. it does not determine company’s value, and the subsequent observation of the opposite, motivated the emergence of theories that have used elements of business reality to ex-plore factors that might explain irms’ funding.
“Nevertheless, financing clearly can matter. The chief reasons why it matters include taxes, differences in in-formation and agency costs.” (Myers, 2001, pp. 81-82). The reasons given by Myers (2001) are the bases of theo-ries such as, for instance, trade-off, pecking order (Myers & Majluf, 1984), and free cash flow (Jensen, 1986).
Thus, empirically, scholars sought to explain the companies’ funding structure primarily through their characteristics, such as size, profitability, tangibility, growth opportunities, risk, among others. Therefore, it was sought to verify which of these attributes were re-lated to greater or lesser indebtedness or debts maturity (Titman & Wessels, 1988; Barclay & Smith Jr., 1995).
Such empirical analyzes have been expanded, and they started to explicitly consider how factors alien to the company could be a relevant determinant of capi-tal structure. Thus, not only the companies’ attributes would be responsible for their capital structure, and they came to be regarded as representative factors of the firms’ demand for capital (Faulkender & Petersen, 2006), but also issues related to resources’ providers and the institutional factors inherent to each economy.
Evaluating how the supply of resources impacts the firms’ capital structure means verifying how the capital providers, such as financial institutions and the capital market, can exert influence on their capital structure. Thus, we seek to grasp which kinds of resources are offered in each market and which companies obtain their resources in each market (Faulkender & Petersen, 2006; Leary, 2009). When institutional factors are evaluated, the focus of analysis lies on checking how diferences in the institutional training of countries can influence the funding structure of firms operating in each economy (Rajan & Zingales, 1995; Demirgüç-Kunt & Maksimovic, 1999; Booth, Varouj, Demirgüç-Kunt & Maksimovic, 2001; Fan, Titman & Twite, 2012).
A means by which the environment alien to the com-panies can exert influence on the firms’ capital structure consists in the providers of resources. Diamond (1991b) and Rajan (1992) make available a theoretical analysis of the circumstances in which firms obtain their resour-ces in the capital market or from financial institutions. The analyses are based on asymmetric information and agency problems derived from this asymmetry. The ar-gument focuses on the fact that financial institutions collect private information about firms more effectively than capital market agents. The latter have access only to publicly available information, in turn, financial ins-titutions, besides them, also collect information in their monitoring activity, as a way to alleviate moral hazard in their relationship with the company.
Diamond (1991b) argues that the reputation a firm builds over time, i.e. a reputation as a ‘good payer,’ re-places the need for monitoring. So, initially, firms raise funds through banks, and, later, when this reputation is built, raise them in the capital market. At this point, the firm has a high quality credit, which leads to lower cost of capital. Rajan (1992) argues that the information su-periority of financial institutions may be used in a firm’s reorganization function, preventing managers to engage in projects that do not add value. In turn, capital market agents have no control over managers/owners’ decisions.
Empirically, Faulkender and Petersen (2006) point out that, when explaining the companies’ capital struc-ture only through its characteristics, it is implicitly as-sumed that the firm’s leverage is quite a function of the firm’s debt demand. The authors claim that, in determi-ning leverage, it is worth evaluating issues related to the restrictions that firms have to obtain resources, incor-porating the supply perspective.
To address the issue, Faulkender and Petersen (2006) analyze the access to funding sources by establishing differences between companies that had access to the capital market and those that did not have, the latter group representing the companies excluded from this kind of market due to a lenders’ option. They conclude that, even controlling by means of the firms’ characte-ristics, i.e. through attributes that represent their de-mand for debts, firms with access to the capital market were significantly more leveraged than those without such an access, corroborating the hypothesis proposed.
Leary (2009), in his analysis of how firms change their funding sources due to expansion and contrac-tion in the availability of bank funds, shows that, when evaluating the movements between bank and non-bank debts after expanding the resources provided by banks, there is a pronounced increase in the use of bank re-sources by smaller firms, when compared to large firms. When there is a contraction in the availability of bank resources, there is a relative decline in the use of bank
resources by smaller firms (Leary, 2009, p. 1170). Thus, the proportion of bank debts increases (decreases) for firms which are dependent on banks, when compared to firms with access to the capital market, after an expan-sion (contraction) in their availability.
Barclay and Smith Jr. (1995) state that issuing a debt in the capital market has a high fixed cost, and this fact generates economies of scale. In this way, smaller com-panies, given the lesser chance to take advantage of eco-nomies of scale, might take loan through banks with lo-wer fixed costs, but also lolo-wer maturity than the capital market.
Rauh and Sufi (2010) go beyond the distinction between debt in the capital market and bank debt. In their study, the authors secrete the companies’ debts ac-cording to their kind, their priority, and their source. They have found that firms use simultaneously diffe-rent debts, depending on the attributes mentioned in their capital structure. Furthermore, they observe that, although firms do not change their total debt (leverage) often, they adjust their capital structure by changing the composition of their debts.
Thus, Rauh and Sufi (2010) show that even the most obvious correlations of leverage to the firms’ characte-ristics change when considering the heterogeneity in debts composition. They argue that this could be explai-ned by the differences in debts in relation to the prio-rity of the firm’s cash flows, the asymmetric informa-tion between investors and managers, and issues related to managerial incentives (Rauh & Sufi, 2010, p. 4255). Thus, the authors stress the significance of taking such heterogeneity into account in debts composition.
A second way through which the environment can influence the firms’ capital structure consists in insti-tutional issues. Booth et al. (2001), by analyzing com-panies’ debt in developed and developing countries, observe the firms’ characteristics that affect their in-debtedness in developed countries are also significant in developing countries. However, they conclude that factors specific to each country are as important as the variables representing the firm’s attributes to explain variations in total and long-term indebtedness of the companies analyzed.
Demirgüç-Kunt and Maksimovic (1999, p. 304), by evaluating how institutional diferences between tries afect the debts maturity of companies in 30 coun-tries (developed and developing), recognize that “Go-vernment subsidies afect inancial structure decisions because implicit or explicit backing of corporations by the government may distort market incentives and permits some irms to obtain long-term loans on favorable terms.”
sources is that they have subsidized interest rates. “Over many decades, BNDES, in practice, was the only natio-nal institution that provided long-term funds to finance industry and infrastructure” (Giambiagi, Leal, Moreira & Faveret Filho, 2009, p. 274). Lazzarini, Musacchio, Bandeira-de-Melo and Marcon (2012, p. 3) report that, in 2010, BNDES’ loans accounted for 21% of the total credit provided to the private sector and much of the long-term credit.
It is worth highlighting an issue that relates the subsidized loans to the capital market. Lazzarini et al. (2012, p. 2) argue that “without systematic micro-level evidence, we do not know whether development bank loans actually accomplish their objectives and what cri-teria they use to select their borrowers.”
The issue is straightforward: subsidized loans may create distortions in the credit market as they charge
rates below the usual market. In a context like this, the development of the Brazilian capital market may be im-paired. “We do not, however, have information to mea-sure other positive impacts these loans and investments may be generating or the distortions that subsidized lo-ans generate in 28 the credit market” (Lazzarini et al., 2012, p. 27).
Through works that emphasize the role of supply (Faulkender & Petersen, 2006), institutional issues (Ra-jan & Zingales, 1995; Booth et al., 2001), and the re-sources at subsidized interest rates (Demirgüç-Kunt & Maksimovic, 1999; Giambiagi et al., 2009; Valle & Al-banez, 2012; Lazzarini et al., 2012) in the capital struc-ture formation, this article examines how the funding sources on which Brazilian listed companies are based, also a Brazilian institutional factor, may be relevant in shaping the structure of these companies.
3 RESEARCH METHOD
3.1 Sample
he sample of this study consists in 95 Brazilian listed companies. For selection, irst we compiled a list of compa-nies with shares traded on the BM&FBOVESPA, informa-tion available in the sotware Economática and in the active record in the Brazilian Securities and Exchange Commis-sion (CVM), in 2012.
First, companies in the ‘inancial and others’ sector were excluded. hen, we excluded companies from the sectors of electricity, water and sewage, gas, and telephone, according to the classiication of the BM&FBOVESPA. he exclusion of these companies is justiied by the fact that this study seeks to evaluate, among others, resources subsidized by government agencies, and taking into account the charac-teristic of the services provided, there might be a bias when studying such companies along with the others, due to a possible diferential access of these companies to these re-sources. Ater these exclusions, the 150 largest companies in terms of total book assets for the year 2012. Out of these, there remained 95 companies in the sample, mainly due to the insuicient information in the notes on the other.
he sample covers the years from 2005 to 2012. he choice is justiied because this is a period with conside-rable variations regarding the resources available, mainly resources from the capital market, given the enactment of Instruction CVM 476, on January 16, 2009. Based on the year 2009, a key year concerning the recent development of the Brazilian capital market, the sample period was selec-ted having the 4 most recent years as a reference, given the availability of companies’ annual inancial statements, and
the 4 years prior to 2009. Also, within this period, there was a considerable expansion of the annual disbursement of BNDES, in addition to the crisis of inancial institutions, in late 2008, a fact which may have triggered changes in the resources provided by such institutions.
3.2 Variables
3.2.1 Dependent variables.
he dependent variables in this study are representati-ve of the irms’ capital structure, i.e. the lerepresentati-verage and debt maturity.
Traditionally, a irm’s leverage represents the rela-tionship between its debts and its equity. However, accor-ding to Faulkender and Petersen (2006, p. 51), for measu-ring a irm’s leverage the ratio between its total debt and total assets will be used, although it is usual that this rela-tionship represents the irm’s total debt. he authors eva-luate irms’ leverage both in inancial terms and in market terms. Herein, total assets at market values will be calcula-ted according to Rajan and Zingales (1995).
In this study, ‘total debts’ are loans and funding, deben-tures and inancial market lease, current and noncurrent.
Current debts are those classified in the current lia-bilities in the financial statement; 2nd year represents debt payments that will occur within 2 years; 3rd year represents payments that will occur within 3 years; 4th year represents payments that will occur within 4 years; and 5th year represents payments that will occur within 5 years or more.
This classification is feasible, because notes in the companies’ financial statements provide information about the payment schedule of its debts. Debts classi-fied as non-current liabilities in the financial statement are, in the notes, dismembered according to their pay-ments in subsequent years. The sum of these paypay-ments is equal to the balance shown in the balance sheet.
Overall, companies segregate the annual payment flows of their debts up to “5 years or more,” from the financial statement date. In the absence of rather de-tailed information, debts maturing within “5 years or more” were weighted with the weight of 5 years in the calculation of weighted average term. Thus, the variable mid-term can vary from 1 to 5 years, so that, the closer to 5, the greater the maturity of companies’ debt.
It is recognized that the decision to determine the debt maturing within “5 years or more” by considering weight in 5 years may cause a bias towards underestima-ting the actual maturity of companies’ debts. However, the fact that the maturity measurement adopted here is closer to reality than that derived from the balance she-ets is significant, i.e. short and long-term debt (current and non-current, respectively), usually adopted in stu-dies on debts maturity.
3.2.2 Independent variables.
The independent variables used in this study are intended to explain the role of funding sources in the capital structure formation. To evaluate this influence, the strategy adopted was searching for the information related to debts in the companies’ notes that make up this study sample.
The notes provide detailed information on the com-panies’ funding. In general, there is a description of the way how these resources were raised or the kind of re-source raised, on the remuneration of the rere-source, and on the indexer used in the operation. Therefore, the ag-gregate values shown in the balance sheet are detailed, enabling the classification companies’ debt according to their provider.
The classification methodology of companies’ debt was based on Valle and Albanez (2012), who classified them into groups representing the currency in which the debt was raised (domestic or foreign) and the type of credit line (market line or differential line). Thus, they create 4 independent variables representing the amount of debts classified into each group in relation to total debts.
Leary (2009), in one of his studies, uses as the pendent variable the percentage of long-term bank de-bts in relation to total long-term dede-bts. Lazzarini et al.
(2012) evaluate the variable “percentage of loans from BNDES in relation to total debts.” These authors are ba-sed on the fact that the debt is indexed by the Brazilian Long-Term Interest Rate (TJLP) to identify when it is from BNDES. Valle and Albanez (2012) report that the “differential” indexers are the TJLP, the Reference Rate (TR), and others.
In this regard, 5 categories were created and, toge-ther, they account for the companies’ debt funding, na-mely: a) debt in the capital market; b) debt with finan-cial institutions; c) debt with subsidized interest rates; d) debt by financial leasing; and e) others.
Financial leasing was classified separately from lia-bilities to financial institutions, since not every lease is done by these institutions. The category ‘others’ was created, because there were some accounts in the notes that could not be classified in any of the categories, sin-ce the companies themselves classify values under the rubric ‘others.’
Supply variables are specified so that the amount of debts classified into each category is divided by the company’s total debts. Thus, the sum of the 5 catego-ries for each company, in each year, must be equal to 1 (100 %). The interpretation of these variables is that the higher (lower) the proportion of a certain debt in the company’s capital structure, more (less) it is based on the source of this debt for its funding.
It is believed that, specified this way, these variables have a higher information content than using proxies,as dummies, like in Faulkender and Petersen (2006), who use the fact that the company has or not the credit rating as a proxy for companies’ access to the capital market.
3.2.3 Control variables.
The control variables taken into account to represent companies’ demand for capital are: profitability, com-pany size, growth opportunities, and tangibility. These are the variables having the most robust results in pre-vious studies (Rajan & Zingales, 1995; Frank & Goyal, 2009). In addition to these, a variable representing the company’s credit risk will be added.
Firms’ profitability will be calculated by using the ratio between Earnings Before Interest, Taxes, Deprecia-tion, and Amortization (EBITDA) and the company’s total assets. EBITDA may be interpreted as a potential cash flow generation through the firm’s operations. If divided by total assets, there is an operating return form.
The representation of company size will be provided through the natural logarithm of net operating revenue. The market-to-book ratio will represent growth oppor-tunities. This is the ratio between assets’ market value and assets’ book value. The argument is that, although financial statements do not register growth opportuni-ties, the market, when evaluating the company, consi-ders these opportunities.
propor-tion of assets that can be used as guarantee when contrac-ting new debt. he proxy for credit risk will be the irm’s unlevered beta. It represents the company’s economic risk, i.e. its risk if not using debt in its capital structure.
3.3 Data Processing
In the processing of data, besides descriptive analyses, regression models with panel data will also be adopted. hus, Hsiao (2006) points out that one advantage in using panel data is that, in addition to providing more accurate inferences about the model parameters, they contain infor-mation that allows controlling the efects of omitted varia-bles, i.e. efects of variables the model lacks or variables that are not observed.
Also in line with Hsiao (2006, p. 9), the literature that uses panel data focuses on making inferences with struc-tural parameters as a basis, representing impacts of the variables observed on the dependent variable. However, such inferences are made ater controlling the impacts of incidental parameters, which represent the heterogeneity caused by omission of variables in the model.
Wooldridge (2006, p. 414) points out that it is possible to separate factors that are not observed, but having an impact on the dependent variables, in two types, the irst representing factors that are constant over time and the second represen-ting factors that vary over time. hus, factors not observed that are constant over time are portrayed by a variable in the model, representing the heterogeneity not observed. In turn, factors not observed that change over time are represented by an error term, which “is oten named idiosyncratic error or temporal variation error” (Wooldridge, 2006, p. 415).
Wooldridge (2006) states that 2 methods to estimate the models of efects not observed are the ixed efects estima-tor and the estimaestima-tor of random efects. he adequacy of estimators is based on the fact that the variable represen-ting the heterogeneity not observed is or is not correlated to the explanatory variables included in the model.
In a practical sense, Fávero (2013) states that it is crucial to characterize the database in a short or long panel, prior to the occurrence of modeling. A short panel occurs when the number of individuals is greater than the number of periods in the database. A long panel occurs in the opposite situation.
Fávero (2013) works out 6 models with diferent estima-tors, in the case of a short panel, such as the panel in this article: Pooled Ordinary Least Squares (POLS), with robust clustered standard errors, between estimator, ixed efects, ixed efects with robust clustered standard errors, random efects, and random efects with robust clustered standard errors.
Fávero (2013, p. 146) applies 3 tests to determine the models’ suitability: the Breusch-Pagan’s LM test, for the adequacy of the POLS model when compared to the ran-dom efects model; Chow’s F-test for the adequacy of the POLS model in relation to the ixed efects model; inally, Hausman’s test, for choosing between the ixed or random efects model.
he null hypothesis of the Breusch-Pagan’s LM test is homoscedasticity. hus, the rejection of the null hypothe-sis indicates that there is heteroscedasticity, leading to the adequacy of the random efects model, which uses more eicient estimators in this situation (Generalized Least Squares).
he null hypothesis of Chow’s F-test is that the inter-cepts are the same for all companies in the sample. Rejec-ting the null hypothesis indicates there is adequacy of the ixed efects model. Wooldridge (2006, p. 445) states that “using ixed efects is the same as allowing a diferent inter-cept for each observation.”
he null hypothesis in Hausman’s test is that the estima-tes obtained by the ixed efects models and random efects did not difer signiicantly. If there is a signiicant diferen-ce, i.e. if the null hypothesis is rejected, the ixed efects mo-del is appropriate.
4 ANALYSIS OF RESULTS
Table 1 shows the descriptive statistics of variables used in the study. The identification of ‘study 1’ points out that the study is conducted with variables calculated on market values and ‘study 2’ with variables calculated on book values.
The weighted average term was 2.52 years. Given that this variable may take, in this study, values from 1 to 5 years, the average value may be regarded as low. Evi-dence of the absence of long-term funding to Brazilian companies.
he variable crisis is a dummy with value 1 for the year 2009 and 0 for the others. Its function is verifying that the
crisis of inancial institutions, whose onset is usually in-dicated as the breakdown of the American bank Lehman Brothers, on September 15, 2008, caused changes to the capital structure of Brazilian listed companies. It is belie-ved that, if there is any impact on the capital structure, this is realized ater 2008, assuming the onset of the crisis might have been in the end of that year.
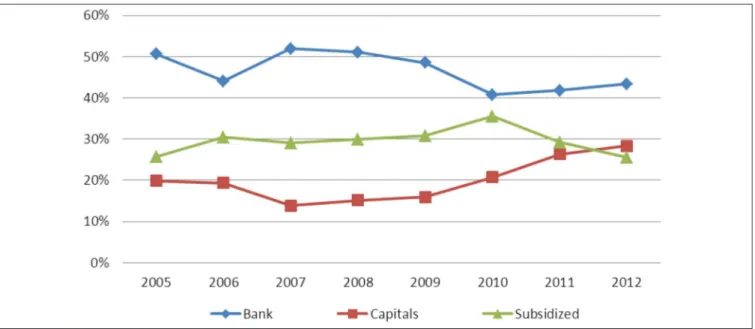
In relation to funding sources, we notice that the Bra-zilian listed companies still rely heavily on bank resources, with an average of 45.7% of the companies’ debts within the study period. In Figure 1 there is a considerable drop
in the share of banking resources in the years ater 2009. As it may be inferred based on this igure, this drop is a result of increased participation of capital and subsidized market funds, in the same year, in the irms’ capital structure.
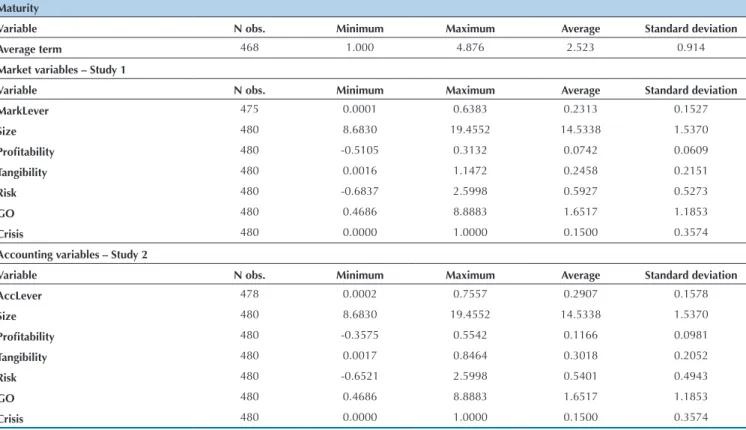
Maturity
Variable N obs. Minimum Maximum Average Standard deviation
Average term 468 1.000 4.876 2.523 0.914
Market variables – Study 1
Variable N obs. Minimum Maximum Average Standard deviation
MarkLever 475 0.0001 0.6383 0.2313 0.1527
Size 480 8.6830 19.4552 14.5338 1.5370
Proitability 480 -0.5105 0.3132 0.0742 0.0609
Tangibility 480 0.0016 1.1472 0.2458 0.2151
Risk 480 -0.6837 2.5998 0.5927 0.5273
GO 480 0.4686 8.8883 1.6517 1.1853
Crisis 480 0.0000 1.0000 0.1500 0.3574
Accounting variables – Study 2
Variable N obs. Minimum Maximum Average Standard deviation
AccLever 478 0.0002 0.7557 0.2907 0.1578
Size 480 8.6830 19.4552 14.5338 1.5370
Proitability 480 -0.3575 0.5542 0.1166 0.0981
Tangibility 480 0.0017 0.8464 0.3018 0.2052
Risk 480 -0.6521 2.5998 0.5401 0.4943
GO 480 0.4686 8.8883 1.6517 1.1853
Crisis 480 0.0000 1.0000 0.1500 0.3574
Notes: mid-term – weighted average term of debt payments; study 1 – variables in market terms; study 2 – variables in accounting terms; size – logarithm of net ope -rating revenues; profitability – EBITDA divided by total assets; tangibility – property divided by total assets; risk – unlevered beta; GO –growth opportunities measured by the ratio between assets’ market value and assets’ book value; 2009 crisis – dummy with value 1 in 2009 and 0 in the other years; N obs. – number of observations. The variables size, GO, and mid-term are not influenced by calculating on market value and book value, therefore, they have the same statistics for the 2 studies.
Table 1 Descriptive statistics
Funding sources
Variable N obs. Minimum Maximum Average Standard deviation
Bank 480 0.000 1.000 0.457 0.318
Capitals 480 0.000 0.998 0.208 0.262
Subs 480 0.000 1.000 0.298 0.289
Lease 480 0.000 0.963 0.019 0.088
Others 480 -0.036 0.575 0.017 0.062
Notes: bank – amount of debt on financial institutions divided by total debts; capital – amount of debt in the capital market divided by total debts; subs – amount of debt with subsidized interest rates divided by total debts; others – amount of debts classified as others divided by total debt; N obs. – number of observations.
The debt with subsidized interest rates is a relevant source of funds for the sampled companies, as it corres-ponds, on average, to 29.8% of the amount of corpora-te debts. Valle and Albanez (2012, p. 61) reporcorpora-ted that funds from differential lines ranged from 32% to 37% of the sampled companies’ funding, which covers the period from 1997 to 2006. Lazzarini et al. (2012, p. 13) report that firm mode of their sample has around 31% of its debt from BNDES.
The resources from the capital market represent, on average, 20.8% of the total debts, strongly influenced by the years after 2009. It is noteworthy that, in 2012, the proportion of capital market debts has exceeded the proportion of subsidized resources in firms’ capital structure, perhaps an unprecedented fact.
Financial leasing and debts classiied as ‘others’ toge-ther, represent, on average, only 3.6% of the amount of debts and, therefore, they are not expected to be relevant in order to explain leverage or maturity of corporate debt. For the variable ‘others,’ it is noticed that its minimum value is 3.6% negative. he negative value is justiied, be-cause some companies have classiied derivative inancial instruments, e.g. swaps, along with loans and funding.
Information in Figure 2 show that the changes in ow-nership of resources with subsidized interest rates and the capital market are motivated by the policies adopted by Brazilian economic agents. Figure 2 shows, in billion reais, the annual disbursement by BNDES to large com-panies and the amount issued in the primary market of debentures, excluding issuance by leasing companies. Source: Prepared by the authors.
Comparing the disbursement of BNDES to large companies to the proportion of subsidized debt, compa-nies seem to respond to the policy adopted by this bank, since both curves show similar trends. A justification is the fact that they are subsidized resources, i.e. resources at a cost below the market lines. Thus, an increase in su-pply of this kind of resource allows companies to finan-ce their new investments at lower costs or even enables companies to reduce their overall cost of capital.
In turn, information on the market of debentures provide evidence that may explain the reason for the rise in the share of capital market resources in recent years in the Brazilian listed companies’ capital structu-re. Companies now issue debentures, taking advantage of the enactment of Instruction CVM 476, on January 16, 2009, which provides for public offerings of securi-ties distributed with restricted efforts, prohibiting the public search for investors in this kind of issuance.
Based on Figure 2, still in 2009, only the amount is-sued under Instruction CVM 476/2009 was almost the same or greater than the total amount issued in each of the previous 3 years. In subsequent years, there is a clear increase in the amount issued under Instruction CVM
476/2009, accounting for much of the total number of debentures issued. Thus, we may infer, based on this information, that the enactment of Instruction CVM 476/2009 may have some participation in the recent de-velopment of the Brazilian capital market.
As observed on the CVM website: “the purpose of the CVM with the enactment of Instruction CVM 476/2009 is reducing the costs of public offerings, thus facilitating access of issuers to the capital market.”
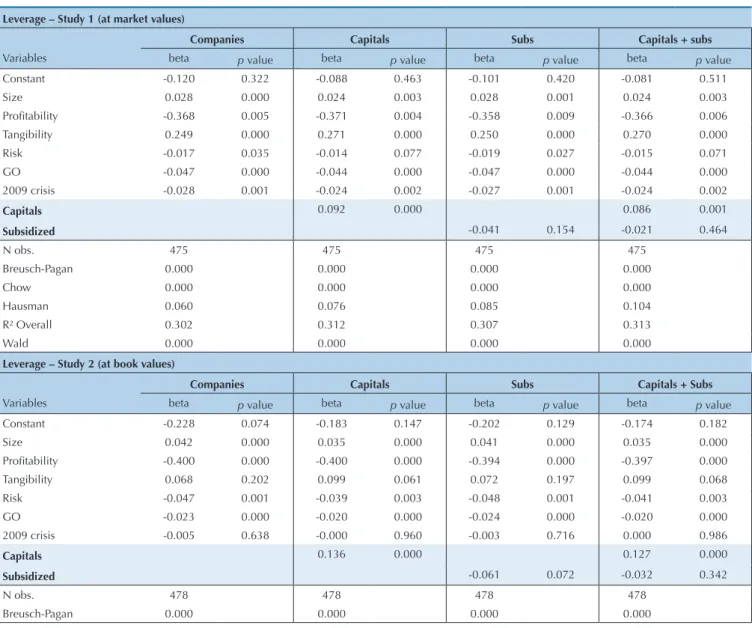
Table 3 displays the results of the regression models with panel data for the dependent variable leverage. The models differ due to the inclusion of independent va-riables and the specification of vava-riables in market or accounting terms.
Initially, it is noticed that, together, the p value of the Breusch-Pagan’s LM test, Chow’s F-test, and Hausman’s test indicate that the random effects model is appro-priate at the 1% significance level. Therefore, the p value of the coefficients for the random effects model with robust clustered standard errors are shown in line with Fávero (2013). Wald’s p value indicates that all models are significant at 1%.
Leverage – Study 1 (at market values)
Companies Capitals Subs Capitals + subs
Variables beta p value beta p value beta p value beta p value
Constant -0.120 0.322 -0.088 0.463 -0.101 0.420 -0.081 0.511
Size 0.028 0.000 0.024 0.003 0.028 0.001 0.024 0.003
Proitability -0.368 0.005 -0.371 0.004 -0.358 0.009 -0.366 0.006
Tangibility 0.249 0.000 0.271 0.000 0.250 0.000 0.270 0.000
Risk -0.017 0.035 -0.014 0.077 -0.019 0.027 -0.015 0.071
GO -0.047 0.000 -0.044 0.000 -0.047 0.000 -0.044 0.000
2009 crisis -0.028 0.001 -0.024 0.002 -0.027 0.001 -0.024 0.002
Capitals 0.092 0.000 0.086 0.001
Subsidized -0.041 0.154 -0.021 0.464
N obs. 475 475 475 475
Breusch-Pagan 0.000 0.000 0.000 0.000
Chow 0.000 0.000 0.000 0.000
Hausman 0.060 0.076 0.085 0.104
R² Overall 0.302 0.312 0.307 0.313
Wald 0.000 0.000 0.000 0.000
Leverage – Study 2 (at book values)
Companies Capitals Subs Capitals + Subs
Variables beta p value beta p value beta p value beta p value
Constant -0.228 0.074 -0.183 0.147 -0.202 0.129 -0.174 0.182
Size 0.042 0.000 0.035 0.000 0.041 0.000 0.035 0.000
Proitability -0.400 0.000 -0.400 0.000 -0.394 0.000 -0.397 0.000
Tangibility 0.068 0.202 0.099 0.061 0.072 0.197 0.099 0.068
Risk -0.047 0.001 -0.039 0.003 -0.048 0.001 -0.041 0.003
GO -0.023 0.000 -0.020 0.000 -0.024 0.000 -0.020 0.000
2009 crisis -0.005 0.638 -0.000 0.960 -0.003 0.716 0.000 0.986
Capitals 0.136 0.000 0.127 0.000
Subsidized -0.061 0.072 -0.032 0.342
N obs. 478 478 478 478
Breusch-Pagan 0.000 0.000 0.000 0.000
Table 3 Regressions with panel data: leverage
Through the adequacy of the random effects model, it is possible to understand the effects not observed, constant in time, which also determine companies’ le-verage, they are not correlated to explanatory variables in the models. Wooldridge (2006, p. 433) argues that this is related to good controls in the equation. Hence, it is possible that the control variables adopted in this study, which are those with more robust results in pre-vious studies, play a good role in explaining the firms’ capital structure. Thus, the effects of variables omitted in this study are controlled so that they become part of the error term, and it is assumed they are not correlated to the explanatory variables (Hsiao, 2006, p. 12).
The coefficient for the variable size is positive and significant, indicating that larger firms tend to be more leveraged. Rajan and Zingales (1995) argue that larger firms are less likely to fail to pay their debts, so they might obtain under better conditions, given the lower default risk faced by lender. Titman and Wessels (1988) state that larger firms tend to be more diversified and less prone to the bankruptcy risk, something which could allow greater leverage in these companies.
The variable profitability showed up negative and significant, indicating that the most profitable firms are less leveraged. The sign for this variable is consistent with the pecking order theory (Myers & Majluf, 1984), since more profitable firms – by generating greater amount of resources internally, derived from their ope-rations – might have less need to seek external funding, avoiding problems that arise from asymmetric informa-tion.
The variable tangibility indicates that the greatest proportion of assets that can be used as guarantee in contracting new loans, provides firms with greater leve-rage. Valle and Albanez (2012) explain the importance of tangible assets in the Brazilian case:
Paradoxically, the combination of high interest rates in the period and a short-term portion of relevant funding could potentiate the risk of funding (such as liquidity risk and default). To mitigate these risks, it is known that a
Rural Credit operations), banks also required guarante-es of actual assets in operations with their own rguarante-esourcguarante-es (Valle & Albanez, 2012, p. 64).
The variable risk, negative and significant in the stu-dies, points out that the riskiest firms are less leveraged, as expected. Based on the trade-off theory, riskier firms, i.e. those with the highest expected costs of financial difficulties, might take less advantage of the tax benefit arising from the addition of debts in their capital struc-ture, therefore, they are less leveraged.
For the variable growth opportunities, the negative and significant relationship for the two studies indicates that the higher the firm’s growth opportunities, the lo-wer its leverage. From the perspective of Myers (1977), companies with greater growth opportunities could fund themselves primarily through stocks, avoiding the conflict between creditors and shareholders, i.e. the un-derinvestment issue. Analyzing through the eyes of Jen-sen (1986), companies with greater growth opportuni-ties have less free cash flow for occasional discretionary use by a manager, as they would be using the cash flow to ‘enjoy’ such growth opportunities, thus there would be no need for debt to exert the control function.
The variable dummy for the crisis of financial insti-tutions, worked on in the year 2009, showed a signifi-cant result in study 1, indicating that, in the year 2009, leverage in market values has been reduced. In study 2, the variable crisis is not significant.
Thus, it may be said that the result obtained for the variable crisis catches the effect of the increased market value of firms in 2009, instead of a drop in leverage mo-tivated by an occasional reduction in the resources pro-vided by financial institutions. The drop in the share of banking resources in the capital structure was minimal from 2008 to 2009, as shown in Figure 1.
In relation to the funding sources, the variable repre-senting the capital market is positive and significant in both studies. This means that companies that rely more on the capital market, i.e. with a higher proportion of loans raised in this market, are more leveraged than the Notes: leverage – total debts divided by total assets; study 1 – variables specified in market terms; study 2 – variables specified in accounting terms; beta – coefficients of the variables; p value – p value of coefficients for the random effects model with robust clustered standard errors; N obs. – number of observations; Breusch-Pagan –
p value of the Breusch-Pagan’s LM test; Chow – p value of Chow’s F-test; Hausman – p value of the Hausman’s test; R² overall – general explanation coefficient of the random effects model with robust clustered standard errors; Wald – p value of Wald’s statistics for the random effects model with robust clustered standard errors; size – logarithm of net operating revenue; profitability – EBITDA divided by total assets; tangibility – property divided by total assets; risk – unlevered beta; GO – growth opportunities measured by the ratio between assets’ market value and assets’ book value; 2009 crisis – dummy with value 1 in 2009 and 0 in the other years; capitals – the proportion of loans raised on the capital market; subsidized – proportion of debt with subsidized interest rates. The variables size and GO are not influenced by the calculation method at market values or book values.
Chow 0.000 0.000 0.000 0.000
Hausman 0.070 0.159 0.091 0.195
R² overall 0.142 0.188 0.152 0.190
Faulkender and Petersen (2006, p. 48) state that fir-ms with access to the capital market may be leveraged having two channels as a basis – the first by having ac-cess to a greater amount of resources and, second, by having access to a cheaper resource. The argument may be justified so that firms with lower information asym-metry, with better reputation (Diamond, 1991b), and/or with less need for the reorganizer skills of the financial institutions (Rajan, 1992), obtain resources in the capi-tal market.
The variable representing debt with subsidized inte-rest rates was not significant to explain market leverage and only a minimal significance to explain book leve-rage, when added as a single offering variable. In this case, the variable has a negative sign. This indicates that companies relying more on debt with subsidized
inte-rest rates are not more leveraged than the others. This result contrasts with Valle and Albanez (2012), where access to differential sources is positively and significantly correlated to firms’ leverage. A possible explanation is that within the period evaluated by the authors (1997-2006) there was “a shy presence of long--term debts deriving from issuance of securities in the capital market” (Valle & Albanez, 2012, p. 64). Thus, it is possible that the growth of the Brazilian capital ma-rket, especially since 2009, according to the issuance of debentures under the Instruction CVM 476/2009, has caused some change in this regard, i.e. it is possible that companies, those with lower information asymmetry, started relying on the capital market, showing, therefo-re, higher leverage. Now, these companies have access to a greater amount of resources, which are cheaper.
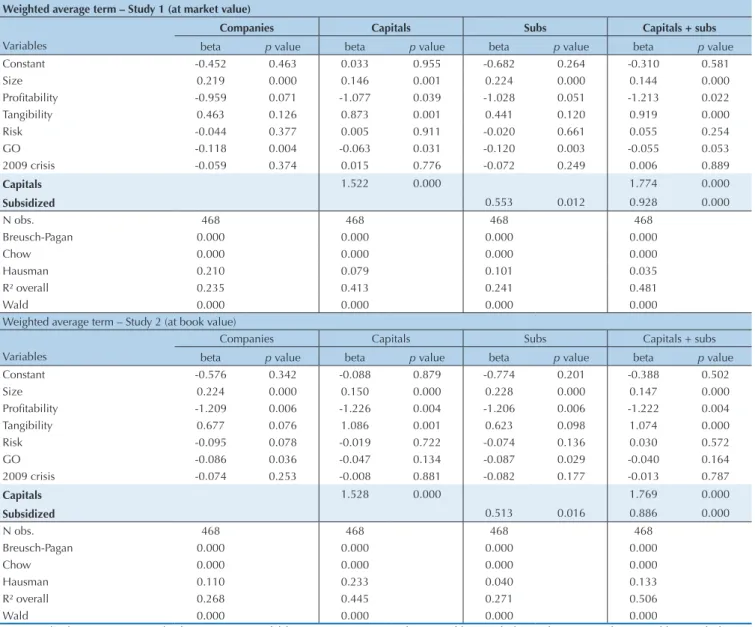
Weighted average term – Study 1 (at market value)
Companies Capitals Subs Capitals + subs
Variables beta p value beta p value beta p value beta p value
Constant -0.452 0.463 0.033 0.955 -0.682 0.264 -0.310 0.581
Size 0.219 0.000 0.146 0.001 0.224 0.000 0.144 0.000
Proitability -0.959 0.071 -1.077 0.039 -1.028 0.051 -1.213 0.022
Tangibility 0.463 0.126 0.873 0.001 0.441 0.120 0.919 0.000
Risk -0.044 0.377 0.005 0.911 -0.020 0.661 0.055 0.254
GO -0.118 0.004 -0.063 0.031 -0.120 0.003 -0.055 0.053
2009 crisis -0.059 0.374 0.015 0.776 -0.072 0.249 0.006 0.889
Capitals 1.522 0.000 1.774 0.000
Subsidized 0.553 0.012 0.928 0.000
N obs. 468 468 468 468
Breusch-Pagan 0.000 0.000 0.000 0.000
Chow 0.000 0.000 0.000 0.000
Hausman 0.210 0.079 0.101 0.035
R² overall 0.235 0.413 0.241 0.481
Wald 0.000 0.000 0.000 0.000
Weighted average term – Study 2 (at book value)
Companies Capitals Subs Capitals + subs
Variables beta p value beta p value beta p value beta p value
Constant -0.576 0.342 -0.088 0.879 -0.774 0.201 -0.388 0.502
Size 0.224 0.000 0.150 0.000 0.228 0.000 0.147 0.000
Proitability -1.209 0.006 -1.226 0.004 -1.206 0.006 -1.222 0.004
Tangibility 0.677 0.076 1.086 0.001 0.623 0.098 1.074 0.000
Risk -0.095 0.078 -0.019 0.722 -0.074 0.136 0.030 0.572
GO -0.086 0.036 -0.047 0.134 -0.087 0.029 -0.040 0.164
2009 crisis -0.074 0.253 -0.008 0.881 -0.082 0.177 -0.013 0.787
Capitals 1.528 0.000 1.769 0.000
Subsidized 0.513 0.016 0.886 0.000
N obs. 468 468 468 468
Breusch-Pagan 0.000 0.000 0.000 0.000
Chow 0.000 0.000 0.000 0.000
Hausman 0.110 0.233 0.040 0.133
R² overall 0.268 0.445 0.271 0.506
Wald 0.000 0.000 0.000 0.000
Table 4 Regressions with panel data: weighted average term
Table 4 displays the results for the dependent varia-ble weighted average term. All models are significant at 1%. It is noteworthy that R² in models having the va-riables of funding sources together – 48.1% in study 1 and 50.6% in study 2 –, considerably higher than R² in models having only the firms’ variables, indicating the relevance of funding sources to explain maturity.
Firms’ size shows up as a relevant characteristic in determining debt maturity, it is positive and significant at 1% in all models. Titman and Wessels (1988) argue that the fixed cost of raising new debts may be related to their maturity, so that long-term debts might have in-creased fixed costs. Thus, smaller firms would pay more for issuing long-term debts, since they would have less means of diluting this cost in the amount raised.
Profitability indicates that more profitable firms, be-cause they have a greater amount of resources generated by their activities, seek less external funding, avoiding the problems arising from asymmetric information, in line with the pecking order theory. Since such compa-nies do not need great amounts of external funding, they would have little opportunity to dilute the higher fixed costs associated with higher resources’ maturities, therefore, obtaining at lower maturities.
he variable tangibility has become unstable in study 1, but signiicant in study 2. When it shows up as signii-cant, indicates that companies with a higher proportion of tangible assets have higher maturity of their debts, conirming the role played by assets that can be used as guarantee in contracting new debts, especially long-term ones. Fan et al. (2012) point out that assets’ tangibility was the most robust determinant of companies’ debt maturity in their sample. It may be inferred, based on comparison between the models, that instability in the variable tan-gibility is related to the inclusion of the variable capital market, indicating a possible relationship between them.
Only in one model risk was statistically significant. Diamond (1991a) suggests that companies that obtain short-term debt are those with the highest credit ratings and those with lowest ratings. Companies that obtain long-term debt are those with intermediate credit ra-ting. Thus, based on the pattern suggested by Diamond (1991a), it is possible that the proxy used in this stu-dy cannot identify the effect of credit risk on the firms’ debt maturity. However, given the unavailability of in-formation on credit ratings (like in Diamond, 1991a) for preparing this study, this is regarded as a limitation to deeper interpretation of the effect of the firm’s credit risk in determining the maturity of its debts.
The variable growth opportunities is aligned with the argument that companies with greater growth op-portunities lend in the short-term, in order to avoid or mitigate agency problems in the creditor-shareholder relationship (Myers, 1977).
The dummy for the crisis, in 2009, is not significant, therefore, it indicates that the crisis of financial insti-tutions did not cause changes in the companies’ debt maturity.
As highlighted, debt in the capital market shows up as a determinant of great relevance to explain the com-panies’ debt maturity, given the gain in R² of models and the significance of their coefficients. Its coefficient indicates that firms with a higher proportion of loans raised in the capital market have a higher debt matu-rity than the others, in line with Barclay and Smith Jr. (1995).
The inclusion of the variable representing subsidi-zed debt shows a positive and significant coefficient. Thus, it may be argued that companies with a higher proportion of debts with subsidized interest rates also have higher debt maturity than the others. This result was expected, given that BNDES is seen as the main provider of long-term funds in the Brazilian economy.
Taken together, the results point out that both the capital market resources and the subsidized resources have higher maturities. Thus, it is observed that the su-pply of short-term funds is made primarily by financial institutions, in line with Barclay and Smith Jr. (1995). Thus, the Brazilian companies’ low debt maturity is jus-tified, since, on average, they relied on 45.7% of their debts with resources from this provider within the pe-riod.
Extending the analysis of the model containing the variables of the capital market and subsidized debt to-gether, it is observed that the coefficient of the variable capital market is greater than the coefficient of subsi-dized debt, both in study 1 and in study 2. Hypothe-tically, if two identical companies in terms of control variables were taken as a basis, however, one with 100% of its debts raised on the capital market and the other with 100% of its debts raised on subsidized sources, the model indicates that the company with debt in the ca-pital market has a higher maturity of its debts than the company with subsidized debt.
This study aimed to verify how the funding sources on which companies are based might be relevant in sha-ping the Brazilian listed companies’ capital structure within the period from 2005 to 2012.
The results showed that the debt proportion in the capital markets is relevant in determining companies’ leverage. Thus, companies with higher debt propor-tions in the capital markets are more leveraged than the others. In turn, the debt proportion with subsidized interest rates does not show up as relevant in order to enable greater leverage to companies, a result associated with the development of the Brazilian capital market, given the Instruction CVM 476/2009.
Regarding maturity, measured by the weighted ave-rage maturity of debt payments, it was found that both the capital market and the providers with subsidized in-terest rates are responsible for providing resources with higher maturity. Therefore, it may be concluded that re-sources from financial institutions are those with lower maturities, something which justifies the low maturity of companies’ debts, since such companies were largely based on bank resources for their funding.
Extending the analysis, evidence that the resources from the capital market have a higher maturity when compared to subsidized resources were found. his is a surprising result, since subsidized resources are regarded as long-term resources available to Brazilian companies. his inding was justiied the context of funding sources within the sample period as a basis, pointing out evidence
that the growth of the Brazilian capital market, especially in the years ater 2009, due to the enactment of Instruc-tion CVM 476/2009, may have caused, or has been cau-sing, modiications in the way how companies make up their capital structure. he results show that Brazilian companies are based on the capital markets for their fun-ding with higher maturity and subsidized resources, from BNDES, to fund their mid-term maturities.
Giambiagi et al. (2009) point out that a 2008 do-cument produced by the World Bank, raises the issue of a possible revaluation in the role played by BNDES, considering some development in the Brazilian capi-tal market. This study shows evidence that there have been changes in the way how these providers impact the companies’ capital structure. Further research, addres-sing information of the next few years, can approach this issue, by checking the joint evolution of resources provided by BNDES and the Brazilian capital market.
The study has its limitations: the largest companies listed on the BM&FBOVESPA were evaluated, so that the sample of this study has a bias towards large Bra-zilian companies. Companies that did not have enou-gh information in their notes were not included in the analysis, so that perhaps there is a bias towards com-panies with less asymmetric information. Finally, the results are restricted to the companies operating in the sectors under analysis, since the sectors not covered in this study may have a differential relationship with sub-sidized providers.
Albanez, T., & Valle, M. R. (2009). Impactos da assimetria de informações na estrutura de capital de empresas brasileiras abertas. Revista Contabilidade & Finanças, 20(51), 6-27.
Albanez, T., Valle, M. R., & Corrar, L. J. (2012). Fatores institucionais e assimetria informacional: inluência na estrutura de capital de empresas brasileiras. Revista de Administração Mackenzie, 13(2), 76-105.
Barclay, M. J., & Smith Jr., C. W. (1995, junho). he maturity structure of corporate debt. he Journal of Finance, 50(2), 609-631.
Bastos, D. D., & Nakamura, W. T. (2009). Determinantes da estrutura de capital das companhias abertas no Brasil, México e Chile no período 2001-2006. Revista Contabilidade & Finanças, 20(50), 75-94. Bastos, D. D., Nakamura, W. T., & Basso, L. F. C. (2009). Determinantes
da estrutura de capital das companhias abertas na América Latina: um estudo empírico considerando fatores macroeconômicos e institucionais. Revista de Administração Mackenzie, 10(6), 47-77. Bogéa Sobrinho, L. R., Sheng, H. H., & Lora, M. I. (2012). Country factors
and dynamic capital structure in Latin American irms. Revista Brasileira de Finanças, 10(2), 267-284.
Booth, L., Varouj, A., Demirgüç-Kunt, A. & Maksimovic, V. (2001, fevereiro). Capital structure in developing countries. he Journal of Finance, 56(1), 87-130.
Correa, C. A., Basso, L. F. C., & Nakamura, W. T. (2013). A estrutura de capital das maiores empresas brasileiras: análise empírica das teorias de pecking order e trade-of, usando panel data. Revista de Administração Mackenzie, 14(4), 106-133.
Demirgüç-Kunt, A., & Maksimovic, V. (1999). Institutions, inancial
markets, and irm debt maturity. Journal of Financial Economics, 54, 295-336.
Diamond, D. W. (1991a, agosto). Debt maturity structure and liquidity risk. he Quarterly Journal of Economics, 106(3), 709-737. Diamond, D. W. (1991b, agosto). Monitoring and reputation: the choice
between bank loans and direct placed debt. Journal of Political Economy, 99(4), 689-721.
Fan, J. P. H., Titman, S., & Twite, G. (2012, fevereiro). An international comparison of capital structure and debt maturity choices. Journal of Financial and Quantitative Analysis, 47(1), 23-56.
Faulkender, M., & Petersen, M. A. (2006). Does the source of capital afect the capital structure? he Review of Financial Studies, 19(1), 45-79. Fávero, L. P. L. (2013). Dados em painel em contabilidade e inanças: teoria
e aplicação. Brazilian Business Review, 10(1), 131-156.
Frank, M. Z., & Goyal, V. D. (2009). Capital structure decisions: which factors are reliably important? Financial Management, 38(1), 1-37. Giambiagi, F., Leal, G. B. B., Moreira, M. M., & Faveret Filho, P. S. C.
(2009). O inanciamento de longo prazo e o futuro do BNDES. In: Giambiagi, F., Barros, O. (Orgs.). Brasil pós-crise: agenda para a próxima década (pp. 267-287). Rio de Janeiro: Elsevier.
Hsiao, C. (2006, maio). Panel data analysis: advantages and challenges. Los Angeles, CA: Institute of Economic Policy Research. (IEPR Working Papers).
Instrução CVM n 476, de 16 de janeiro de 2009. Dispõe sobre as ofertas públicas de valores mobiliários distribuídas com esforços restritos e a negociação desses valores mobiliários nos mercados regulamentados.
References
Jensen, M. C. (1986, maio). Agency costs of free cash low, corporate inance, and takeovers. he American Economic Review, 76(2), 323-329.
Lazzarini, S. G., Musacchio, A., Bandeira-de-Melo, R., & Marcon, R. (2012).
What do development banks do? Evidence from Brazil, 2002-2009. Recuperado de http://ssrn.com/abstract=1969843
Leary, M. T. (2009, junho). Bank loan supply, lender choice, and corporate capital structure. he Journal of Finance, 64(3), 1143-1185.
Modigliani, F., & Miller, M. H. (1958). he cost of capital, corporation inance and the theory of investment. he American Economic Review, 48(3), 261-297.
Modigliani, F., & Miller, M. H. (1963). Corporate income taxes and the cost of capital: a correction. he American Economic Review, 53(3), 433-443.
Myers, S. C. (1977). Determinants of corporate borrowing. Journal of Financial Economics, 5, 147-175.
Myers, S. C. (2001). Capital structure. he Journal of Economic Perspectives, 15(2), 81-102.
Myers, S. C., & Majluf, N. S. (1984). Corporate inancing and
investment decisions when irms have information that investors do not have. Journal of Financial Economics, 13, 187-221.
Nakamura, W. T., Jucá, M. N., & Bastos, D. D. (2011). Estrutura de
maturidade das dívidas das empresas brasileiras: um estudo empírico. Revista de Administração Contemporânea, 15(2), 228-248. Póvoa, A. C. S., & Nakamura, W. T. Homogeneidade versus
heterogeneidade da estrutura de dívida: um estudo com dados em painel. Revista Contabilidade & Finanças, 25(64), 19-32.
Rajan, R. G. (1992, setembro). Insiders and outsiders: the choice between informed and arm’s-length debt. he Journal of Finance,
47(4), 1367-1400.
Rajan, R., & Zingales, L. (1995). What do we know about optimal capital structure? Some evidence from international data. he Journal of Finance, 50(5), 1421-1460.
Rauh, J. D., & Sui, A. (2010). Capital structure and debt structure. he Review of Financial Studies, 23(12), 4242-4280.
Terra, P. R. S. (2009). Are leverage and debt maturity complements or substitutes? Evidence from Latin America. Revista de Administração Mackenzie, 10(6), 4-24.
Titman, S., & Wessels, R. (1988, março). he determinants of capital structure choice. he Journal of Finance, 43(1), 1-19.
Valle, M. R., & Albanez, T. (2012). Juros altos, fontes de inanciamento e estrutura de capital: o endividamento de empresas brasileiras no período 1997-2006. Revista de Contabilidade e Organizações, 6(16), 50-72.
Wooldridge, J. M. (2006). Introdução à econometria: uma abordagem moderna. São Paulo: Pioneira homson Learning.