A Work Project, presented as part of the requirements for the Award of a Master Degree in Management from the NOVA – School of Business and Economics.
THE IMPACT OF REBRANDING ON FOX COMEDY
Francisco Xavier Moura Borges Ribeiro de Fontes | #2939
A project carried out on the Master in Management Program, under the supervision of: Professor Sofia Franco
THE IMPACT OF REBRANDING ON FOX COMEDY Abstract
In the context of the Portuguese television market, this thesis aims to quantify the effects of rebranding on Fox Comedy. We find that, on average, rebranding results in a 0,05% increase in the share of audience, indirectly influencing the share of investment in advertising, by producing effects in different variables of the TV channel. Moreover, we provide a forecasting model for the share of investment in advertising, where we tackle the jump in the time series data carried out by the rebranding process. The predictions are of a 3 p.p. increase within the next 12 months.
Acknowledgements
I would like to express my special appreciation and sincere gratitude to:
- my family and friends for their endless support and motivation to strive towards my goal - my advisor, Professor Sofia Franco, for her valuable guidance and constructive criticism - Fox Networks Group, for providing data and sharing essential information throughout the thesis
1. Introduction
Firms invest large amounts of money building, sustaining and rejuvenating brands. However, there is often the need of changing the brand names for many reasons. Some of these reasons include signaling the evolution of business activities, changing negative associations with the current brand name or reflecting a merger (Tsai, Dev & Chintagunta, 2015).
In November 2015, Fox Networks Group has rebranded one of its Portuguese TV channels from FX to Fox Comedy. In the case of FX, this need implied much more than just a different brand name. The management of the TV channel demanded a structural change.
Fox Networks Group needed to signal the evolution of the business and improve the image of the TV channel. Fox Comedy incorporated an identity that FX didn’t have, and perfectly complemented the firm’s portfolio through the comedy segment’s fulfillment. This rebranding aimed at producing great effects on the revenues of the firm, which are highly dependent on advertising sales and audiences.
In this thesis, we assess the rebranding impact on the TV channel, particularly on B2B advertising sales. We use a regression analysis to examine the influence of rebranding on variables that contribute to the advertising sales. In addition, we develop a forecasting model to further understand the evolution over time of advertising sales, incorporating the rebranding effects in the predictions.
Section 2 presents the media industry and television market. Then, section 3 provides the literature review on branding practices and its relationship with B2B advertising sales. Section 4 presents the methodologies used: regression analysis and forecasting model. Finally, section 5 offers conclusions.
2. Market and Industry Characterization 2.1. Industry Overview and Evolution
According to Oliveira (2014), Portuguese media industry relies mostly on television, press and radio.1 The major industry groups are Media Capital, Impresa, Cofina, R/Com, ABola, Control Investe, Impala, Publico, Ongoing and RTP. These groups have been prospering in the sectors, even though the online channels are gaining relevance in Portuguese media. The concentration degree of the industry varies across sectors, with television dominated by Media Capital and Impresa, having reached in December 2013 28% and 24,5% of prime-time audience share, respectively, and press led by Cofina, with 40% of market share in paid daily press. As for the radio, R/Com and Media Capital together own about 70% of the market (Oliveira, 2014).
In accordance with Oliveira (2014), Portuguese media industry has recently benefited from an improvement in advertising revenues from the main groups. After a recession period in the Portuguese macroeconomic framework, the ad market CAGR 2013-2020 is now expected to be of 6,8%.2 In 2007, advertising represented only 0,43% of Portuguese GDP.3 As a reflection of the low development of the market, it’s significantly more concentrated than other markets. The top10 advertising investors in Portugal represented 31% of the total in 2013 (see table A.1 in the appendix).
According to PwC (2013), there’s been a global transition to the digital era (see figure A.1 in the appendix, and related text).4 Within ad market, however, television will keep in 2017 the leading position globally. PwC (2013) supports that the Portuguese situation in media industry follows the global one. The weight of television in the Portuguese media industry has deteriorated compared to digital media, due to the stronger growth pace of the
1 Oliveira, P.P. (BPI’s analyst) developed a study on Portuguese Media in March 2014.
2 CAGR stands for Compound Annual Growth Rate and is the mean annual growth rate of an investment over a specified 2 CAGR stands for Compound Annual Growth Rate and is the mean annual growth rate of an investment over a specified
period of time longer than one year.
3 GDP stands for Gross Domestic Product.
latter. It’s expected that by the end of 2017 Pay-TV reaches 3,8 million subscribers against 3.1 million in 2012, and that the penetration rate increases from 53% to 60% within the same time period.5 However, the Internet Access penetration rate is expected to increase even more,
from 43% in 2012 to 59% in 2017, representing a 5% of CAGR.
Regarding advertising, television is the dominant segment. TV ad market has been improving in the last years, however in 2017 it will still be below the peak registered in 2008 by 23,5%. Legal advertising impositions and higher elasticity of TV to the economy compared to other advertising vehicles didn’t help the segment.6 Internet Advertising in
Portugal is expected to grow 8,7% annually between 2012 and 2017, mostly fostered by search media. Even though Internet advertising keeps on growing at a much faster pace than TV, part of this growth can be absorbed by online-TV. With Portuguese TV viewers growing year-over-year and improving signs from the economy, it is hard not to expect TV advertising to increase its weight in the future. According to Oliveira (2014), the estimated weight for 2020 is of 57%.
2.2. Market Background and Overview
Until the 80s, the Portuguese television market was a public monopoly owned by Rádio e Televisão de Portugal (RTP). Later on, it started to be competitive, as a result of the appearance of two private groups: Sociedade Independente de Comunicação (SIC), in 1992, and Televisão Independente (TVI), in 1993.7
Conventional broadcasting system was overtaken by the emergence of cable television networks. Operators have increased their services by introducing high-speed Internet
5 Penetration rate is a measure of the amount of sales or adoption of a product or service compared to the total theoretical
market for that product or service.
6 The legal impositions defined a maximum of 6 minutes per hour in public and premium channels and a maximum of 12
minutes per hour in the others.
connections and Video-on-demand services along with linear television.8 This occurred worldwide and Portugal was not an exception. Through this technological advancement, together with economic, social and legal factors, the market has changed, with more players and larger portfolios of channels (Sobral, 2012).
Cable TV providers are now at the center of broadcasting, where consumers are willing to pay for entertainment that suits their interests. According to ANACOM (2016), in the 2nd Trimester of 2016, 88,1% of the total Portuguese households were cable subscribers.
The two main revenue sources of cable TV companies are the subscription fees and the advertising revenues. The share of audience is the main driver, having different impacts in terms of revenues. The portion that comes from operators has directly to do with audience reach.9 There is also an indirect impact of audiences’ performance on companies’ business size and market power. It influences not only the way television companies negotiate with operators, but also the advertisers’ willingness to invest.
With the goal of differentiation, the market has focused on the quality of the service. Television companies carry out distinctive programming, grid position investment, marketing campaigns and branding strategies, to ultimately attract consumers.
In order to widen the offerings, television groups have also diversified the portfolio of channels, matching specific targets. In other words, the market has evolved from generic programming to a strategy driven by segmented channels’ content. Accordingly, 38 channels were launched since the beginning of 2012.10
8 Linear TV is the television service where the viewer watches a scheduled TV program at the particular time it’s offered, and
on the particular channel it's presented on.
9 There is also a direct impact in advertising, regarding pricing based on past audience results (cost per rating point), mainly
applied in FTA channels.
2.3. Evolution of Market Shares
In the television business, market share is measured through SOA (share of audience).11 The Portuguese market criteria for computing the shares considers Live
transmission until December 2015, and has started including also VOSDAL from January 2016 on.12
Figure A.2 in the appendix shows the evolution of the Portuguese television market shares by type of channels between March 2012 and October 2016.13 The analysis takes into account the following types of television channels: free-to-air (FTA) channels, Pay-TV channels and “Others”.14
In March 2012, FTA channels (RTP1, RTP2, SIC and TVI) presented a total market share of 63,4%, against 25,0% on Pay-TV. Over time, these two categories started to converge, since non-paid channels didn’t follow the growth of paid ones, registering in October 2016 53,8% against 37,2%. At the same time, “Others” have lost audience, mostly because of the transition from Live to Live+VOSDAL criteria, which has purged same-day viewing from the group and contributed to “All Pay-TV” enhancement.
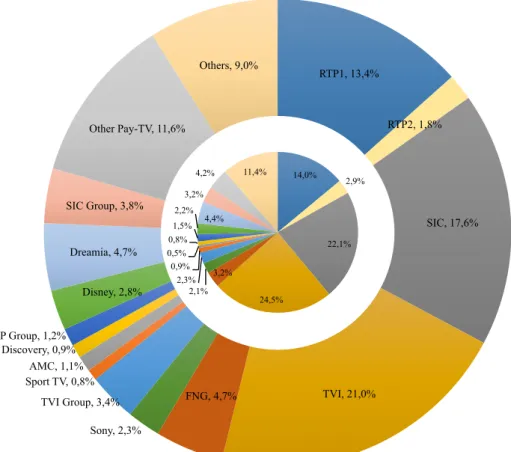
According to figure 1, from October 2012 to October 2016, almost all the major Pay-TV groups increased their market shares, expressing a more balanced distribution between all market players.15 Table A.2 in the appendix presents the list of Pay-TV channels per group
considered. Within FTA channels, TVI concentrates 21,0% of market share, followed by SIC
11 According to Media Monitor, SOA is the time percentage devoted by each individual to viewing a channel/event relatively
to the total time devoted to viewing television, for the same period of time.
12 VOSDAL stands for Viewed on Same Day As Live. From July 2016, the Portuguese market started to consider viewing
with a deferment up to 1 day, but for having a solid basis, I will not include it but in “Others” group.
13 The collected data is distributed by MMW/Media Monitor and the reason why the analysis doesn’t start in January 2012 is
due to the transition occurred in March 2012 from Marktest to GfK as the responsible reporting entity, assuring thus criteria homogeneity and data accuracy.
14 For entire understanding purposes, FTA could not be neglected, since they concentrate the audience majority, even though
the focus of this study is Pay-TV channels. “Others” include all the non-identified viewing such as non-TV content (DVD, VCR, video games, etc.), not measured channels or not identified deferred viewing.
and RTP1, the 3 main open channels, which have seen their shares lowered, despite still being market leaders.16
Source: MMW/Media Monitor
Regarding Pay-TV channels, Fox Networks Group (FNG) together with Dreamia Group achieved in October 2016 the highest market shares (both 4,7%). This was helped by the rebranding of FX to Fox Comedy in the case of FNG and Panda increasing performance in the case of Dreamia. Moreover, FNG has registered the biggest growth between all players (+1,6 p.p.).
When examining Other Pay-TV, market share has more than doubled from one period to another, which can be explained by two market changes: higher number of small television
16 FTA channels were put out of the respective groups in order to separate them from the groups’ paid channels.
RTP1, 13,4% RTP2, 1,8% SIC, 17,6% TVI, 21,0% FNG, 4,7% Sony, 2,3% TVI Group, 3,4% Sport TV, 0,8% AMC, 1,1% Discovery, 0,9% RTP Group, 1,2% Disney, 2,8% Dreamia, 4,7% SIC Group, 3,8% Other Pay-TV, 11,6% Others, 9,0%
Figure 1 - Market Share by major group, October 2012 (inside) and October 2016 (outside)
14,0% 2,9% 22,1% 24,5% 3,2% 2,1% 2,3% 0,9% 0,5% 0,8% 1,5% 2,2% 4,4% 3,2% 4,2% 11,4%
channels and improving performance of existing ones.17 CMTV, debuted on March 2013, is a special case: as the only TV channel of Cofina Group, it was the main responsible of Other Pay-TV audience improvement, having contributed with almost ¼ of the total increase. CMTV has already surpassed RTP 2 (one of the free-to-air channels) and is now leader of all Pay-TV channels, with a market share of 2,7% in October 2016.
Overall, Pay-TV channels are gaining position over generalist channels, revealing fiercer competition in the market.
2.4. Market Concentration and Type of Market Structure
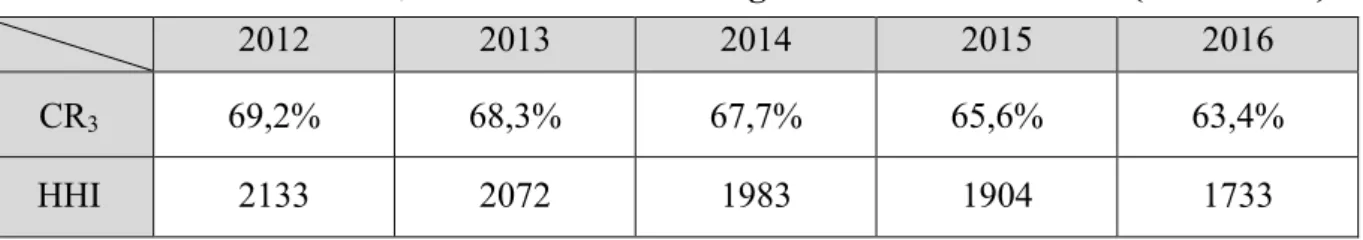
From 2012 to 2016, CR3 ranges between 69,2% and 63,4%, having TVI Group (Media
Capital), SIC Group (Impresa) and RTP Group as the 3 main groups over time.18 Table 1 exhibits the behavior of CR3, showing the index continuous reduction throughout the years.19
These are high percentages, providing evidence on the existence of an oligopoly, although confirming what has been mentioned before regarding a stronger competition in the market over time.
Table 1 – Evolution of CR3 and HHI in the Portuguese Television Market (2012 - 2016)
2012 2013 2014 2015 2016
CR3 69,2% 68,3% 67,7% 65,6% 63,4%
HHI 2133 2072 1983 1904 1733
Source: MMW/Media Monitor
17 Channels inserted in Other Pay-TV either have little significance in terms of share and/or do not belong to a media group
with more than one TV channel.
18 CR
3 stands for concentration rate, and is the combined share of the 3 largest groups in the Portuguese television market.
For this purpose, FTA channels are aggregated in their respective groups, since the analysis relies on companies’ and not channels’ market concentration.
19 The annual values of both indicators were computed based on the average of monthly market shares from March 2012 to
HHI can also be seen in table 1.20 With values over 1800 until 2015, the annual HHI’s are not surprising and reflect a tight oligopoly, having FTA as the dominant channels that take advantage of open signal to empower its respective groups.21 However, the index has been
declining over time, achieving in 2016 a value under 1800, reflex of the new groups’ appearance and thus not so tight market structure.
Both CR3 and HHI then suggest that the Portuguese television market is an oligopoly.
Furthermore, we can observe that Pay-TV development in the market has been leveling SOA’s distribution, thus softening the degree of concentration.
3. Literature Review 3.1. B2B Advertising Sales
B2B advertising sales consist of ads selling efforts directed to other businesses rather to individual consumers. Within the context of cable industry, B2B advertising includes primarily messages aimed at advertisers and cable system operators (McDowell, 2004). Its goal relies on persuading advertisers and media buyers to purchase commercials. As opposed to consumer advertising, B2B advertising concentrates typically on a much smaller audience of business decision makers possessing common knowledge.
Brand preference and audiences are two major factors that make B2B advertising companies succeed, achieving profitability, growth and long-term success. For media firms that rely on an advertiser-supported business model, as more advertisers develop customized campaigns around media brands to enhance the messages’ effectiveness, stronger brand
20 HHI stands for Herfindahl-Hirschman Index, and is calculated by summing the squared market shares of all companies in
the market. “Others” group was not considered, otherwise it would bias the indicator, since it does not represent a firm and is a high value of impossible defragmentation.
21 According to “Competition in the Portuguese Economy: An overview of classical indicators”, by Amador, J. & Soares, A.
C., from Banco de Portugal, markets with HHI > 1800 are considered to be highly concentrated, and the market structure associated with this range is a tight oligopoly; markets with 1000 < HHI < 1800 are considered to be moderately concentrated, and the market structure associated is an oligopoly; markets with HHI values < 1000 are considered to have low levels of concentration, that is, the market structure is likely to be a monopolistic competition.
equity directly leads to a better financial outcome (Chan-Olmsted, 2011).22 Furthermore, as a multichannel source of revenue in media industry, B2B ad sales raise the need to differentiate the offerings and maximize the audiences in order to attract advertisers (Bellamy & Traudt, 2000).
Stipp (2012) has studied the US television market and concluded that branding campaigns contribute to viewers’ good perception of the networks and that audience market shares are central to advertisers.
In B2B ad sales, branding is a driver of bargaining power, since it leads to differentiation and consequently advertisers are willing to pay a premium price. Stipp (2012) provides two good examples on American television groups: ABC has used brand targeting to convince advertisers that younger audiences deserved higher “cost per thousand” prices for commercials; NBC was able to engage with three-fourths of the American population, through “Must See TV” branding campaign, transmitting shows to quality audience that many advertisers wanted to reach.23
Due to continuous changes in consumer preferences, these companies are now forced to rethink branding strategies (Stipp, 2012). Accordingly, Johnson (2012) emphasizes the need of establishing the fit between the brand and consumer needs.
Summing up, brand managers in B2B markets must focus on developing and communicating points of difference, with the ultimate goal of increasing the consumer base. The real challenge for B2B ad sales’ companies is to create distinctive selling strategies that fulfill the market expectations.
22 Good examples of media firms with advertiser-supported business models are Facebook and Google, which have
advertising as the foundation and major source of revenue. Brand equity is the ability of a brand to be recognized as uniquely superior in customer value (Keller, 1993).
3.2. Differentiation Strategies
There are a number of strategies that B2B companies can use to achieve differentiation in the market, aiming for the development of a niche strategy. McDowell (2004) provides a qualitative analysis, based on a 10-month evaluation of 200 B2B ads representing 62 American cable networks. The author categorizes seven commonly used differentiation strategies, covering the dimensions of targeted audience and diversity of program content.
The first differentiation strategy, named “affluence”, is based on statistical information concerning income and buying power of an audience. Then, connected to this strategy, the author mentions also targeted sex and age demographics as a good approach, in the search of profitable niches.
Another one consists of having a closer look at the intangibles of an audience, through targeted lifestyle or personality, taking into consideration its personal preferences. Several researchers emphasize the importance of this strategy: Andjelic (2008) shows that the exploitation of particular lifestyle channels enables reconnection with media agencies and advertising firms; Freeman (1999) refers to the differentiation from the other endless channels through the match of distinct personalities in television.
McDowell (2004) considered also unique audience behavior as a driver of differentiation, where the practical needs of advertisers are respected. One more strategy relies on the program inventories, where “the best off-network hits” remain successful in the long run.
Moreover, McDowell (2004) mentions the investment made in originality, particularly first-run programming. In this respect, Stipp (2012) establishes a direct relationship between lack of original content and decrease in brand perception, illustrating with advertiser-supported cable networks that have invested more and more in this attribute. Finally,
reputation is another differentiation strategy that can be used by well-established TV networks.
The above-mentioned strategies can be used separated or together to enhance brand power, depending on the targeted niche.
3.3. Branding and Brand Equity
Branding helps to offset competition by differentiating the service, allowing brand owners to charge a premium and fostering customer loyalty (Aaker, 1991). Its effectiveness mirrors an increase in the intangible value of the brand, that is, brand equity.
There is evidence that branding is important for marketers of B2B services. Davis, Golicic and Marquardt (2008) examined the effectiveness of branding on service providers. The authors used e-mail surveys to gather perceptions of logistics service providers and consumers in North America, and measured the extent in which brand equity affects the industry. Their findings provide evidence for the role of brand equity on B2B services, since companies cannot be distinguished on the basis of high performance alone.
Davis, Golicic and Marquardt (2008) also show the conceptualization of brand equity as a psychological asset, since a considerable amount of variation in brand equity can be explained by brand awareness and brand image. In this respect, Keller (2003) refers to the intangibility of branding as the only way of distinguishing brands.
Brand equity is the ability of a brand to be recognized as uniquely superior in customer value (Keller, 1993). This acknowledgment and identification with the brand goes beyond its functional value and include two important dimensions: brand awareness, which takes into account the familiarity with the brand name, and brand image, component that embraces the associations made behind the brand name.
Kapferer (1992) approaches brand equity as the “real capital of business”. Aaker (1991) considers price premium the best measure for brand equity. In an investigation carried
out by Prasad and Dev (2000) regarding hotel chains brand equity, a random sample measurement of brand equity was done via consumer’s rating of the brand. The authors found a positive relationship between brand equity and financial performance. Hotels with stronger brand equity concentrated higher occupancy rates, due to the price-value relationships perceived.
Brand equity is ultimately a source of customer retention. Gordon, Calantone and di Benedetto (1993) studied the evolution of brand equity in the electrical components industry, basing the analysis on Aaker’s (1991) brand equity framework. The researchers provide evidence about the impact of brand equity on increased purchase frequency. About 96% of the analyzed purchases involved only two brands, revealing also strong brand loyalty.
3.3.1. Brand Awareness and Brand Image
As an important measure of brand equity, brand awareness is essentially the extent to which consumers are able to recognize or recall the brand under different circumstances (Aaker, 1996). It is a long process, built with the aim of achieving sales results through brand knowledge and favorability (Keller, 1993).
Brands with higher levels of awareness in any industry increase their probability of being chosen over rival unknown brands (Aaker, 1991). The consumer’s ability to recognize a brand name is central to purchasing decision-making. Awareness, even though, does not necessarily mean that the consumer must be able to recall a specific brand name, but the consumer must be able to recall enough distinguishing features for proceeding to purchase. Webster and Keller (2004) point out firm’s technical competence and reputation as features that the brand must relentlessly embrace to increase the profit potential.
Brand image comprises the link between the brand and favorable attributes in the minds of consumers (Aaker, 1996). It is developed over time through advertising campaigns with a consistent theme, and is authenticated through the consumers' direct experience.
These distinctive associations of a service firm’s brand are usually enhanced through strong customer orientation and investment in customer-valued innovation, enabling consumers to better understand a service offering and reducing their perceived risks, looking forward to build a long-term, trust-based relationship (Berry, 2000). The Ritz-Carlton hotel chain, for instance, empowers its brand by creating personal experiences for the guests and embraces a four-step innovation process as underlying brand’s value proposition.
According to Davis, Golicic and Marquardt’s (2008) findings, the fact that the performance of a firm is associated with brand’s name not only distinguishes the firm from competitors, but also recognizes superior value in a service. The authors highlight the need of developing a consistent brand image, to make business consumers willing to pay more.
3.4. Literature Debriefing
Researchers have focused mostly on qualitative studies about media branding. Despite the increasing emphasis on television branding in the last few years, academic studies are still scarce in this field. According to Bellamy and Traudt (2000), there are two valid reasons for this: the rapid industry change, which has only recently begun to recognize the need of branding in the crowded television marketplace, and the long-held idea that branding strategy meant little in an oligopolistic market structure.
As well as television branding, B2B advertising sales have not been a priority for researchers. For example, McDowell (2004) has found a huge lack of information on B2B advertising, even regarding qualitative studies, and has broken new ground developing one, to serve as basis for future quantitative studies.
The way this thesis fits the existing literature relies on understanding how branding and underlying aspects enable the business to prosper, looking in particular into ad sales.
Summing up, the objective of this thesis is to lower the research gap in such an underdeveloped topic, particularly when it comes to quantitative approach, which is
elaborated in the Methodology section. Accordingly, the basic research question can be stated as follows: How does branding influence B2B advertising sales within television market?
4. Methodology
As rebranding decisions are intended to increase the revenues for the firms, the success and economic rationale behind must be evaluated. To quantify the rebranding effects on Fox Comedy, two distinct analyses are explored.
A regression analysis is carried out in subsection 4.1, examining the different variables within the firm to assess the impact of Fox Comedy’s rebranding on its advertising sales. The regression evaluates the behavior of those variables before and after the rebranding. Moreover, we present a forecasting model in subsection 4.2. In addition to help explaining the monthly fluctuation of Fox Comedy ad sales, the forecasting model also helps to forecast how ad sales may evolve after rebranding. Therefore, the two analyses are complementary.
4.1. Regression Analysis
The regression analysis aims to investigate the impact of the rebranding process on advertising sales, gathered by Fox Comedy, as it is one of the main revenue sources of the firm. We use SOI (share of investment in advertising).24 SOI has the advantage of comparing
the performance of one channel to the rest of the group, removing from the analysis variations in the business size.
In addition, we isolate Fox Comedy’s SOA, since it is an important driver of B2B advertising sales, as discussed in subsections 2.2 and 3.1. The management of Fox Comedy, particularly ad sales, depends largely on SOA, and vice-versa, thus this variable (and
24 SOI is a percentage value that accounts for the amount of revenues derived from ad sales in the TV channel compared to
the total amount of revenues derived from ad sales in the group’s TV channels. For the computation of revenues derived from ad sales in the group, the TV channels considered were the representative ones: Fox, Fox Life, Fox Comedy, Fox Movies, Fox Crime, National Geographic Channel and 24 Kitchen.
respective rebranding effects) must be properly studied having in mind the problem of endogeneity.25
In this sense, we use OLS (ordinary least squares) and 2SLS (two-stage least squares), to investigate the impacts of rebranding on both SOI and SOA.
4.1.1. Methods
To investigate the effects of rebranding, we estimate the following OLS regression: 𝑌! = 𝛼 + 𝜆𝑅𝑒𝑏𝑟𝑎𝑛𝑑𝑖𝑛𝑔!+ 𝛽!𝑋!"+ 𝑌𝑒𝑎𝑟 𝐹𝑖𝑥𝑒𝑑 𝐸𝑓𝑓𝑒𝑐𝑡𝑠 + 𝜀! (1) Let 𝑌! assume the value of SOI in month 𝑡 and 𝑋!" represent the 𝑖 regressors that influence 𝑌! in month 𝑡. 𝜀! is the error term, which contains all the other (unobserved) factors besides 𝑋!" that determine the value of 𝑌!. We include also year fixed effects, which account for time trends and avoid its influence in the results.
The model has to be such that one can differentiate the behavior of the variables before and after the rebranding, so we create a dummy variable, 𝑅𝑒𝑏𝑟𝑎𝑛𝑑𝑖𝑛𝑔!, to indicate
whether the TV channel rebrands in month 𝑡. Assuming that Fox Comedy rebrands in month 𝜏!, we assign 𝑅𝑒𝑏𝑟𝑎𝑛𝑑𝑖𝑛𝑔! = 1 after the rebranding (i.e., 𝑡 > 𝜏!) and 𝑅𝑒𝑏𝑟𝑎𝑛𝑑𝑖𝑛𝑔!= 0 before the rebranding (i.e., 𝑡 < 𝜏!).26 𝜆 is the average effect of rebranding on 𝑌!.
To address a potential problem of endogeneity, we use equation (1) to estimate both Fox Comedy’s SOA and SOI, on a two-staged process (2SLS). As SOI and SOA involve different dynamics, we use distinct explanatory variables for each.
25 The problem of endogeneity occurs whenever an explanatory variable is correlated with the error term. Simultaneous
causality, which is the case, is one of the possible causes behind this problem, and ignoring it can possibly bias the estimate.
26 We drop the month of the rebranding because the data for November 2015 disregards the influence of FX or Fox Comedy
4.1.2. Discussion of Results
Data
All the observations were provided by FNG and range monthly between January 2012 and October 2016. The summary statistics for the sample and sub-samples can be found in table B.1 in the appendix.27 There is also a description of the variables in use in table B.2 in the appendix.
The data presents some limitations in terms of size, since the variables have different time frames, and shortening some of them is the only way of having homogeneity concerning the starting dates. It has also the limitations of having too much zero values and scant data to analyze post-rebranding.28 Moreover, due to confidentiality terms, we work only with data in relative not absolute value.
Impact of Rebranding on SOA
Resorting to Regression tool from Data Analysis ToolPak, different types of models are tested.29 To investigate the endogeneity of SOA, we start by running the first stage of the 2SLS method, complementing the analysis with Hausmann test and weak instrument test. Results are provided in table B.3 in the appendix.
Within this first stage, we explore the determinants of SOA, with rebranding being the variable of interest along with SOI. Our empirical results reveal that rebranding positively influences the share of audiences and is significant at 10% level.
It is also interesting to observe that the coefficient of SOI is positive and significant at 1%. This means that SOI can help boosting the audiences, through conversion of revenues
27 To assure there is no multicollinearity in the data, we also explore potential correlations between the X variables.
28 Regarding SOA values, we have some zero values on FX, since the audience counting process is limited to a small sample
of the Portuguese population, thus it’s not hard that a little-known channel like FX doesn’t have records over time.
29 The models that prevailed for all the methods were lin-lin, even comparing to lin-squared. Note that for using logarithmic
into a higher budget of programming purchases. This programming component is reflected on the rebranding coefficient, having also an important role in increasing SOA.
Furthermore, young adult and senior viewers contribute significantly to the increase of SOA, as well as “High Status” viewers. Thus, the programming strategy must target these segments, as discussed in subsection 3.2. In contrast, “Low Status” viewers have a negative influence on SOA, since it’s not the target of a refined cable TV channel like Fox Comedy.
OLS and 2SLS – Second Stage
We proceed to the second stage of 2SLS, testing at the same time the OLS method, in order to analyze the impact of different variables (including rebranding) on SOI.30 Table B.4 in the appendix shows both methods.
Even though the 𝑎𝑑𝑗𝑢𝑠𝑡𝑒𝑑 𝑅! is higher on 2SLS than on OLS, the Hausmann test
from the first stage doesn’t reject the null hypothesis, which supports no correlation between SOA (the potential endogenous variable) and the error term.31 Moreover, the coefficients between 2SLS and OLS are very close to each other and the p-values represent the same significance to the model. The models are jointly significant at 1% significance level.
Based on our regression analysis, SOA is an important variable to explain SOI, because SOA’s coefficients are positive and also significant at 10%. This is consistent with our previous discussion. Marketing has also a determinant role on SOI’s increase, reflex of the assignment of the majority of FNG’s marketing budget to the rebranding process. Finally, despite of the positive coefficients, rebranding doesn’t have a direct influence on SOI, due to the non-significance in both methods.
As a result of the estimated regression functions, one can conclude that rebranding positively affects the audience levels and indirectly the advertising sales. The effects of Fox
30 On the 2SLS method (second stage), instead of the original SOA data, we use the predicted SOA from the first stage. 31 The 𝑎𝑑𝑗𝑢𝑠𝑡𝑒𝑑 𝑅! is a modified version of 𝑅! that has been adjusted for the number of regressors in the model. The
𝑎𝑑𝑗𝑢𝑠𝑡𝑒𝑑 𝑅! increases with a new regressor only if it improves the model more than would be expected by chance. Both
Comedy’s rebranding are embedded in specific divisions of the TV channel. Accordingly, the main drivers of SOI are marketing expenses and SOA, where the latter incorporates the most of the rebranding effect.
It’s important to highlight that the rebranding process has only been reflected in 11 months, meaning that its effect can still be not spread enough. The next subsection assesses this effect’s potential to increase in the future, regarding advertising sales.
4.2. Forecasting Model
The forecasting model allows us to understand how the Fox Comedy’s ad sales evolved before the rebranding and to what extent its direction or magnitude has subsequently been modified in the TV channel.32 It unveils the variation of Fox Comedy’s SOI, and identify certain patterns, developing a forecast for the chosen periods to come.33
4.2.1. Methods
There are several types of univariate time series methods. The goal is to assess which method fits better the data of Fox Comedy, thus providing the most reasonable forecast. The selection criteria used to determine which of the methods is the most accurate include the MSE and the MAD.34
Testing stationarity is important to statistically learn from time series data. Thus, we investigate whether our time series is stationary or not.35 We apply an indirect test for the
32 A forecasting model is an analytical procedure used to extrapolate data from the past to the future, taking into account the
behaviour of a designated variable in time. The methodology used to forecast is time series analysis, which is a powerful tool for analyzing economic variables ordered in series that are equally spaced over time.
33 The viability of the model is not always a guarantee, since there are several intrinsic factors affecting the accuracy of the
model, such as inherent randomness and unpredictable behavior of human beings.
34 MSE stands for mean square error, and is arguably the most important criterion used to measure the performance of an
estimator; it is also easier to calculate. It averages the squares of the errors (difference between the estimator and what is estimated). MAD stands for mean absolute deviation, and is a measure of by how much the values in the data set are likely to differ from their mean. It averages the absolute values of the errors. The absolute value is used to avoid deviations with opposite signs cancelling each other out. Moreover, MAPE (mean absolute percentage error) is the average of the forecast errors divided by the respective observed values, so if the original series has records equal to zero, which is the case, it’s impossible to analyze.
35 Time series are classified as stationary when statistical properties, such as mean and variance, are constant over time; the
existence of a unit root, which is Augmented Dickey-Fuller (ADF).36 Basically, what we are testing is whether or not we can reject the null hypothesis, which says that we have a unit root, i.e., that the series is nonstationary. To choose the max lag order (𝑙!"#) we use Schwert
criteria.
Many series exhibit either trend and/or seasonal effects. Decomposition procedures are then used to describe the trend and seasonal factors. We use the decomposition method to estimate the seasonally adjusted SOI values and separate the underlying pattern in the data series from randomness.37
When the time series is stationary, moving average or simple exponential smoothing are some of the most appropriate methods. Yet as these techniques use some average of the previous values to forecast future values, they consistently underestimate the actual values when there is an upward trend in the data. Therefore, when the time series is nonstationary and exhibits clear trend, one should use instead double exponential smoothing, Holt-Winter’s method (addressing seasonal effects) or deseasonalized trend models. We can also transform the nonstationary data into stationary, through random walk model, and produce forecasts therefrom.
Double Exponential Smoothing (Holt’s Method)
Double exponential smoothing is often an effective forecasting tool for dealing explicitly with nonstationary data that exhibits upward or downward linear trend. Let 𝑌! be
the predicted value of the time series in period 𝑡. After observing the value of the time series at period 𝑡 (𝑌!), the method calculates an estimate of the expected level of the time series (𝐸!) and the expected change (trend) per period (𝑇!). It has a smoothing constant (𝛼) associated to
time at which the series is observed. So time series with trends or seasonality are not stationary – the trend and seasonality will affect the value of the time series at different times.
36 Unit root is a feature of stochastic processes that can cause problems in statistical inference involving time series models. 37 As our data has a time frame of less than 5 years, the cyclicality and the error components are disregarded in our analysis.
The cyclic pattern is usually of at least 2 years and isn’t visible when analysing data for a period inferior to 5 years. Additionally, to accurately state that a change in the data pattern was caused by the error component, a minimum time frame of 10 years is necessary.
the level, and another smoothing parameter (𝛽) relative to the trend term. The level component together with the trend component represent where the series should be at time 𝑡 (except for noise).38
The forecasting function in Holt’s method assumes the following form:
𝑌!!! = 𝐸!+ 𝑛𝑇! (2) where
𝐸!= 𝛼𝑌!+ (1 − 𝛼)(𝐸!!!+ 𝑇!!!) (2a) 𝑇! = 𝛽 𝐸!− 𝐸!!! + (1 − 𝛽)𝑇!!! (2b) where 0 ≤ 𝛼 ≤ 1 and 0 ≤ 𝛽 ≤ 1.
We can use equation (2) to obtain forecasts for 𝑛 time periods, where 𝑛 = 1, 2, 3, and so on.
Holt-Winter’s Method for Additive Seasonal Effects
In addition to having a trend, nonstationary data may also exhibit seasonal effects, which can be either additive or multiplicative. Additive seasonal effects tend to be on the same order of magnitude each time a given season is encountered, whereas multiplicative seasonal effects tend to have an increasing effect.39
Holt-Winter’s method addresses not only trend but also seasonality. It has a component that represents the deseasonalized estimate of the expected level of time series. A seasonal factor for period 𝑡 (𝑆!) is thus added, having also a smoothing parameter (𝛾) associated. To demonstrate this technique for coping with additive seasonal effects, let 𝑝 represent the number of seasons in the time series. The forecasting function is given by:
𝑌!!! = 𝐸!+ 𝑛𝑇!+ 𝑆!!!!! (3) where
38 Noise is unexplained variation or randomness in the data.
39 Once the data has zero values, which is the case, it’s mathematically unfeasible to run Holt-Winter’s method for
𝐸!= 𝛼(𝑌!− 𝑆!!!) + (1 − 𝛼)(𝐸!!!+ 𝑇!!!) (3a) 𝑇! = 𝛽 𝐸!− 𝐸!!! + (1 − 𝛽)𝑇!!! (3b) 𝑆! = 𝛾 𝑌!− 𝐸! + (1 − 𝛾)𝑆!!! (3c)
where 0 ≤ 𝛼 ≤ 1, 0 ≤ 𝛽 ≤ 1 and 0 ≤ 𝛾 ≤ 1.
Equation (3) can be used to forecast 𝑛 time periods where 𝑛 = 1,2, … , 𝑝.
Quadratic Trend Model with Multiplicative Seasonal Indices
While the linear regression is conditioned on the basic trend, quadratic trend model addresses curvature in the series, which is often more realistic. Quadratic trend model allows us to see how to use time as an independent variable. Accordingly, the estimated regression function for this forecasting method is:
𝑌! = 𝑏!+ 𝑏!𝑋!! + 𝑏!𝑋!! (4)
where 𝑋!! = 𝑡 and 𝑋!! = 𝑡!.
In order to increase the accuracy of our forecasts, we can determine seasonal indices representing the average amount by which the observations in a given season (month) fall above or below the trend line. We compute the optimal values of the multiplicative seasonal indices and the parameters of the quadratic trend model, and we multiply our trend projections by these indices, thus addressing multiplicative seasonal effects.
Random Walk Model
Random walk model deals with nonstationarity by taking the first difference (𝐹!) of the original series for period t. It judges the randomness of the first difference, to assess if the original series can assume a random walk process, that is, transformation from nonstationarity to purely random behavior. To support that, the standard deviation of the first difference (𝜎!) has to be smaller than the standard deviation of the original series (𝜎!).
The forecasting function in random walk model assumes the following form:
𝑌!!! = 𝑌!+ 𝑛𝐹 (5) We can use equation (5) to obtain forecasts for 𝑛 time periods, where 𝑛 = 1, 2, 3, and so on.
Note that this model deals with stochastic trend, where the change of the underlying variable is subject to a random variation. Deterministic trend model is not always appropriate, depending on the data size.40
4.2.2. Discussion of Results
Analysis of the original series
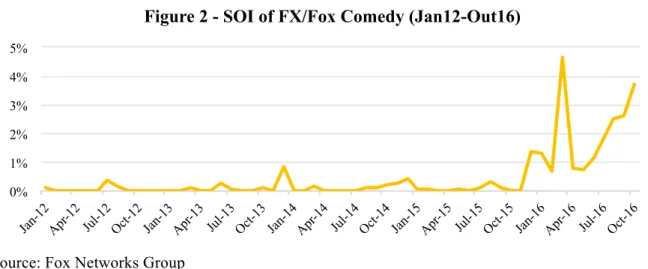
FNG has tracked FX/Fox Comedy’s SOI for the last 58 months. The data is split into monthly time units, which is reasonable since investments don’t necessarily occur in all weeks and are distributed across different moments within the respective months. This prevents the model from unpredictable noise.
The first step is to take a look at the original series of Fox Comedy. Figure 2 shows the evolution of SOI in Fox Comedy (FX until November 2015), from January 2012 to October 2016.
Source: Fox Networks Group
40 It may be hard to identify multiple structural breaks in the deterministic trend when the sample size is small, which is the
case. In addition, implementing endogenous multiple structural break tests is a demanding exercise. Therefore, using stochastic trends instead of deterministic trends is sometimes more reasonable.
0% 1% 2% 3% 4% 5%
Jan-12 Apr-12 Jul-12 Oct-12 Jan-13 Apr-13 Jul-13 Oct-13 Jan-14 Apr-14 Jul-14 Oct-14 Jan-15 Apr-15 Jul-15 Oct-15 Jan-16 Apr-16 Jul-16 Oct-16
It seems that there is an upward trend in the series. The rebranding in November 2015 have led to a shock in the series, where Fox Comedy’s SOI increased its intensity of growth, reaching in October 2016 3,73% of total FNG. Furthermore, the series seems to exhibit seasonality, having some peaks in December.
The data presents limitations in terms of size and magnitude, since FX didn’t gather much investment from advertisers, registering zero values in 25 months. There is also noise in the original series, which is important to keep under attention. Therefore, in order to assure accuracy in the model, the forecasted results are for the short to medium term (12 months).41
Using Excel’s ADF Function, we test the stationarity of the series (see table C.1 in the appendix, and related text). We choose 10 for the max lag order, which is the most appropriate according to the Schwert criteria. The p-values are higher than the significance level of 5% (or the t-statistics are higher than the respective critical values), which make us conclude that, for all the different test versions of Augmented Dickey-Fuller, we cannot reject the null hypothesis of nonstationarity.42 Due to the apparent trend and seasonality in the data, it’s not surprising that our data has to be treated as nonstationary time series.
Methods discussion
To judge the effectiveness of each method, a spreadsheet model was developed. Resorting to Excel’s Solver function, the MSE and MAD values were minimized. Table C.2 in the appendix shows the MSE and MAD values for the alternative forecasting methods, including also other than those detailed in subsection 4.2.1. In line with previous discussion on this subsection, the methods we apply regard nonstationarity.
As an estimate of a regression function, the quadratic trend presents a higher 𝑅! when
comparing to the linear trend (0,69 against only 0,45), under seasonally adjusted data. After
41 In addition, as the forecast horizon lengthens, the confidence in the accuracy of the forecasts diminishes because there is no
guarantee that the historical data on which the model is based will continue indefinitely into the future.
42 We also use the ADF test version of “Constant+Trend” and “Const.+Trend+Trend2”, since the original series appears to
applying the multiplicative seasonal indices to the quadratic trend (see figure C.1 in the appendix), its measures of error are fairly sizable.
Regarding the random walk model, the ADF test is run after taking the first difference and proves the data is difference-stationary (see table C.3 in the appendix). The first difference series looks reasonably random (see figure C.2 in the appendix), providing support for a random walk process, and 𝜎! is smaller than 𝜎!, even though not much. Random walk model presents also a sizable MSE, and it isn’t clear whether the forecasts will be of much help to Fox Comedy’s management (see figure C.3 in the appendix). More accurate forecasts may not be possible because of the existing noise in SOI series.
Holt’s method assigns the maximum weight to the trend component, tracking pretty well the last months’ growth in the channel, since the behavior of SOI on FX doesn’t have that much impact on today’s Fox Comedy performance. Seasonality is not very strong, which makes it more appropriate than Holt-Winter’s method (see figure C.4 in the appendix).
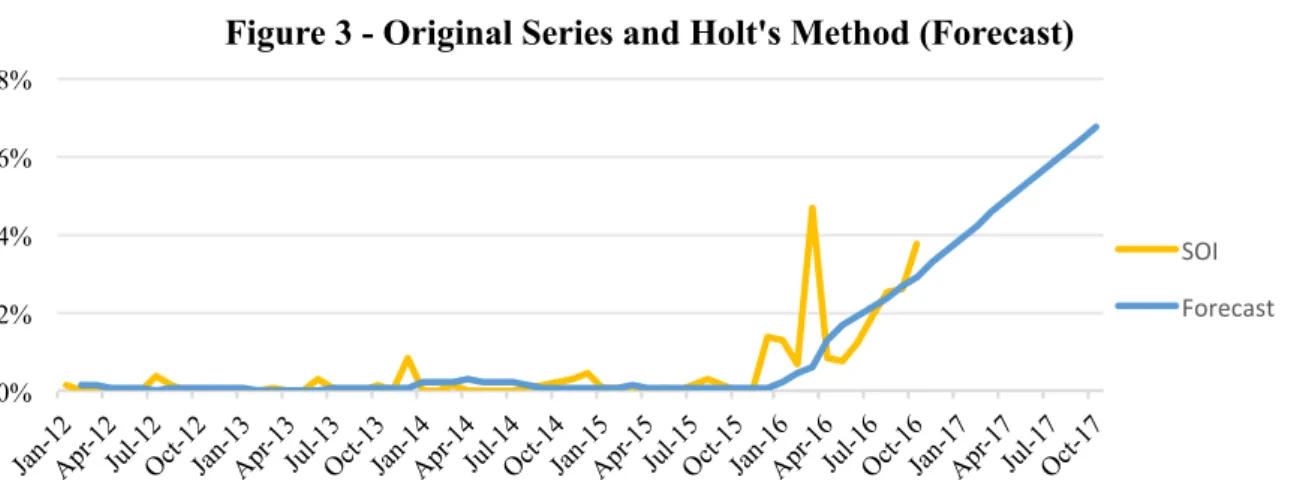
From table C.2 in the appendix, we conclude that Holt’s method provides the most accurate explanation of past Fox Comedy’s SOI. As such we proceed to forecast Fox Comedy’s SOI using this method. Figure 3 shows both the original series and the best forecasting method. Holt’s method seems to be doing very well with this data set, tracking the data closely, and accurately projecting the upward trend.
0% 2% 4% 6% 8%
Jan-12 Apr-12 Jul-12 Oct-12 Jan-13 Apr-13 Jul-13 Oct-13 Jan-14 Apr-14 Jul-14 Oct-14 Jan-15 Apr-15 Jul-15 Oct-15 Jan-16 Apr-16 Jul-16 Oct-16 Jan-17 Apr-17 Jul-17 Oct-17
Figure 3 - Original Series and Holt's Method (Forecast)
SOI Forecast
Projections for November 2016 to October 2017
Based on the Holt’s method, Fox Comedy will continuously to increase its SOI in the group within the next 12 months (see table C.4 in the appendix). It’s expected that it occurs at a fast pace, which can be justified by the acceleration occurred from December 2015 on (after the rebranding). The TV channel’s SOI is expected to be 3,30% in November 2016 and grow to 6,77% until October 2017 (+3,04 p.p. vis-à-vis the same month of 2015), at an increasingly lower growth rate. This is a reflex of the channel’s development, after a successful rebranding that has made Fox Comedy better recognized in the market.
5. Conclusions
This thesis has implications for the branding literature by measuring the impact of rebranding on the investment in advertising, after accounting for a variety of observable and unobservable factors. Another important contribution is the projection of the investment in advertising into the future, again taking into consideration the influence of rebranding.
Both regression analysis and forecasting model favorably estimate the impact of rebranding. The key outcome of the regression analysis is that rebranding positively impacts SOI via SOA. From the forecasting model, we conclude that the predictions are upward trendy due to the jump in the series fostered by the rebranding process.
In summary, we provide the first steps in a more complete understanding of rebranding – a topic that has limited empirical research in marketing. We expect that our analysis of Fox Comedy to assessing the impact of rebranding, particularly on B2B ad sales, will open the doors for similar research in any sector of the economy.
References
Aaker, D. A. 1991. Managing brand equity. New York: Free Press.
Aaker, D. A. 1996. “Measuring brand equity across products and markets”. California
Management Review, 38(3), 102-20.
Amador, J. & Soares, A. C. 2012. “Competition in the Portuguese Economy: An overview
of classical indicators”, Banco de Portugal.
ANACOM. 2016. “Serviço de televisão por subscrição – 2.º Trimestre de 2016”.
Andjelic, A. 2008. “Transformations in the Media Industry: Customization and Branding as
Strategic Choices for Media Firms”. Management and Innovation in the Media Industry.
Bellamy, R. V., & Traudt, P. J. 2000. “Television Branding as Promotion”. Research in
Media Promotion, 127-159.
Berry, L. L. 2000. “Cultivating service brand equity”. Journal of the Academy of Marketing
Science, 28(1), 128−137.
Chan-Olmsted, S. 2011. “Media Branding in a Changing World: Challenges and
Opportunities 2.0”, International Journal on Media Management, 13:1, 3-19.
Davis, D. F., Golicic, S. L., & Marquardt, A. J. 2008. “Branding a B2B service: Does a
brand differentiate a logistics service provider?”. Industrial Marketing Management, 37, 218– 227.
Freeman, L. 1999. “On TV, image is everything”. Electronic Media, 18.
Gordon, G. L., Calantone, R. J., & di Benedetto, C. A. 1993. “Brand equity in the
business-to-business sector: An exploratory study”. Journal of Product & Brand Management, 2(3), 4−16.
Johnson, C. 2012. Branding Television. New York.
Kapferer, J. 1992. Strategic brand management and new approaches to creating and
Keller, K. L. 1993. “Conceptualizing, measuring, and managing customer-based brand
equity”. Journal of Marketing, 57, 1–22.
Keller, K. L. 2003. Strategic brand management: Building, measuring and managing brand
equity. Upper Saddle River, NJ: Prentice Hall.
McDowell, W. S. 2004. “Selling the Niche: A Qualitative Content Analysis of Cable
Network Business-to-Business Advertising”. The International Journal on Media Management, 6(3&4), 217–225.
Oliveira, P. P. 2014. “Portuguese Media”. BPI Equity Research.
Prasad, K., & Dev, C. S. 2000. “Managing hotel brand equity: A customer-centric
framework for assessing performance”. Cornell Hotel and Restaurant Administration Quarterly, 41(3), 22-31.
PwC. 2013. “Portugal Entertainment and Media Outlook: 2013-2017”, 14th edition.
Sobral, F. A. 2012. “Televisão em Contexto Português: uma abordagem histórica e
prospetiva”. Millenium, 42, 143-159.
Stipp, H. 2012. “The Branding of Television Networks: Lessons From Branding Strategies in
the U.S. Market”, International Journal on Media Management, 14:2, 107-119.
Tsai, Y.-L., Dev, C. S., & Chintagunta, P. 2015. “What’s in a Brand Name? Assessing the
Impact of Rebranding in the Hospitality Industry”. Journal of Marketing Research, 52:6, 865-878.
Webster, F. E., Jr., & Keller, K. L. 2004. “A roadmap for branding in industrial markets”.