Association between Framingham risk score and metabolic
syndrome in elderly
Juliana Mezzomo*, Bruna Cocco Pilar**, Patrícia Maurer***, Vanusa Manfredini****, Graziela Morgana Silva Tavares*****, Jacqueline da Costa Escobar Piccoli******
* Specialization in Health Sciences, Federal University of Pampa. Uruguaiana, RS, Brazil. E-mail: [email protected]
** Post-graduate Program in Biochemistry, Federal University of Pampa. Uruguaiana, RS, Brazil. E- mail: [email protected]
*** Post-graduate Program in Biochemistry, Federal University of Pampa. Uruguaiana, RS, Brazil. E-mail: [email protected]
**** Teacher in Federal University of Pampa. Uruguaiana, RS, Brazil. E-mail: [email protected] ***** Teacher in Federal University of Pampa. Uruguaiana, RS, Brazil. E-mail: [email protected] ****** Teacher in Federal University of Pampa. Uruguaiana, RS. Brazil. Mailing address: Unipampa, Campus Uruguaiana, BR 472 - Km 592 - Caixa Postal 118 – Uruguaiana, RS, Brazil – Postal Code: 97500-970. E-mail: [email protected]
http://dx.doi.org/10.5335/rbceh.v13i2.5467
Recebido em: 07/10/2016. Aceito em: 18/08/2016.
Abstract
Metabolic syndrome is a set of factors that can increase the mortality from cardiovascular disease. Thus, knowledge about the prevalence of MS in the elderly is important, since the risk factors tend to increase significantly with age. The aim of this study is analyze the prevalence of metabolic syndrome (MS) among elderly according to the IDF and NCEP criteria and determining its relation to Framingham Risk Score (FRS). Elderly people (60 years old or older) of both genders participated in the study. Volunteers signed a TCLE and were interviewed, as well as physical exams. The biochemical analyzis were performed on an automated analyzer LABTEST, LabMax 240 model with biochemical reagents Labtest brand. For the diagnosis of MS NCEP and IDF criteria were used and cardiovascular risk was estimated by calculating the FRS. Descriptive statistics were performed, chi-square test for ordinal variables and ANOVA or Student-t test for quantitative data. Multivariate analysis was performed by logistic regression (backward conditional method). Differences were
considered statistically significant at p ≤ 0.05. The overall prevalence of MS found in the sample following the NCEP and IDF criteria was 55.8% and 60.8%, respectively. No associations were found between gender and diagnostic criteria. Individuals with high+moderate FRS had a higher risk of developing MS compared to those with low FRS. Logistic regression analysis showed an independent association of abdominal adiposity by the IDF criteria (OR 4.8, CI 1.0- 22.1; p = 0.04) and glycemia by NCEP criteria (OR 3.0, CI 1.1-8.4; p = 0.03) with moderate+high FRS. The prevalence of MS was high under both criteria, being more predominant in those patients with moderate+high FRS. Thus, the components of MS abdominal adiposity and glucose levels were associated with increased CRF, indicating that the control of these factors can be decisive in reducing cardiovascular risk in the elderly.
Keywords: Aging. Cardiovascular Diseases.
Introduction
Brazil was elevated to fifth most populous country in the world and has shown an increasing number of seniors. According to the Brazilian Institute of Geography and Statistics (IBGE), the country is on the list of the ten countries with the highest population of elderly people in world absolute terms. Supported by longer life expectancy, the number of Brazilians over 65 should quadruple in the next 20 years, confirming the accelerated aging trend of the population already pointed out by demographers. According to IBGE, the population in this age group should increase from 22.9 million (11.34% of the population) in 2013 to 88.6 million (39.2% of the population) in 2033 (INSTITUTO BRASILEIRO DE GEOGRAFIA E ESTATÍSTICA, 2013).
Population aging is an increasingly evident and relevant phenomenon to the world society. With the rise of life expectancy, there are changes in the demographic profile of developing countries, noticing an increase in the number of people in older age groups, a factor that causes concerns in referring to health and elderly population’s life quality (ATHYROS et al., 2005). In addition to that, we observe changes in the epidemiology of the major causes of illness and mortality rates, being the cardiovascular diseases the most prevalent (CABRERA et al., 2007).
Among cardiovascular conditions that cause morti-morbidity, one in particular has received highlight due to the complex mechanism whereby it
causes deleterious effects to the human body by associating cardiovascular risk factors with central fat deposition and especially insulin resistance, Metabolic Syndrome (MS) (ECKEL; GRUNDY; ZIMMET, 2005).
The MS is a multifactorial disorder that is growing fast, becoming a great concern. This syndrome consists of a number of cardiovascular risk factors such as hypertension, abdominal obesity, high triglycerides, decreased of high density lipoproteins (HDL-C) and glucose intolerance/type 2 diabetes (BRANDÃO et al., 2005).
Knowing that the MS can increase CVD mortality by 2.5 times and total mortality in approximately 1.5 times (BRANDÃO et al., 2005), the knowledge about its prevalence in elderly people is an important contribution to public health, since it tends to increase significantly with advancing age (RAVAGLIA et al., 2006).
While MS is already recognized as an important means of high risk identification for mortality in patients, the criteria for its diagnosis are still discussion agenda in the scientific community and the main goal is to seek the best way to diagnose it as early as possible. Thus, settings such as the National Cholesterol Education Program Adult Treatment Panel III (NCEP-ATPIII) and the International Diabetes Federation (IDF) are widely used to aid in the MS diagnosis. The definition of the NCEP-ATPIII is recommended as a diagnostic method by the I Brazilian Guidelines for Diagnosis and Treatment
of MS, cause it has been developed for clinical use and does not require evidence of insulin resistance, as the OMS definition, which facilitates its practical use (NATIONAL CHOLESTEROL EDUCATION PROGRAM’, 2002; STERN et al., 2005). But the IDF (2006) has been considered as a diagnostic strategy to include the same NCEP-ATPIII criteria, requiring necessarily, however, abdominal obesity as an essential factor for the establishment of SM besides considering variations related to ethnic issues.
For many years it’s known a predic-tion formula in the general populapredic-tion, the probability of coronary heart disease, which is calculated based on the results of the Framingham Heart Study, a study initiated in 1948 in the city of Framin-gham in the United States. The results of this study provided the so-called Cardio-vascular Risk by the Framingham score, which allowed the identification of the main cardiovascular risk factors known today, such as arterial hypertension, high cholesterol, smoking, and others. From these factors it is possible to cal-culate the risk of myocardial infarction and angina pectoris in ten years. The risk is considered low when the score is less than 10%, moderate between 10 and 20%, and high when it is above 20% (LOTUFO, 2008; WUet al., 2016).
Geographic and economic factors mean that the population of Uruguaiana city (Rio Grande do Sul, Brazil) be very heterogeneous in its composition, since its population is made up of people from se-veral parts of Brazil and nearby countries like Argentina and Uruguay, causing the
local identity differentiated from other Rio Grande do Sul regions. In this way, and whereas it has not been established that the best criterion for the diagnosis of metabolic syndrome (MS), the aim of this study is analyze the prevalence of MS among according to the IDF and NCEP criteria and determining its relation to Framingham Risk Score (FRS).
Materials and methods
The study was an epidemiological design of the analytical cross-sectional observational where the prevalence of MS was determined according to the criteria of IDF and NCEP and their relationship was assessed with the FRS.
Seniors patients (≥ 60 years) who attented the Reference Center for Social Assistance (CRAS) in the city of Uruguaiana (RS) were recruited for the study. One hundred and twenty (120) seniors participated in the study, 15 were male and 105 were female. The elderly were invited to participate through posters in CRAS, inclusion criteria were age from 60 years, communication skills, and absence of previous diseases as cancer, stroke and thyroid disease.
The elderly volunteers signed a free and instructed agreement consent and answered a structured questionnaire. Data collection was performed by the same researcher. The evaluation of anthropometric profile was held at the interview moment and included: waist circumference (measured immediately below the last rib, at the narrowest place of the trunk [natural waist], with the
sub-ject in the supine position, as suggested by the Anthropometric Standardization Reference Manual) (LOHMAN; ROCHE; MARTOREL, 1988); height (measured using a portable stadiometer, with the individual upright with arms hanging at their sides, with their heels together and occipital and gluteal regions touching the vertical plane of the stadiometer – the result was shown in meters [m]); weight (as measured by a portable digital scale, with the barefoot guy - the result was indicated in kilograms [kg]).
With the results of weighing and me-asuring the height, the body mass index was calculated, using the equation: wei-ght (kg) / heiwei-ght (m²). The classification of nutritional status followed the reference specified by WHO (WORD HEALTH ORGANIZATION, 1997). Blood pressure (BP) was obtained from the measurement of systolic blood pressure (SBP) and diastolic (DBP), using a digital sphyg-momanometer. Individuals with SBP> 140mmHg and PAD> 90 were considered hypertensive (BRANDÃO et al., 2005).
For purposes of laboratory tests (total cholesterol, HDL cholesterol, triglycerides and glucose) a blood sample was collected after 12 hours of fasting, by a legally qualified professional for the procedure. For this, the volunteers remained seated with his arm resting on a support and had their garotted arm approximately at the midpoint of the humerus. Then there was the antisepsis of the collect site with an alcohol wipe and a disposable needle 25x8 mm was introduced in one of the veins of the antecubital fossa. Approximately 5 ml of blood was collected and transferred
to a tube without anticoagulant and gel separator (BD®). The biochemical analyzis were performed on an automated analyzer LABTEST, LabMax 240 model with biochemical reagents Labtest brand. All procedures outlined by the manufacturers of automated analyzer and reagents were followed.
MS was estimated using the criteria established by the NCEP-ATP III and the IDF and the cardiovascular risk for cardiovascular risk score of Framingham.
The MS description considered five parameters: waist circumference, systemic blood pressure and serum fasting glucose, TG and HDL-c, as two separate settings. The first, proposed by the NCEP-ATPIII in 2002, preconizes for the diagnosis of MS in the presence of at least three of the following criteria: waist circumference> 88 cm for women and> 102 cm for men, HDL-C <50 mg / dL for women or <40 mg / dL for men, TG ≥ 150 mg / dL, blood pressure ≥ 130/85 mmHg and fasting glucose ≥ 110 mg / dL. The second, proposed by IDF in 2005, reduces threshold values for fasting plasma glucose (≥ 100 mg / dL) and waist circumference (≥ 80 cm for women and ≥ 90 cm for men), and establish abdominal obesity as a crucial factor for diagnosis (15). Thus, abdominal obesity associated with two other factors listed in the NCEP establish the diagnosis of metabolic syndrome by IDF.
All the described procedures were performed in accordance with the gui-delines of the Declaration of Helsinki. Elderly people who agreed to participate in the study signed a free and informed consent form, which detailed all the
procedures to be realized for data collect, ensuring total anonymity. This research was approved by the Unipampa Resear-ch Ethics Committee under the number 284 295.
The limitations of this study were the recruitment of the elderly as all were recruited in a CRAS and the exclusion criteria just decreasing the sample size.
The data were analyzed in SPSS version 20.0 statistical program. Des-criptive statistics were performed as well as the following univariate tests: chi-square test for ordinal variables and analysis of variance or Student-t test for quantitative data. Multivariate analysis was performed by logistic regression (ba-ckward conditional method). Differences were considered statistically significant at P ≤ 0.05.
Results
One hundred and twenty (120) seniors participated in the study, with mean age of 75.1 ± 7.7 years, 15 (12.5%) were male and 105 (87.5%) were female. Regarding the classification of MS, it was found that 67 (55.8%) of elderly people had MS according to the NCEP-ATP III (MS-NCEP) and 73 (60.8%) elderly people presented MS according to the criteria of IDF (MS-IDF).
The average age in the MS-NCEP and IDF groups was 75.2 ± 7.5 years and 75.1 ± 7.6 years, respectively, with no statistical difference between the groups. Biochemical, anthropometric and hemodynamic markers of both groups are shown in Table 1 (MS-NCEP) and Table 2 (MS-IDF).
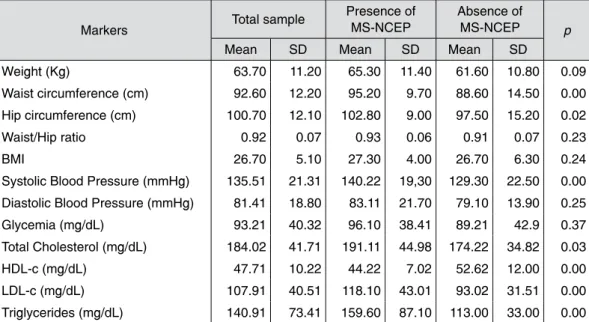
Table 1 – Biochemical, anthropometric, hemodynamic markers in the sample, according to the presence and absence of MS by NCEP-ATPIII
Markers Total sample
Presence of MS-NCEP
Absence of
MS-NCEP p
Mean SD Mean SD Mean SD
Weight (Kg) 63.70 11.20 65.30 11.40 61.60 10.80 0.09
Waist circumference (cm) 92.60 12.20 95.20 9.70 88.60 14.50 0.00
Hip circumference (cm) 100.70 12.10 102.80 9.00 97.50 15.20 0.02
Waist/Hip ratio 0.92 0.07 0.93 0.06 0.91 0.07 0.23
BMI 26.70 5.10 27.30 4.00 26.70 6.30 0.24
Systolic Blood Pressure (mmHg) 135.51 21.31 140.22 19,30 129.30 22.50 0.00
Diastolic Blood Pressure (mmHg) 81.41 18.80 83.11 21.70 79.10 13.90 0.25
Glycemia (mg/dL) 93.21 40.32 96.10 38.41 89.21 42.9 0.37
Total Cholesterol (mg/dL) 184.02 41.71 191.11 44.98 174.22 34.82 0.03
HDL-c (mg/dL) 47.71 10.22 44.22 7.02 52.62 12.00 0.00
LDL-c (mg/dL) 107.91 40.51 118.10 43.01 93.02 31.51 0.00
Triglycerides (mg/dL) 140.91 73.41 159.60 87.10 113.00 33.00 0.00
Note: BMI = Body Mass Index; HDL-c= High Density Lipoprotein, LDL-c= Low Density Lipoprotein.p = Chi-square test Source: authors’ elaboration.
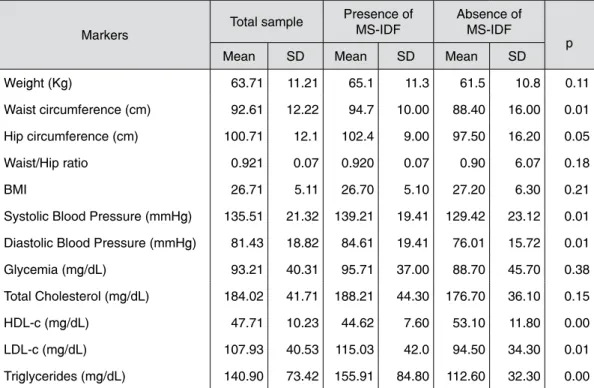
Table 2 – Biochemical, anthropometric, hemodynamic markers in the sample, according to the presence and absence of MS by IDF
Markers Total sample
Presence of MS-IDF
Absence of MS-IDF
p
Mean SD Mean SD Mean SD
Weight (Kg) 63.71 11.21 65.1 11.3 61.5 10.8 0.11
Waist circumference (cm) 92.61 12.22 94.7 10.00 88.40 16.00 0.01
Hip circumference (cm) 100.71 12.1 102.4 9.00 97.50 16.20 0.05
Waist/Hip ratio 0.921 0.07 0.920 0.07 0.90 6.07 0.18
BMI 26.71 5.11 26.70 5.10 27.20 6.30 0.21
Systolic Blood Pressure (mmHg) 135.51 21.32 139.21 19.41 129.42 23.12 0.01
Diastolic Blood Pressure (mmHg) 81.43 18.82 84.61 19.41 76.01 15.72 0.01
Glycemia (mg/dL) 93.21 40.31 95.71 37.00 88.70 45.70 0.38
Total Cholesterol (mg/dL) 184.02 41.71 188.21 44.30 176.70 36.10 0.15
HDL-c (mg/dL) 47.71 10.23 44.62 7.60 53.10 11.80 0.00
LDL-c (mg/dL) 107.93 40.53 115.03 42.0 94.50 34.30 0.01
Triglycerides (mg/dL) 140.90 73.42 155.91 84.80 112.60 32.30 0.00
Note: BMI = Body Mass Index; HDL-c= High Density Lipoprotein, LDL-c= Low Density Lipoprotein.p = Chi-square test. Source: authors’ elaboration.
MS-NCEP (p = 0.017) when compared to the group without MS-NCEP. Regarding the results obtained from patients diagnosed by the IDF criteria, it was found that older people with MS-IDF had higher average of waist circumference (p = 0.01) and hip (p = 0.05) and SBP compared with the group without MS-IDF (Table 2). In biochemical profile stood out the highest levels of LDL cholesterol and triglycerides and lower HDL-cholesterol levels in the group with MS-IDF compared to the group without MS-IDF.
There were not significant differences in both diagnostic, in glucose levels In analyzing the results of patients
diagnosed by the NCEP-ATP III criteria, there was a statistically significant difference in waist circumference (p = 0.006) and hip (p = 0.025) and SBP (p = 0.006), which were greater in the group with MS-NCEP when compared to the group without MS-NCEP. Besides, as expected, significant differences among the groups were detected as to the biochemical profile, where were verified higher levels of total cholesterol (p = 0.033), LDL-cholesterol (p = 0.002) and triglycerides (p = 0.001) in the group with MS-NCEP. HDL cholesterol was significantly lower in the group with
among the patients with and without MS (Tables 1 and 2).
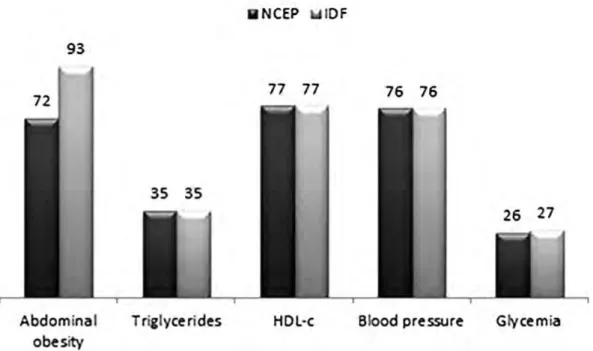
In the distribution of MS components according to the two diagnostic criteria used, NCEP-ATP III and IDF (Figure 1), it is noted that although 93 (77.5%) of seniors people presented altered waist
circumference by the IDF criteria, only 73 of them were confirmed with MS-IDF, a difference if it’s compared to the NCEP criteria, in which 72 (60%) seniors people presented increased waist circumference, being 67 with MS-NCEP diagnosed.
Figure 1 – Distribution of components of the metabolic syndrome according to the NCEP and IDF criteria
Source: authors’ elaboration.
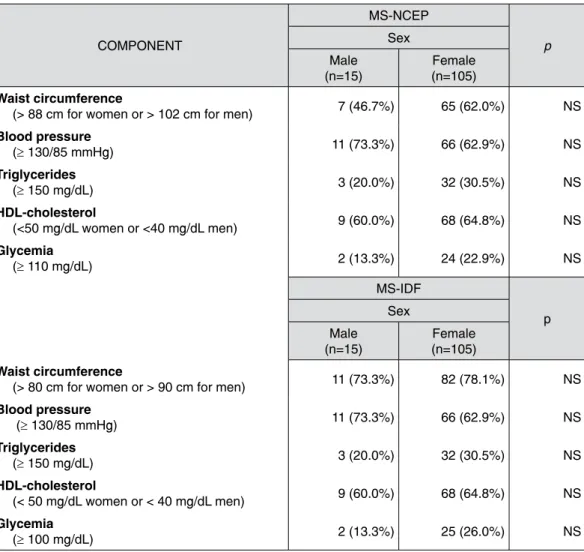
Regarding gender, 7 (46.7%) men and 60 (50.7%) women had MS-NCEP and 8 (53.3%) men and 65 (62%) women had MS-IDF. As the components of MS, there was a difference between the sexes only in waist circumference, where, as expected, the mean values were
significantly higher in males (107.6 ± 11.0 for NCEP and 106.5 ± 10.7 MS-IDF) than among women (93.7 ± 8.5 for MS-NCEP and 93.2 ± 8.9 for MS-IDF).
Table 3 shows the distribution of MS components by gender for patients diagnosed with MS and MS-NCEP-IDF.
Table 3 – Distribution of MS components by sex according to the NCEP and IDF criteria COMPONENT MS-NCEP p Sex Male (n=15) Female (n=105) Waist circumference
(> 88 cm for women or > 102 cm for men) 7 (46.7%) 65 (62.0%) NS
Blood pressure (≥ 130/85 mmHg) 11 (73.3%) 66 (62.9%) NS Triglycerides (≥ 150 mg/dL) 3 (20.0%) 32 (30.5%) NS HDL-cholesterol (<50 mg/dL women or <40 mg/dL men) 9 (60.0%) 68 (64.8%) NS Glycemia (≥ 110 mg/dL) 2 (13.3%) 24 (22.9%) NS MS-IDF p Sex Male (n=15) Female (n=105) Waist circumference
(> 80 cm for women or > 90 cm for men) 11 (73.3%) 82 (78.1%) NS
Blood pressure (≥ 130/85 mmHg) 11 (73.3%) 66 (62.9%) NS Triglycerides (≥ 150 mg/dL) 3 (20.0%) 32 (30.5%) NS HDL-cholesterol (< 50 mg/dL women or < 40 mg/dL men) 9 (60.0%) 68 (64.8%) NS Glycemia (≥ 100 mg/dL) 2 (13.3%) 25 (26.0%) NS
Note: p = Chi-square test or Fisher’s exact test. NS=not significant. Source: authors’ elaboration.
Table 4 presents the Framingham Risk Score (FRS) for MS-NCEP and MS-IDF criteria. To calculate the risk estimate, the classes of FRS were grouped into two groups: low FRS and FRS high + moderate, both compared to MS. Associations were found between high + moderate FRS and MS-NCEP (OR 3.9, CI 1.5 to 9.98; p = 0.003) and
MS-IDF (OR 3.8, CI 1.4 to 10.1; p = 0.006), ie, the group with high + moderate FRS had a higher risk of developing MS compared to those with low FRS. Of the 120 study participants, 60% had waist circumference increased by NCEP criteria and 77.5% by the IDF criteria, and 29.2% presented high triglycerides, which proves the positive diagnosis
of MS. To verify the independence of MS components in relation to the FRS, established a logistic regression model between high + moderate FRS and MS components: abnormal waist circumference MS-IDF (> 80 cm for women and > 90 cm for men), abnormal waist circumference MS-NCEP (> 88 cm for women and > 102 cm for men), impaired glucose MS-IDF (≥ 100 mg /
dL), altered glucose MS-NCEP (≥ 110 mg / dl), altered TGD (≥ 150 mg / dL), low HDL (<50 mg / dL for women and <40 mg / dL for men) and hypertension (≥ 130/85 mmHg). This analysis demonstrated an independent association of abdominal obesity by the IDF criterion (OR 4.8, CI 1.0 to 22.1; p = 0.04) and blood glucose by the NCEP criterion (OR 3.0, CI 1.1 to 8,4, p = 0.03) with moderate + high FRS.
Table 4 – Framingham Risk Score and two diagnostic criteria of MS (NCEP-ATPIII and IDF) Framingham risk Score MS-NCEP MS-IDF Presence (n = 67) Absence (n = 53) p Presence (n = 73) Absence (n = 47) p Low 42 (67.2%) 46 (86.8%) 0.00 47 (64.4%) 41 (87.2%) 0.02 Moderate 21 (31.3%) 7 (13.2%) 22 (30.1%) 6 (12.8%)
Note: p = Chi-square test Source: authors’ elaboration.
Discussion
The risk factors that make up the MS with age, the increasing prevalence of the syndrome in the elderly and generating higher risk for cardiovascular events. This study showed that the prevalence of MS was higher among the elderly in both diagnostic criteria used. Abdominal adiposity (IDF) and glucose (NCEP) were considered independent risk factors for FRS in the sample.
The higher frequency of women in this study stems from a greater tendency of them to seek places where recruitments were carried out, in other words, the centers of social assistance.
The IDF classification is more comprehensive considering abdominal obesity as an essential factor for MS and for presenting threshold values for waist circumference and tighter glycemia than the NCEP and since that regarded as a better performance criterion on determination of MS (SANTOS; SCHRANK; KUPFER, 2009). Furthermore, it has been observed in the literature a wide variation in the prevalence of MS in different populations according to ethnicity and age (XANTHAKIS et al., 2015), a factor considered by the IDF.
In spite of not existing accurate data about the national prevalence,
the results found on this study, both the NCEP-ATP III criteria as IDF, are quite high compared to studies conducted in other countries (WU et al., 2016). In 2016, Wu et al., shows Metabolic syndrome was found in 60% of older Taiwanese adults. In 2009, Ervin assessed the prevalence of MS by the NCEP-ATP III classification in the United States, finding a prevalence of 34% in the general population, being shown an increase with advancing age (ERVIN, 2009). Another population-based study conducted in Rio Grande do Sul with 378 seniors had a prevalence of 50.3% by the NCEP-ATPIII classification and 56.9% by the IDF, which is consistent with the findings of this study (FORD; GILES, 2003). Further, Rigo et al. (2009) found a higher prevalence of MS using the IDF criteria compared to the prevalence found with the criteria of NCEP ATP III and revised NCEP ATP III.
The absence of differences between the glucose levels between the groups with and without MS corroborates with Oliveira, Souza and Lima’s findings, who also observed a lower prevalence of hyperglycemia (OLIVEIRA; SOUZA; LIMA, 2006). This lower proportion of individuals with hyperglycemia can be linked to the fact that the β cells of the pancreas possess the ability to increase insulin production when the peripheral tissues become resistant to the action of this hormone. Thus, there is not necessarily elevated glucose levels, as there is a picture of chronic hyperinsulinemia, which maintains
glycemic homeostasis (VANHONI; XAVIER; PIAZZA, 2012).
It was verified that while the waist circumference is final for characterizing the MS-IDF, 20 subjects in the study who had changed this parameter have not been confirmed as having MS. But the NCEP ranked only 5 of 72 elderly patients with waist circumference changed as without MS-NCEP, indicating that the standard of the NCEP may be more sensitive for the diagnosis of MS in this population group.
The differences observed between the sexes and the components of MS, Vanhoni, Xavier and Piazza (2012) also found average values for the circumference of the waist significantly higher in males compared to females in a group of patients with MS.
It is possible to observe that, although the number of female participants is higher, there was no significant difference between the sexes in the frequency components, both for patients with NCEP and for those with MS-IDF, which demonstrates that the size the sample did not interfere with the results, dispensing strategies to correct this difference.
About the cardiovascular risk, the strong independent association between abdominal obesity by the IDF criterion and the moderate + high FRS is related to the fact that waist circumference be an essential component for the diagnosis of MS by this criterion and, although the same is not included in the FRS, studies show that abdominal obesity coexists with some cardiovascular risk factors
considered in this calculation, such as hypercholesterolemia and hypertension (WILSON et al., 2002). The independent association between blood glucose by NCEP criteria and the high + moderate FRS indicates the importance of this factor in the development of MS by this criterion, even when not associated to other factors. Studies show that individuals with some degree of change in glucose homeostasis have higher prevalence of obesity, hypertension and hypercholesterolemia, and consequently higher FRS and more likely to develop MS (SCHAAN; HARZHEIM; GUS, 2004; RAZZAGHY-AZAR et al., 2016; KIANI et al., 2016).
Conclusion
The results of this study show that the prevalence of MS is high in the elderly people who were diagnosed by both the NCEP-ATP III criteria as the IDF. Furthermore, these results demonstrate that a high or moderate FRS is directly related to the risk of developing MS. Thus, the control of the factors considered in calculating the FRS is the key to reduce the incidence of MS among the seniors.
Associação entre risco cardiovascular
de Framingham e síndrome
metabólica em idosos
Resumo
A síndrome metabólica (SM) é um grupo de fatores de risco cardiovascular que pode aumentar a mortalidade por doença car-diovascular. Assim, o conhecimento sobre a prevalência de SM em idosos é impor-tante contribuição para a saúde pública, já que essa síndrome tende a aumentar com a idade. O objetivo deste estudo é analisar a prevalência de SM entre idosos de acordo com os critérios do IDF e NCEP e determi-nar a sua relação com risco cardiovascular de Framingham (RCF). Idosos (de 60 anos ou mais) de ambos os gêneros participa-ram do estudo. Os voluntários que assi-naram um termo de consentimento foram entrevistados e realizaram exames físicos. As análises bioquímicas foram realizadas em analisador automatizado LabMax 240, utilizando kits da Labtest. Para diagnóstico da SM, os critérios do IDF e NCEP foram utilizados e o risco cardiovascular estima-do pelo cálculo estima-do RCF. A análise descriti-va foi realizada, o teste de Qui-Quadrado para variáveis ordinais e ANOVA ou Teste T de Student para dados quantitativos. A análise multivariada foi realizada por re-gressão logística (método backward
con-ditional). Os valores foram considerados
estatisticamente significativos para um p ≤ 0.05. A prevalência total de SM encontra-da na amostra foi de 55,8% e 60,8% entre NCEP e IDF, respectivamente. Nenhuma associação foi encontrada entre gênero e os critérios diagnósticos. Indivíduos com RCF alto + moderado tiveram maior risco de desenvolver SM quando comparados com aqueles com RCF baixo. A análise de regressão logística demonstrou uma associação independente de adiposidade abdominal pelo critério IDF (OR 4.8, CI
1.0-22.1, p = 0.04) e RCF alto + modera-do, bem como critério glicose NCEP (OR 3.0, CI 1.0-8.4, p = 0.03) com RCF alto + moderado. A prevalência de SM foi maior em ambos os critérios e mais predominan-te naqueles com RCF alto + moderado. Os componentes de SM adiposidade abdomi-nal e glicemia foram associados com maior RCF, indicando que o controle desses fa-tores pode ser importante na redução do risco cardiovascular em idosos.
Palavras-chave: Doenças
cardiovascula-res. Envelhecimento. Idosos. Síndrome metabólica X.
References
ATHYROS, V. G. et al. Awareness, treatment and control of the metabolic syndrome and its components: a multicentre Greek study. Hellenic. Journal of Cardiology, v. 46, n. 6, p. 380-386, 2005.
BRANDÃO, A. P. et al. I Diretriz Brasileira de Diagnóstico e Tratamento da Síndrome Metabólica. Arquivos Brasileiros de
Cardio-logia, Rio de Janeiro, v. 84, p. 1-28, 2005.
CA-BRERA, A. et al. Causas de mortalidade em idosos: estudo de seguimento de nove anos.
Geriatria e Gerontologia, Rio de Janeiro,
v. 1, n. 1, p. 12-18, 2007.
ECKEL, R. H.; GRUNDY, S. M.; ZIMMET, P. Z. The Metabolic Syndrome. Lancet, v. 365, n. 9.468, p. 1415-1428, 2005.
ERVIN, R. B. Prevalence of metabolic syn-drome among adults 20 years of age and over, by sex, age, race and ethnicity, and body mass index: United States, 2003-2006. Natl Health
Stat Report, v. 13, n. 1, p. 1-8, 2009.
FORD, E. S.; GILES, W. H. A comparison of the prevalence of the metabolic syndrome using two proposed definitions. Diabetes
Care, v. 26, n. 3, p. 575-581, 2003.
INSTITUTO BRASILEIRO DE GEOGRA-FIA E ESTATÍSTICA. Projeção da população por sexo e idades. Projeção da população por
sexo e idades. Rio de Janeiro, 2013. Available
in: <http://www.ibge.gov.br/home/estatistica/ populacao/projecao_da_populacao/2013>. Accessed: 23 Nov. 2014.
INTERNACIONAL DIABETES FEDERA-TION. The IDF consensus worldwide defi-nition of the metabolic syndrome. Available from: <http://www.idf.org/webdata/docs/ MetS_def_update2006.pdf>. Accessed: 23 Nov. 2016.
KIANI, I. G. et al. Frequency of Metabo-lic Syndrome in Type-2 Diabetes Mellitus. J
Ayub Medical College Abbottabad, v. 28, n.
1, p. 59-62, Jan./Mar. 2016.
LOHMAN, T. G.; ROCHE, A. F.; MARTO-REL, R. Anthropometric standardization
reference manual. Canada: Champaign, IL;
Human Kinetics, 1988.
LOTUFO, P. A. O escore de risco de Framin-gham para doenças cardiovasculares. Revista
Médica, São Paulo, v. 87, n. 4, p. 232-237,
out./dez. 2008.
NATIONAL CHOLESTEROL EDUCATION PROGRAM. Expert Panel on Detection, Eva-luation, and Treatment of High Blood Cho-lesterol in Adults (Adult Treatment Panel III). Third Report of the National Cholesterol Education Program (NCEP) Expert Panel on Detection, Evaluation, and Treatment of High Blood Cholesterol in Adults (Adult Tre-atment Panel III) final report. Circulation, v. 106, n. 25, p. 3143-3421, 2002.
OLIVEIRA, E. P.; SOUZA, M. L. A.; LIMA, M. D. A. Prevalência de síndrome metabólica em uma área rural do semi-árido baiano.
Arqui-vos Brasileiros de Endocrinologia & Metabo-logia, São Paulo, v. 50, n. 3, p. 456-465, 2006.
RAVAGLIA, G. et al. Metabolic syndrome: prevalence and prediction of mortality in elderly individuals. Diabetes Care, v. 29, n. 11, p. 2.471-2.476, 2006.
RAZZAGHY-AZAR, M. et al. An Evaluation of Acylated Ghrelin and Obestatin Levels in Childhood Obesity and Their Association with Insulin Resistance, Metabolic Syndro-me, and Oxidative Stress. Journal of Clinical
Medicine, v. 5, n. 7, 2016.
RIGO, J. C. et al. Prevalence of Metabolic Syndrome in an Elderly Community: Com-parison between Three Diagnostic Methods.
Arquivos Brasileiros de Cardiologia, Rio de
Janeiro, v. 93, n. 2, p. 85-91, 2009.
SANTOS, E. C.; SCHRANK, Y.; KUPFER, R. Análise crítica dos critérios da OMS, IDF e NCEP para síndrome metabólica em pacientes portadores de diabetes melito tipo 1. Arquivos Brasileiros de Endocrinologia &
Metabologia, São Paulo, v. 53, n. 9, p.
1096-1102, 2009.
SCHAAN, B. D.; HARZHEIM, E.; GUS, I. Perfil de risco cardíaco no diabetes mellitus e na glicemia de jejum alterada. Revista de
Saúde Pública, São Paulo, v. 38, n. 4, p.
529-536, 2004.
STERN, M. P. et al. Does the metabolic syn-drome improve identification of individuals at risk of type 2 diabetes and/or cardiovas-cular disease? Diabetes Care, v. 27, p. 2676-2681, 2004. Erratum in: Diabetes Care, v. 28, p. 238, 2005.
VANHONI, L. R.; XAVIER, A. J.; PIAZZA, H. E. Avaliação dos critérios de síndrome metabólica nos pacientes atendidos no ambu-latório de ensino médio em Santa Catarina.
Revista da Sociedade Brasileira de Clínica Médica, São Paulo, v. 10, n. 2, p. 100-105,
mar./abr. 2012.
WILSON, P. W. F. et al. Overweight and obe-sity as determinants of cardiovascular risk.
Archives of Internal Medicine, v. 162, n. 16,
p. 1867-1872, 2002.
WORD HEALTH ORGANIZATION. Obesity: preventing and managing the global epide-mic. Genebra: WHO Report., 1997. p. 98.
WU, T. T. et al. The relationship between health-promoting behaviors and Metabo-lic Syndrome in Community-Dwelling Older Adults. Biological Research for Nursing, v. 18, n. 5, p. 549-557, Oct. 2016.
XANTHAKIS, V. et al. Relations between Subclinical Disease Markers and Type 2 Diabetes, Metabolic Syndrome, and Incident Cardiovascular Disease: The Jackson Heart Study. Diabetes Care, v. 38, n. 6, p. 1082-1088, 2015.