Revista Árvore, Viçosa-MG, v.40, n.6, p.1083-1090, 2016
ECOLOGICAL AND FUNCTIONAL CLUSTERING OF FORESTAL SPECIES IN
THE SOUTH WESTERN AMAZONIA
1Elias Lourenço Vasconcelos Neto2*, Celso Azevedo3, Luciano Ribas4 and Marcus Neves d'Oliveira4
1 Received on 16.10.2014 accepted for publication on 25.10.2016.
2 Universidade Federal do Amazonas, Programa de Pós-Graduação em Ciências Florestais e Ambientais, Manaus, Amazonas
- Brazil. E-mail: <netoelvn@gmail.com>.
3 Embrapa Amazônia Ocidental, Manaus, Amazonas - Brazil. E-mail: <celso.azevedo@embrapa.br>.
4 Embrapa Acre, Rio Branco, Acre - Brazil. E-mail: <luciano.ribas@embrapa.br> and <marcus.oliveira@embrapa.br>.
*Corresponding author.
ABSTRACT – The aim of this study was to perform ecological and functional clustering of tree species in southwestern Amazon. Developed from data from 95 permanent plots of 1 ha each, all individuals with diameter at breast height (DBH) >10 cm were measured. The species grouping was performed in three stages: (1) cluster analysis, using the variables: diameter annual periodic increment -(IPADAP) considering three competition levels (high, medium and low) and the 95th percentile of the diameters (P95) cumulative frequency distribution (Ward hierarchical method); (2) Discriminant analysis, using the variables P95 and IPADAP by Fisher's method
and (3) subjective stage, considering the species ecological characteristics. The Ward and Fisher methods used for discriminant and cluster analyses were effective for species grouping resulting on the formation of 10 groups. Variables: IPADAP and and P95 were efficient on the formed groups discrimination.. Variations in the growth rates for the overall mean data were reduced wen calculated for each group of species.
Keywords: Forest dynamics; Permanent plots; Forest Management.
AGRUPAMENTO ECOLÓGICO E FUNCIONAL DE ESPÉCIES FLORESTAIS
NA AMAZÔNIA SUL OCIDENTAL
RESUMO – O objetivo deste estudo foi efetuar o agrupamento ecológico e funcional de espécies florestais na Amazonia Sul Ocidental. Desenvolvido a partir de dados de 95 parcelas permanentes de 1ha cada, todos os indivíduos com diâmetro a altura do peito (DAP) maior ou igual a 10 cm foram medidos. O agrupamento ocorreu em três estágios: (1) análise de cluster, utilizando as variáveis Incremento Periódico Anual em diâmetro - IPADAP, IPADAP em Alta, Média e Baixa competição e o percentil 95% da distribuição de frequência cumulativa dos diâmetros (P95), utilizando-se o método hierárquico Ward; (2) análise Discriminante, utilizando as variáveis
P95 e o IPADAP, pelo o método de Fisher; (3) estágio subjetivo, utilizando-se características ecológicas das espécies. Os métodos Ward e Fisher usados no cluster e discriminante, respectivamente, demonstraram-se eficazes na criação e formação dos agrupamentos, resultando na formação de 10 grupos. As variáveis: IPADAP para o povoamento, IPADAP em baixa, média e alta competição e P95 foram eficientesna discriminação dos
agrupamentos formados. As variações nas taxas de crescimento relativas à média total dos dados foram reduzidas quando calculada para cada grupo de espécies.
1. INTRODUCTION
It is estimated that there are 12,000 tree species in Amazonia with different ages and growth rates (LLERAS; LEITE, 2005), what elevates the comprehension difficulty of the forest dynamics. According to Azevedo (2006), the forest dynamics can be summarized in the comprehension on the behavior of the growth, recruiting and mortality rates, in natural conditions and under management.
Works have been shown that dry land forest do not have only a high species diversity, but it also presents a high percentage of rare species represented by a unique individual per hectare (OLIVEIRA et al., 2008). Azevedo et al (2008) verified that there is a low number of species that can be individually modeled and that the species of commercial interest are represented by few individuals.
All of these factors become the comprehension and modeling of the forest growth dynamics into a great challenge. So, what is supposed to be done in order to soften the difficulty in the modeling process of the forest dynamics, since characterizing forest dynamics processes is essential for the sustainable management of the natural forests (EISFELD; SANQUETA, 2000).
Species clustering facilitate the forest dynamics modeling process , and when it is based on species ecological characteristics and structurally similar forests, it will contribute to the definition of methodologies and applicable practices in the development of management plans (FERRAZ et al., 2004). Besides, the clustering of tree species can be useful to the elaboration of tropical forests growth and production simulation models capable to produce information to be applied in forest conservation, sustainable forest management, degraded areas rehabilitation and in studies aiming to find new alternatives to tropical forest management. This study aimed to do an ecological and functional clustering of tree species present in the southwestern Amazon., seeking out to define: i. useful variables for the groups’ formation, ii. diameter annual periodic increment and the most representative species of each formed group. Specifically, we test the hypothesis that the growth rates mean variance is reduced related to the total average will be reduced when it is calculated for each group of species.
2. MATERIAL AND METHODS
This study has been developed from data of 95 permanent plots installed in the Project of Colonization (PC) Pedro Peixoto, Antimary State Forest (FEA) and in the areas of the company ST Manejo. These plots are located in the states of Acre and Amazonas, Southwestern Amazonia. According to Köeppen classification, the weather is Am, corresponding to hot and humid with short period of dry season, with high temperatures, high and high levels of rain precipitation and high relative humidity of air. The forest typology that happens in the region corresponds to the open ombrophylous forest with palm trees, open ombrophylous forest with bamboo; dense forest; and alluvial forest. The measured plots have an area of one hectare each (100m x 100m) according to the guidelines of measurement and installation of permanent plots in Amazonia defined by SILVA et al. (2005). Each plot is divided by 100 sub-plots of 10 m x 10 m. In these subplots, all the individuals with diameter to the chest high - DAP e” 10 cm have been plated.
The calculus of the annual improvements have been done in diameter (IPADAP) for all the species in all the measurements intervals (FEA: 1999-2001, 2001-2002, 2002-2004, 2004-2007; PC Pedro Peixoto: 1996-1997, 1997-1998, 1998-2001, 2001-2006; ST Manejo: 2000-2002, 2002-2004, 2004-2007). The improvements have been calculated through the following equation:
IPADAP = , in which:
IPADAP = Annual improvement Growth = DAP2 - DAP1
Intervalyears = Nanos + , where:
Nanos = Year2 - Year1 and Nmes = Mes2 - Mes1 The percentile 95% of the cumulative frequency distribution of the diameters has also been calculated for each species.
The annual improvements in diameter (IPADAP) for all the species in all the measurements intervals have been established for the competition levels, ‘high’, ‘low’, through using the independent diameter of the competition rate (C).
The competition rate has been calculated based on the following way: C = Ct - Ct
GROWTH INTERVAL years
Nmes
12
Where:
C = Competition Rate
Ct = Competition Rate for tree t; Ct= Predicted Competition Rate.
The Competition Rate, Ct, for the tree t, it is based on the location of each tree in the subsample:
Where:
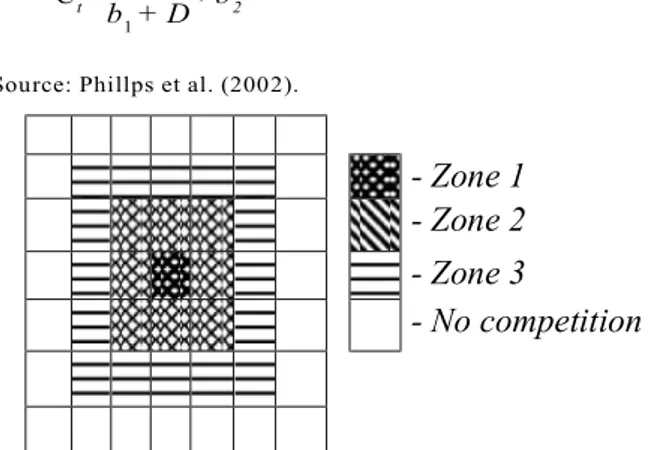
z1, z2 ez3 = coefficients of relative importance for the competitions of the zones 1, 2 and 3, respectively; i, j and k = trees ‘over-topping’ in all the three zones;
D = tree diameter.
The zone 1 is a square of 10 x 10 m contenting t trees and the zones 2 and 3 are defined as relative for the zone 1 (Picture 1).
The values used for the parameters z1, z2 and z3, in the calculus of the absolute competition rate for each tree, were 9, 4 and 1, respectively. These values have been arbitrarily selected to represent the reduction in the concurrence with the distance increase among the trees.
The predicted competition rate Ct is the result of the adjustment of the relation between Ct e D, according to the equation below:
Where:
Ct = Predicted value of the competition rate, Ct; D = Tree diameter;
b0, b1 and b2 = parameters.
Values of C over 40.0 were classified as being ‘High Competition’ and values under -40.0 were classified as being ‘Low Competition’. The values of this interval (-40 < C < 40) were defined as ‘Medium Competition’. The process for species clustering has involved trees stages:
a) Cluster Analysis (most populous species – N > 50 individuals)
The difference between the species ecological clustering has been measured through the method of Ward through the standardized Euclidian distance. The following variables have been used: Annual improvement in diameter (IPADAP); IPADAP in low competition; IPADAP in medium competition; IPADAP in high competition; Percentile 95% of the distribution of cumulative frequency of the diameters – DAP (P95).
b) Discriminating Analysis – less populous species (20 < N < 50)
The species with at least 20 and less than 50 trees have been considered in order to do a discriminating analysis based on the percentile point 95% (P95) and in the annual improvement in diameter (IPADAP), through the method of Fisher, in order to add to the groups formed in the Cluster.
c) Subject Method – (N < 20)
The species that present the number of individuals smaller than 20 have been added to the existing groups through subjective analysis, through the use of ecological characteristics such as: IPADAP (found in other works), botanic classification and sociological position.
The hypothesis test for the equality between both population variances in a significance level of 5% has been used, in order to confirm the affirmation that the variations in the relative growth rates at the average would be reduced when calculated for each species group.
^
Figure 1 – Different zones of competition to a tree in zone 1. Figura 1 – Diferentes zonas de competição para uma árvore
na zona 1. ^
C = z .
t
1i=1
Σ
__
D
D
+ .
z
2 n1i
t
t
j=1
D
Σ
n2__
D
j
3
z .
t
i=1
D
Σ
n3__
D
k
+
Ct= +bb0 2
b1+D
^
- Zone 1
- Zone 2
- Zone 3
- No competition
Hypothesis: H0:02 =
i2 and H1: 02 > i2
02 = Total Annual Improvement Variance, not considering the groups.
i2 = Annual Improvement Variance of the group i;
3. RESULTS
The 95 permanent plots As 95 have presented 76 Families, 311 genders, 604 species and 38401 individuals. The families with bigger representativeness of species were: Papilionoideae (39), Leguminosae-mimosoideae (38), Leguminosae-Caesalpinioideae (38), Moraceae (31), Sapotaceae (26), Euphorbiaceae (26), Lauraceae (23), Annonaceae (22), Apocynaceae (20), Lecythidaceae (20), Myristicaceae (19), Meliaceae (16) and Rubiaceae (14). These 13 families have 55% of the total of species.
The most abundant species were: Theobroma microcarpum Mart (1581), Pseudolmedia laevis (Ruiz & Pav.) J.F. Macbr (1395), Pseudolmedia mururé Standl.
(1114), highest Tetragastris (Aubl.) Swart (914), Peltogyne sp (904).
The study area has presented a diameter improvement of 0.36 cm/year. The species that represented bigger medium improvements were: Ceiba pubiflora (a. St.-hil.) k. Schum with 1.6 cm/year,
Eschweilera parviflora (Aubl.) Miers with 1.4 cm/year and Swietenia macrophylla King with 1.4 cm/year. However, species like: Myrcia jabuticaba (Vell.) Baill. and Theobroma sp have presented an IPADAP of 0.02cm/ year, the smallest diameter growth.
Among the 604 species that were found in the study area, 142 (23.5%) had a unique measurement. The relation between the Competition rate for each tree (Ct) and its respective diameter (D) has been described through the following nonlinear model.
Ct = -55,9550
R2(%)=76.12 Sxy (%) = 37.25
F = 61026.6 (p = 0.000)
The model explains 72.12% of the total variation that happens in the Competition Rate (Ct), and it represents a standard mistake of the estimative of
37.25%. All the coefficients were significant at 1% of probability.
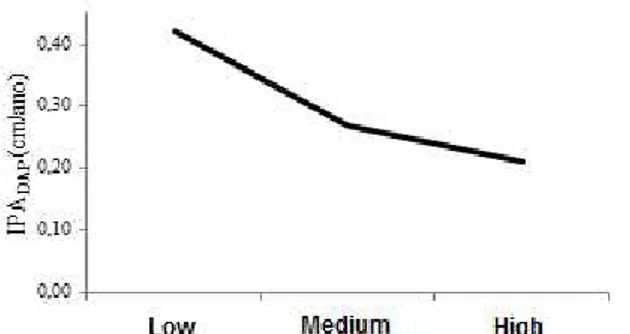
Most species, as expected, tends to present bigger growth in ‘Low Competition’ or it grows in a slower speed in ‘High Competition’. In average terms, in ‘High Competition’, the species improve 0.21 cm/year while in ‘Low Competition’, the average improvement was 0.42 cm/year (Picture 2).
It has been checked that 50% of the species have
P95bigger than 30 cm. The species Picramnia sp and
Sterculia striata St. Hil. & Naudin have shown the smallest values of P95 (10.2 cm), it means, that the species with individuals of smaller diameters. Thirteen species, or 2.1% of the total, have shown P95 bigger than 100 cm. Among these species with big diameters are
Bertholletia excelsa Bonpl. and Hymenaea courbaril
L. with 128 and 124.8 cm respectively.
a) Cluster Analysis (most populous species – N > 50 individuals)
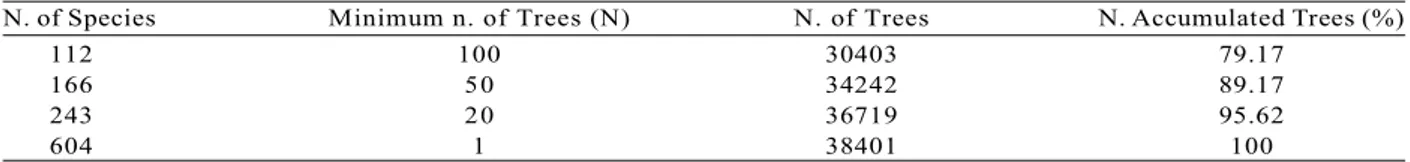
One hundred sixty (166) species have been through this stage of the clustering process. They are species with high representativeness and have 89.17% of the present individuals in the area (Table 1). The 34,242 trees from these species have presented 36,803 growth measures.
The Cluster Analysis has identified the natural division in the forest, classifying – in the same group – species with similar growth and ecological characteristics, as for example, Bertholletia excelsa
Bonpl. and Dipteryx odorata (Aublet) Willd, clustering 6, denominated as emerging and climax that are present in the forest superior dossal.
2289,9 - 4,1340 + D ^
Figure 2 – Behavior of Periodic Annual Improvement (IPADAP) at different levels of competition.
The clustering process demands that the user decides on how many groups can exist in advance. The choice of the number of groups is subjective, but it must look for equilibrium between having more data per group and, more groups that represent the variation in the forest. With visual representations, using the characteristic variables values, it is possible to provide subjective judgment on the clustering utility. This is easy with 2 variables, however, no subjective judgment was undertaken. Consequently, the total of groups has been defined based on the previous studies of Phillips et al. (2001, 2002), so allowing comparisons with other works that had used the same quantity. b) Discriminating Analysis – less populous species (20 < N < 50)
The least populous species have been allocated in 10 groups created by the Cluster Analysis. 79 species that were used in the discriminating analysis – this corresponds to 2,477 individuals and 4,074 growth measures.
c) Subjective Method – (N < 20)
The 362 remaining non grouped species have been added to groups that were created based on the average and standard deviation of the IPADAP. However, 117 species that did not have growth measures have been allocated in a manual way, based on the ecological characteristics available in the literature.
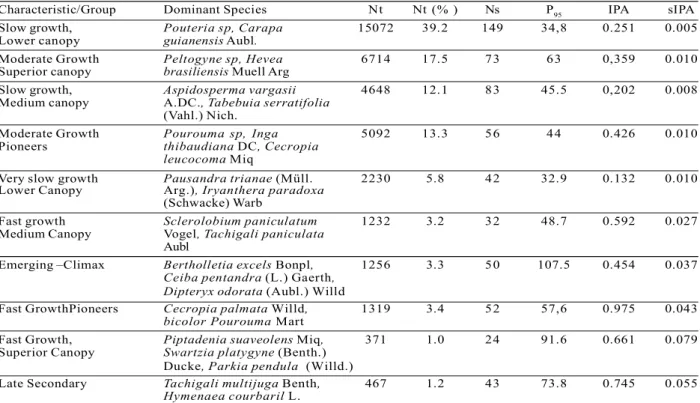
In the ten clustering formation, 40,877 growth measures, 38,401 individuals and 604 species have been found. The Table 2 presents the main characteristics of each group.
Group 8, named ‘Fast Growth Pioneers’, has presented the bigger improvement, average 0.97 cm/ year, over the growth average of the study area, 0.36 cm/year. Among these representative species, we have:
Cecropia palmata Willd and Pourouma bicolor Mart,
popularly known as ‘imbaúba, imbaubarana’. Species that normally are the first to appear in an area that has suffered a kind of disorder.
In a general way, the other groups are formed by intermediate species that are classified as species of inferior, medium and superior canopy, with fast or slow growth.
The Table 3 presents the results of the tests of population variance equality with each group of specie. Based on the values of probability associated to the test F, one can say that the situations, to the level of 5% of significance, refuse the hypothesis of nullity, it means, the general variance of the IPADAP is bigger than the IPADAP variance in each group.
4. DISCUSSION
The study area has presented a diameter improvement of 0.36 cm/year. This result is lower than the ones that were found by Junior et al. (2007) who found a diameter improvement of 0.40 cm/year in plots of 10 ha and by Vieira (2003) who, while measuring individuals with diameter over 10 cm, found a diameter improvement of 0.39 cm/year. Both results mentioned before have been obtained in study areas in Acre/Brazil. However, this result is higher than the one found by Vieira (2003) in the regions of Manaus (Amazonas) and Santarem (Para) that had a diameter improvement average rate of 0.31 and 0.17 cm/year respectively. According to this author, in Santarem, the forest is classified as dry land dense ombrophylous. This indicates that this difference in the average rate of the diameter improvement can be related to the fact that the comparison is being done among regions with different forest typologies.
However, the result found by Colpini et al. (2008) were similar to the ones found in this sturdy. They measured 69 permanent plots installed in Marcelandia (Mato Grosso) from 2001 to 2007 and found a diameter improvement of 0.34 cm/year. According to BRASIL (1981), this study area in Marcelandia is an ecological tension area in the region of contact ombrophylous forest/seasonal forest, with predominance of the formation named semideciduous forest.
N. of Species Minimum n. of Trees (N) N. of Trees N. Accumulated Trees (%)
112 100 30403 79.17
166 50 34242 89.17
243 20 36719 95.62
604 1 38401 100
Once all the clustering stages are done (Cluster Analysis, Discriminating Analysis and subjective Method) you can observe a summary of the main characteristics of each group in the table 2. The group 8 (named Fast Growth Pioneers) is highlighted and it shows the bigger average improvement, average of 0.97 cm/year, bigger than the average of growth of the study area, 0.36 cm/year. Among the representative species of this group, we have: Cecropia palmata and bicolor Pourouma - species that are normally the first ones to appear in the area that had suffered any kind of disorder. According to Laurance et al. (1998), the first bodies to colonize the habitat receive the name of pioneers. They are species that need bigger quantities of light and they compete for the soil resources.
Group 7, named Emerging – Climax, is composed by species from this type. Here they are: Bertholletia excelsa Bonpl., Ceiba pentandra (L.) Gaertn., Dipteryx odorata, Copaifera multijuga. These species present a fast growth and the biggest DAPs. Budowski (1966) says that the biggest diameters are found in the late
secondary species and climax, what the P95 of 107.5 cm confirms – bigger than all.
When Lira (2011) did the ecological and functional clustering for the Western Amazonia also noticed the Pioneers and the Climax in the groups’ formation. Group 10, classified as Late Secondary presents a high P95
Characteristic/Group Dominant Species Nt Nt (% ) Ns P95 IPA sIPA
Slow growth, Pouteria sp, Carapa 15072 39.2 149 34,8 0.251 0.005
Lower canopy guianensis Aubl.
Moderate Growth Peltogyne sp, Hevea 6714 17.5 73 63 0,359 0.010
Superior canopy brasiliensis Muell Arg
Slow growth, Aspidosperma vargasii 4648 12.1 83 45.5 0,202 0.008
Medium canopy A.DC., Tabebuia serratifolia
(Vahl.) Nich.
Moderate Growth Pourouma sp, Inga 5092 13.3 56 44 0.426 0.010
Pioneers thibaudiana DC, Cecropia
leucocoma Miq
Very slow growth Pausandra trianae(Müll. 2230 5.8 42 32.9 0.132 0.010
Lower Canopy Arg.), Iryanthera paradoxa
(Schwacke) Warb
Fast growth Sclerolobium paniculatum 1232 3.2 32 48.7 0.592 0.027
Medium Canopy Vogel, Tachigali paniculata
Aubl
Emerging –Climax Bertholletia excels Bonpl, 1256 3.3 50 107.5 0.454 0.037
Ceiba pentandra (L.) Gaerth, Dipteryx odorata(Aubl.) Willd
Fast GrowthPioneers Cecropia palmata Willd, 1319 3.4 52 57,6 0.975 0.043
bicolor Pourouma Mart
Fast Growth, Piptadenia suaveolens Miq, 371 1.0 24 91.6 0.661 0.079
Superior Canopy Swartzia platygyne (Benth.) Ducke, Parkia pendula (Willd.)
Late Secondary Tachigali multijuga Benth, 467 1.2 43 73.8 0.745 0.055
Hymenaea courbaril L.
Table 2 – Description of the ten groups resulting from the clustering process. Tabela 2 – Descrição dos dez grupos resultantes do processo de agrupamento.
G is the number of the group, P95 is the percentile 95% of the diameter (cm) accumulated distribution, IPA is the annual improvement in diameter (cm/year-1), Nt is the number of trees, Ns is the number of species in each group, sIPA are standard deviations.
Group IPA s2IPA F p
1 0.25 0.00002 3006.98 0.00
2 0.36 0.00010 711.74 0.00
3 0.20 0.00006 1230.28 0.00
4 0.43 0.00011 659.77 0.00
5 0.13 0.00009 790.03 0.00
6 0.59 0.00072 99.65 0.00
7 0.45 0.00137 52.50 0.00
8 0.98 0.00184 39.02 0.00
9 0.66 0.00630 11.43 0.00
10 0.75 0.00304 23.69 0.00
General 0.3600 0.07196
Table 3 – F values and probability of hypothesis test at 5 % significance level.
(73.8 cm). Santos et al. (2004) say that the Late Secondary is large size tree species that develop in shaded environments, and they can become canopy or emerging. The Late Secondary Species can show a fast growth (MACIEL et al., 2003) and this can explain an IPADAP of 0.74 cm/year for this group.
Group 1, named Slow Growth, Medium Canopy, has an IPADAP of 0.25 cm/year, a low growth if it is compared to the average of the area growth. This slow growth is explained due to the fact of this group show a bigger quantity of individuals per specie, as it can be observed in Table 2, and this considerably raises the competition among individuals with similar necessities. It is composed by species such as
Theobroma microcarpum Mart, Pseudolmedia laevis
(Ruiz & Pav.) J.F. Macbr and Pouteria sp, which are the most abundant in the area. According to Klein (1983), the lower canopy is one of the densest stratums of the forest composed by a great quantity of species that are composed by individuals that live in ‘High Competition’.
Group 5, introduced in the Table 2 as Very Slow Growth, Lower Canopy, shows the smallest IPADAP, 0.13 cm/year. The smallest average improvement found by Azevedo (2006) e Lira (2011) in his clustering was 0.09 cm/year, slow growth, understory.
5. CONCLUSION
Based on the obtained results, it is possible to conclude that:
The Ward method used in the Cluster analysis and the Fisher method used in the discriminating have been efficient in the creation of the groups’ formation; The variables general IPADAP, in low IPADAP, in medium IPADAP, in high Competition IPADAP and P95 of the distribution of the cumulative frequency of the diameters were useful variables for the species clustering formation; The clustering has allowed a better ecological and functional knowledge of the species that have similarity in the average annual improvement and in the Percentile 95% of the distribution of the diameters cumulative frequency – DAP;
The variations in the growth rates related to the data total average have been conducted when calculated for each species group.
6. REFERENCES
AZEVEDO, C.P. Dinâmica de florestas submetidas a manejo na Amazônia Oriental: experimentação e simulação. 2006. Tese (Doutorado em Engenharia Agrícola) – Universidade Federal do Paraná, Curitiba, 2006.
AZEVEDO, C.P.; SANQUETTA, C.R.; SILVA, J.N.M.; MACHADO, S.A. Efeito da Exploração de Madeira e dos tratamentos silviculturais no agrupamento Ecológico de espécies. Forest, v.38, p.53-69, 2008.
BRASIL. Ministério de Minas Energia. Departamento de Produção National Mineral. Project RADAMBRASIL: Volume 22 sheet Sc 22 - Tocantins. Rio de Janeiro: 1981.
BUDOWSKI, G. Los bosques de los trópicos húmedos de América. Turrialba,v. 3, n. 16, p. 278-285, 1966.
COLPINI, C. Dinâmica e prognose da producão de uma floresta de contato ombrófila aberta/estacional
semidecidual Cuiabá MT. 2008. 114f. Dissertação (Mestrado em Engenharia Florestal) – Universidade Federal do Mato Grosso, Cuiabá, 2008.
EISFELD, R.L.; SANQUETTA, C.R. Modelo matricial de transicão aplicado a dinâmica de uma floresta natural com Araucaria. In: V Congresso de ecologia do Brasil, 2001, Porto Alegre - RS
KLEIN, R.M. Native trees of the subtropical forest of Alto Uruguay. Sellowia, v.24, n.24, p.9-62, 1972.
FERRAZ, I. D. K.; LEAL FILHO, N.; IMAKAWA, A. M.; VARELA, V. P.; PINA RODRIGUES, F. C. N. Basic characteristics for the preliminary ecological clustering of timber species of dry land of the Central Amazonia. Acta Amazônica, v.34, n.4, Oct/Dec. 2004.
JUNIOR, J. L. F.; M. SILVEIRA & C. SALIMON. In: Anais do VIII Congresso de Ecologia do Brasil. Dinâmica florestal na região leste do Acre: crescimento e
LAURANCE, W.F.; FERREIRA, L.V.; RANKIN-DE-MERONA, J.M.; LAURANCE, S.G.; HUTCHINGS, R.W.; LOVEJOY, T.E. Effects of forest
fragmentation on recruitment patterns in Amazonian tree communities. Conservation Biology, v.12, p.460-464, 1998.
LLERAS, E.; LEITE, A.M.C. A biodiversidade amazônica sem mitos. Manaus: Embrapa Amazônia Ocidental, 2005. 20p.
LIRA, L.P. Agrupamento ecológico e funcional de espécies florestais da Amazônia Central. Dissertação (Mestrado em Ciências Florestais e Ambientais) –
Universidade Federal da Amazonas, Manaus, 2011.
MACIEL, M. de N.; WATZLAWICK, L. F.; SCHOENINGER, E. R.; YAMAJI, F. M.
Classificação ecológica das espécies arbóreas. Revista Acadêmica: ciências agrárias e ambientais, Curitiba, v.1, n.2, p. 69-78, abr./jun. 2003.
OLIVEIRA, A.N.; AMARAL, I.L.; RAMOS, M.B.P.; NOBRE, A.D.; COUTO, L.B.; SAHDO, R.M.
Composição e diversidade florístico-estrutural de um hectare de floresta densa de terra firme na Amazônia Central, Amazonas, Brasil. Acta Amazonica,v.38, n.4, p.627-642, 2008.
PHILLIPS, P.D.; AZEVEDO, C.P.; THOMPSON, I.S.; SILVA, J.N.M. An ecological model for the management of natural forest in the Tapajos region, Amazonian Brazil. Edinburgh:The University of Edinburgh, 2002. 33p. (SYMFOR Technical Note Series, 12) Accessed on: 01 Aug. 2004. Available: http:// www.SYMFOR.org/technical/index.html
SANTOS, J.H.S.; FERREIRA, R.L.C.; SILVA, J.A.A.; SOUZA, A.L.; SANTOS, E.S.; MEUNIER, I.M.J. Distinction of ecological groups of tree species through multivariate techniques. Revista Árvore, v.28, n.3, p.387-396, 2004.