Pesq. agropec. bras., Brasília, v.48, n.3, p.270-279, mar. 2013 DOI: 10.1590/S0100-204X2013000300005
Molecular characterization of soybean cultivars by microsatellite
markers with universal tail sequence
Carlos Alexandre Gomes Ribeiro(1), Janaína Paula Marques Tanure(2),
Talles Eduardo Ferreira Maciel(1) and Everaldo Gonçalves de Barros(1)
(1)Universidade Federal de Viçosa, Instituto de Biotecnologia Aplicada à Agropecuária, CEP 36570‑000 Viçosa, MG, Brazil.
E‑mail: [email protected], [email protected], [email protected] (2)Embrapa Gado de Corte, Avenida Rádio Maia, no 830, Vila
Popular, Caixa Postal 154, CEP 79106‑550 Campo Grande, MS, Brazil. E‑mail: [email protected]
Abstract – The objective of this work was to standardize a semiautomated method for genotyping soybean, based on universal tail sequence primers (UTSP), and to compare it with the conventional genotyping method that uses electrophoresis in polyacrylamide gels. Thirty soybean cultivars were genotypically characterized by both methods, using 13 microsatellite loci. For the UTSP method, the number of alleles (NA) was 50 (2–7 per marker) and the polymorphic information content (PIC) ranged from 0.40 to 0.74. For the conventional method, the NA was 38 (2–5 per marker) and the PIC varied from 0.39 to 0.67. The genetic dissimilarity matrices obtained by the two methods were highly correlated with each other (0.8026), and the formed groups were coherent with the phenotypic data used for varietal registration. The 13 markers allowed the distinction of all analyzed cultivars. The low cost of the UTSP method, associated with its high accuracy, makes it ideal for the characterization of soybean cultivars and for the determination of genetic purity.
Index terms: Glycine max, cultivar protection, genetic diversity, genotyping method, random identity probability.
Caracterização molecular de cultivares de soja por meio de marcadores
microssatélites com sequência de cauda universal
Resumo – O objetivo deste trabalho foi padronizar um método semi‑automatizado para genotipagem de soja, baseado na metodologia de iniciadores com sequências de cauda universal (PSCU), e compará‑lo ao método de genotipagem convencional de eletroforese em gel de poliacrilamida. Trinta cultivares de soja foram caracterizadas genotipicamente por ambos os métodos, com o uso de 13 locos microssatélites. Para o método PSCU, o número de alelos (NA) foi de 50 (2–7 por marcador) e o conteúdo de informação polimórfica (PIC) variou de 0,40 a 0,74. Para o método convencional, o NA foi de 38 (2–5 por marcador) e o PIC variou de 0,39 a 0,67. As matrizes de dissimilaridade genética obtidas pelos dois métodos apresentaram alta correlação entre si (0,8026), e os grupos formados foram coerentes com dados fenotípicos utilizados para o registro varietal. Os 13 marcadores permitiram a distinção de todas as cultivares analisadas. O baixo custo do método PSCU, associado a sua alta acurácia, torna‑o ideal para a caracterização de cultivares de soja e a determinação de pureza genética.
Termos para indexação: Glycine max, proteção de cultivar, diversidade genética, método de genotipagem, probabilidade de identidade ao acaso.
Introduction
Soybean [Glycine max (L.) Merr.] has been the fastest growing crop in Brazil for the last three decades and accounts for 52% of the cultivated area of the country (Companhia Nacional de Abastecimento, 2013). More than 1,000 varieties of soybean are registered in the National Cultivar Registration Service, and more than 590 cultivars are protected by the National Cultivar Protection Service (Brasil, 2013).
Distinguishability analysis is a basic requirement for DUS tests (distinguishability, uniformity and stability)
used for cultivar protection. In the case of soybean, these tests have been hampered by the high phenotypic similarity among cultivars, which is mainly due to the narrow genetic base of cultivated genotypes (Priolli et al., 2004).
Molecular descriptors have been used for cultivar protection purposes by the United States Department of Agriculture (USDA) (Diwan & Cregan, 1997). In Brazil, the molecular analysis is not yet recognized
as an official method to aid the cultivar protection
Microsatellite markers are widely used for the determination of genetic diversity, paternity tests, varietal purity analysis, and genetic mapping (Schuster et al., 2004; Song et al., 2004; Garcia et al., 2007; Rodrigues et al., 2008; Oliveira et al., 2010; Kalia et al., 2011). With the advent of automatic techniques for genotyping, the
use of fluorescent primers for DNA fragment analysis has
become quite common (Lazaruk et al., 1998). Although this technique is remarkably practical, synthesis of
fluorescently labeled primers is still an expensive step
when compared to the synthesis of unlabeled ones (Hayden et al., 2008; Arruda et al., 2010).
Variations of the automated technique for microsatellite genotyping have been developed in order to match the speed and automation of the process with the quality and low cost of the analysis.
Among them is a method first described by Oetting
et al. (1995), which involves the joint use of three primers (unlabeled forward and reverse primers, and
a fluorescently labeled M13 primer). This technique was first described in studies to evaluate genotypes
in humans (Oetting et al., 1995). It was also used for genotyping animals (Diniz et al., 2007; Arruda et al., 2010) and several plant species, such as common beans (Oblessuc et al., 2009), rice (Goulart et al., 2011), apricot, cherry, barley, wheat (Hayden et al., 2008), Eucalyptus (Missiaggia & Grattapaglia, 2006), and soybean (Priolli et al., 2010).
Based on Oetting et al. (1995), the universal tail sequence primers (UTSP) technique is proposed for the distinguishability of soybean cultivars using the
fluorescently labeled universal primers M13, T3, and T7.
In general, these primers do not match sequences present in plant genomes; therefore, they can be used for different
plant species. Only three primers are fluorescently labeled. There is no need to label specific primers for
each species to be analyzed. This is a great advantage
if the high prices of fluorescently labeled primers are
considered (Missiaggia & Grattapaglia, 2006).
The objective of this work was to standardize a semiautomated method for genotyping soybean, based on UTSP, and to compare it with the conventional genotyping method that uses electrophoresis in polyacrylamide gels.
Materials and Methods
Thirty soybean cultivars, developed by different public and private institutions, were used: BMX Magna
RR; BRS 133; BRS 184; BRS 213; BRS 214; BRS 255RR; BRS 256RR; BRS 262; BRS 270RR; BRS Charrua RR; BRS Gisele RR; BRSMG 850GRR; BRS Pampa RR; BRSMT Pintado; BRS Valiosa RR; CD 202; CD 206; CD 213RR; CD 214RR; CD 215; CD 217; CD 219RR; CD 226RR; CD 228; CD 229RR; CD 237RR; CD 240RR; MG/BR 46 Conquista; M‑SOY 7501; and Vmax (NK 7059 RR). Their germplasm were obtained from the Active Germplasm Bank of Embrapa Soja, Londrina, PR, Brazil, and from the seed companies Brasmax, Coodetec, Monsanto, and Syngenta. The genomic DNA was extracted according to Marcelino et al. (2008), using a bulk of 50 seeds for each cultivar. Information concerning the genealogy of the cultivars was obtained from the website CultivarWeb (Brasil, 2013).
For the UTSP method, a multiplex system was used, as described by Oetting et al. (1995), which included three kinds of primers: 1, a sense microsatellite primer,
which carries, besides its specific sequence, a 17 base pair
(bp) tail at its 5’ end identical to sequences of universal primers commonly used in molecular biology, such as: M13 (GTAAAACGACGGCCAGT), T3 (ATTAAC CCTCACTAAAG) or 7 (AATACGACTCACTATAG); 2, a regular antisense microsatellite primer; and 3, a
fluorescently labeled primer, with the same sequence
as the sense primer tail (Figure 1). The tails were tagged with either 6‑FAM (M13 tail), HEX (T3 tail) or NED (T7 tail) (Life Technologies do Brasil Ltda., São Paulo, SP, Brazil).
PCR reactions (20 μL) contained 30 ng
DNA, PCR buffer 1X (10 mmol L‑1 Tris‑HCl, pH 8.8, 50 mmol L‑1 KCl, 0.08% v v‑1 Nonidet P40), 1.5 mmol L‑1 MgCl
2, 0.2 mmol L‑1 dNTP, 0.2 mmol L‑1 of each primer (sense and antisense), and 1.0 U Taq DNA polymerase. For UTSP PCR reactions, the concentration of the tailed sense primer
was five times lower (0.04 mmol L‑1) than the other two primers. Reactions were carried out separately for each microsatellite locus. After optimization, 13
markers were selected based on their amplification profile, the smaller amount of stutter products, and the
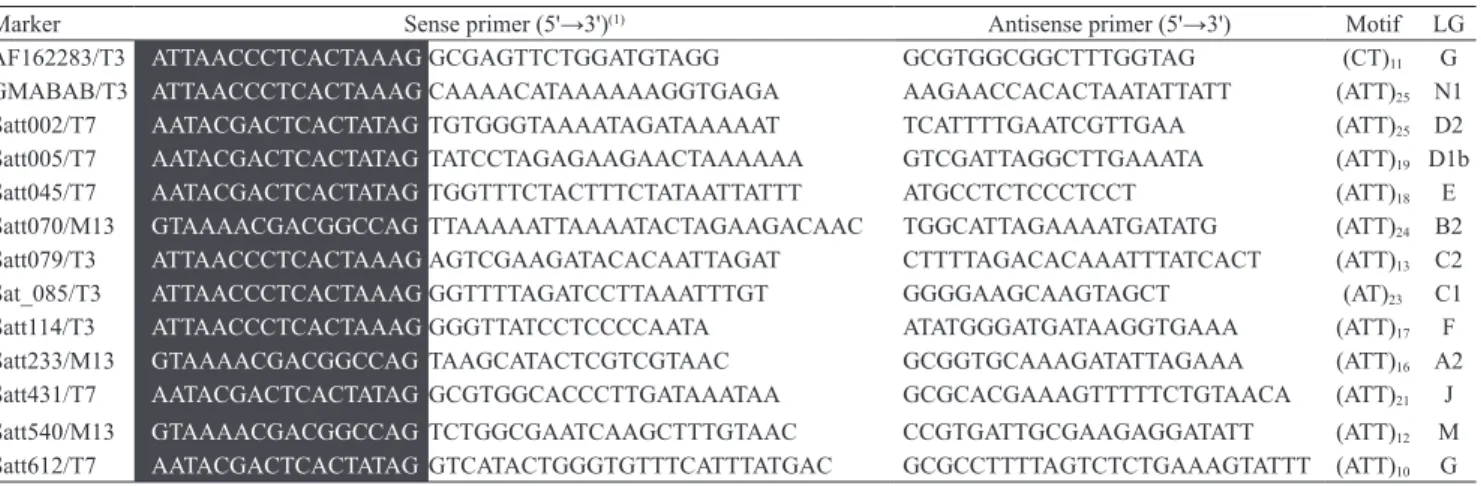
higher number of alleles (Table 1). All loci used were described by Cregan et al. (1999), except for AF162284 and Satt612, which were obtained from the integrated genetic linkage map constructed by Song et al. (2004).
The amplification program consisted of an initial
Pesq. agropec. bras., Brasília, v.48, n.3, p.270‑279, mar. 2013 DOI: 10.1590/S0100‑204X2013000300005
cycles with denaturation at 94°C for 40 s, annealing at 50°C for 40 s, and extension at 72°C for 40 s. After the
thirty‑fifth cycle, a final extension step was performed
at 72°C, for 25 min.
The cultivars were genotyped by both methods, i.e., conventional PCR evaluated in polyacrylamide gel and PCR with UTSP evaluated by capillary electrophoresis.
The fluorescent genotyping (fragment size analysis)
was performed in duplicate, on two different days (proof and counter proof). In the conventional method, PCR products were separated by electrophoresis in a 10% polyacrylamide gel, using 1X TBE buffer
(89 mmol L‑1 Tris‑borate, 2 mmol L‑1 EDTA, pH 8.0) for approximately 3 hours at 120 V, and stained with ethidium bromide (0.2 g mL‑1) for 10 min. A vertical electrophoresis tank was used with a 15 cm dual glass plate, separated by 1.0 mm spacers, with a capacity of 60 samples per gel. The fragment sizes were estimated by comparison with a 50 bp DNA ladder (Promega, Madison, WI, USA). In the UTSP method, markers with distinct sizes and tagged with different
fluorochromes were grouped in order to simultaneously detect by fluorescence the amplified alleles. The
sample used for the electrophoretic analysis consisted of 0.4 µL of the three independent PCR reactions, 8.55 µL Hi‑Di formamide, and 0.25 µL ROX 500 molecular size standard. Capillary electrophoresis was performed in the ABI 3130xl equipment, according to the manufacturer’s instructions (Life Technologies do Brasil Ltda., São Paulo, SP, Brazil). Data were automatically collected and coded using the software Gene Mapper 4.0 (Life Technologies do Brasil Ltda., São Paulo, SP, Brazil).
To check the effectiveness of the construction of the tailed sense microsatellite primer, a test was performed
to compare the sizes (17 bp) of the products amplified
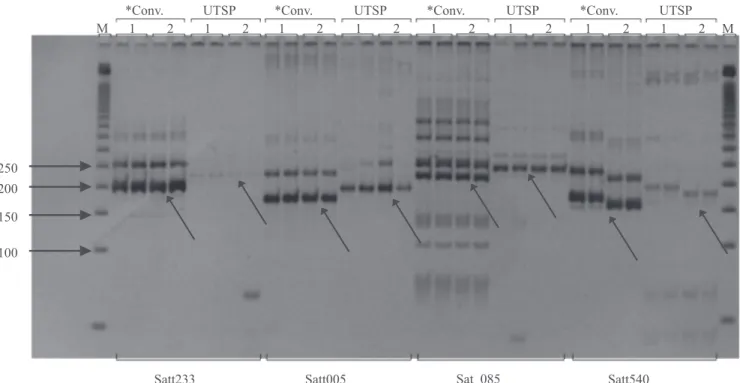
by conventional PCR (sense primer with no tail) and by UTSP PCR. The PCR reactions were performed separately using cultivars BMX Magna RR and CD 202, which were analyzed in duplicate for four microsatellite loci (Satt233, Satt005, Sat_085, and Satt540) in both methods, and the electrophoresis was performed as described above for the conventional method, in 10% polyacrylamide gel (Figure 2). The polymorphic information content (PIC) was calculated for each marker according to the expression:
in which, Pij is the frequency of the
jth allele of the ith marker (Anderson et al., 1993). The probability of random identity was calculated as described by Schuster et al. (2009), according to
the formula: in which Pi is the frequency of allele
Ai, and n is the number of the evaluated marker. For those eventually heterozygous loci, the frequencies used in the formula were that of the summed individual alleles.
The genetic relationships between genotypes were assessed by the complement of the similarity index for codominant and multiallelic variables from the
Figure 1. Universal tail sequence primers (UTSP) method:
unweighted index used to calculate the similarity matrix. The unweighted index is given by:
, in which L is the total number
of loci analyzed, and Cj is the number of common alleles between cultivar pairs iand i'.
The cophenetic correlation was obtained from the dissimilarity matrix, and cultivar clustering was performed by the unweighted pair group method with arithmetic mean (UPGMA). The correlation between the dissimilarity matrices obtained by the two genotyping methods was performed by the Mantel test with 10,000 simulations. The Genes software, version 2009, was used for these analyses (Cruz, 2006).
Results and Discussion
The expected difference of 17 bp between the amplicons generated by the two genotyping methods
was confirmed (Figure 2). The DNA bands obtained by
the UTSP method were less intense; however, fewer
unspecific bands were obtained by this method. This aspect can be easily observed in the amplification profiles obtained with the marker Sat_085.
The fragment sizes estimated for each marker in both genotyping methods for the 30 evaluated soybean cultivars are shown in Tables 2 and 3. Although the allele size obtained by the UTSP method was 17 bp larger than the corresponding one genotyped by the conventional method, small differences could be
observed between the sizes of some of the alleles when the two methods were compared. In the evaluated electrophoresis conditions, fragments differing by
less than 4 bp had their identification hampered
when genotyped by the conventional method in polyacrylamide gels.
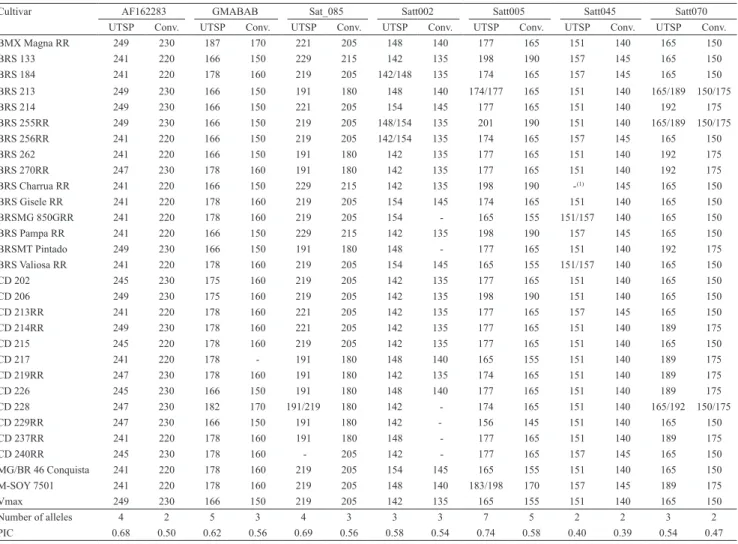
For the UTSP genotyping method, the total number of alleles was 50, ranging from 2 (Satt045) to 7 (Satt005) per marker with an average of 3.85. The PIC ranged from 0.40 (Satt045) to 0.74 (Satt005), with an average of 0.62. For the conventional method, the number of alleles was 38, ranging from 2 (Satt045, Satt070, and AF162283) to 5 (Satt005) alleles per marker, with an average of 2.92. The PIC ranged from 0.39 (Satt045) to 0.67 (Satt079), with an average of 0.56 (Tables 2 and 3). Several authors have used microsatellite markers to characterize soybean genotypes with different goals: wide genome genotyping (Sayama et al., 2011), genetic diversity for different traits (Mian et al., 2009; Singh et al., 2010), and germplasm characterization (Wang et al., 2008; Mulato et al., 2010). In these studies, the number of alleles per marker and PIC values ranged from 3 to 18 and from 0.507 to 0.815, respectively. The results obtained in the present study are in accordance with those of Priolli et al. (2002), who characterized 186 Brazilian soybean genotypes using 12 SSR loci and detected an average of 5.3 alleles per locus and a mean PIC value of 0.64.
The differences found between the two tested methods, regarding number of alleles and PIC values, can be explained by the greater accuracy of the UTSP
Table 1. Selected microsatellite primers for the analysis of soybean cultivars, using the conventional and the universal tail
sequence primers (UTSP) methods.
Marker Sense primer (5'→3')(1) Antisense primer (5'→3') Motif LG
AF162283/T3 ATTAACCCTCACTAAAGGCGAGTTCTGGATGTAGG GCGTGGCGGCTTTGGTAG (CT)11 G
GMABAB/T3 ATTAACCCTCACTAAAGCAAAACATAAAAAAGGTGAGA AAGAACCACACTAATATTATT (ATT)25 N1
Satt002/T7 AATACGACTCACTATAGTGTGGGTAAAATAGATAAAAAT TCATTTTGAATCGTTGAA (ATT)25 D2
Satt005/T7 AATACGACTCACTATAGTATCCTAGAGAAGAACTAAAAAA GTCGATTAGGCTTGAAATA (ATT)19 D1b
Satt045/T7 AATACGACTCACTATAGTGGTTTCTACTTTCTATAATTATTT ATGCCTCTCCCTCCT (ATT)18 E
Satt070/M13 GTAAAACGACGGCCAGTTAAAAATTAAAATACTAGAAGACAAC TGGCATTAGAAAATGATATG (ATT)24 B2
Satt079/T3 ATTAACCCTCACTAAAGAGTCGAAGATACACAATTAGAT CTTTTAGACACAAATTTATCACT (ATT)13 C2
Sat_085/T3 ATTAACCCTCACTAAAGGGTTTTAGATCCTTAAATTTGT GGGGAAGCAAGTAGCT (AT)23 C1
Satt114/T3 ATTAACCCTCACTAAAGGGGTTATCCTCCCCAATA ATATGGGATGATAAGGTGAAA (ATT)17 F
Satt233/M13 GTAAAACGACGGCCAGTAAGCATACTCGTCGTAAC GCGGTGCAAAGATATTAGAAA (ATT)16 A2
Satt431/T7 AATACGACTCACTATAGGCGTGGCACCCTTGATAAATAA GCGCACGAAAGTTTTTCTGTAACA (ATT)21 J
Satt540/M13 GTAAAACGACGGCCAGTCTGGCGAATCAAGCTTTGTAAC CCGTGATTGCGAAGAGGATATT (ATT)12 M
Satt612/T7 AATACGACTCACTATAGGTCATACTGGGTGTTTCATTTATGAC GCGCCTTTTAGTCTCTGAAAGTATTT (ATT)10 G
Pesq. agropec. bras., Brasília, v.48, n.3, p.270‑279, mar. 2013 DOI: 10.1590/S0100‑204X2013000300005
the “slippage” of DNA polymerase during DNA synthesis, producing fragments sizes similar to the real size of the allele (Hauge & Litt, 1993). The stutter can overlay heterozygote alleles and interfere with the interpretation of the generated
amplification profile (Miller & Yuan, 1997). Higher
precision in the detection of alleles can be obtained under electrophoretic systems with high resolution capabilities. This explains why a higher number of heterozygotes could be detected in the UTSP method. An important parameter to be considered for cultivar
identification is the probability of random identity
(PRI), which corresponds to the probability that an individual taken at random and analyzed with
a specific set of markers will be equal to any other
individual in the population (Schuster et al., 2009). PRI is calculated by the product of individual allele frequencies at each locus. In the case of the UTSP method, PRI varied from 1.41x10‑8 (CD 240RR) to 9.54x10‑6 (BRS 184), whereas for the conventional method, PRI varied from 1.12x10‑6 (BRS Pampa RR) to 8.45x10‑5 (CD 219RR). These numbers indicate that
Figure 2. Comparison between the amplification profiles obtained with the conventional (*Conv.) method and with the
universal tail sequence primers (UTSP) method. The markers are identified at the bottom portion of the figure. Cultivar BMX Magna RR is indicated by number 1, and CD 202, by number 2. “M” indicates a 50 bp DNA ladder. Analyses were done in duplicate. The sizes of the DNA ladder fragments (bp) are indicated by arrows on the left side of the figure. The other arrows indicate the specific amplification product for each marker.
method, which uses an automatic DNA sequencer, as opposed to gel electrophoresis in the conventional method (Wenz et al., 1998). These differences can be overcome if longer polyacrylamide gel is used under denaturing conditions (Sánches‑Pérez et al., 2006). At least two extra alleles could be detected for markers Satt005, GMABAB, and AF162283,
using the UTSP method. Amplification artifacts may also have influenced the number of alleles detected
by either method. It is a well‑known fact that Taq DNA polymerase adds an extra nucleotide (usually adenosine) to the 3’ end of the newly synthesized
fragment. This modification may affect the precise
determination of the fragment size (Pompanon et al., 2005). A larger extension time (more than 20 min)
after the final PCR cycle increases the chance of all
fragments being adenylated, minimizing the effect of the extra nucleotide on fragment size determination,
therefore, the final extension time was increased in
both genotyping methods.
Another common artifact that can influence data
the discriminating power of the UTSP method, for this population, can be as high as one order of magnitude greater than that of the conventional method.
Despite the differences between the two genotyping methods, the correlation between the dissimilarity
matrices obtained by them (0.8026) was significant
at 1% probability by the Mantel test and the t test (p=9.99 x 10‑5). Values for cophenetic correlation, distortion, and stress were 0.74, 2.35%, and 15.33% with the UTSP method, and 0.71, 3.04%, and 17.44% with the conventional method. The higher cophenetic correlation and the lower values of distortion and stress obtained for the UTSP method indicate that the graphic
representation of genetic distances will better fit the
original distance matrix.
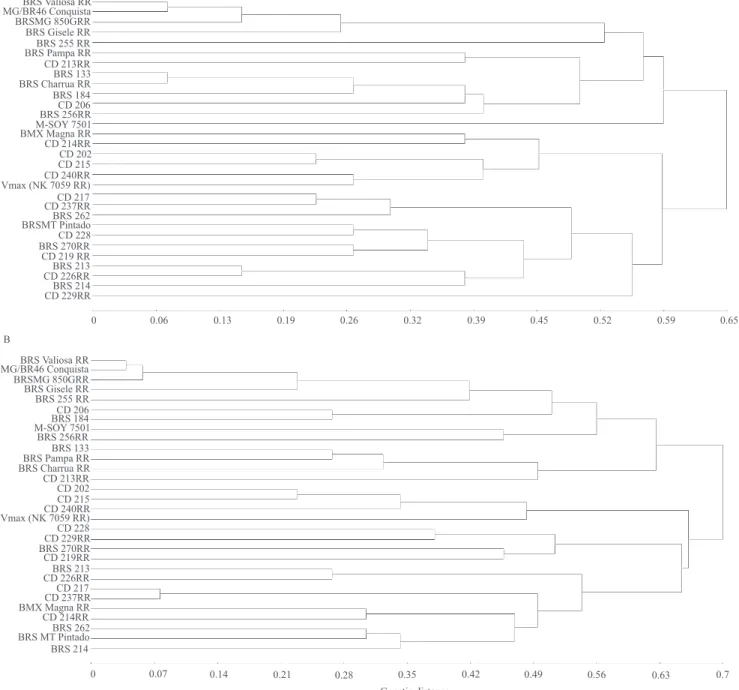
The obtained dendrograms were also compared and evaluated as to the formation of genotype groups (Figure 3). With the set of 13 markers used, all genotypes could be distinguished, even those closely related genetically, showing the high discrimination power of this set of markers. It has already been shown that the distinction of soybean cultivars is extremely
difficult due to their narrow genetic base, especially
between essentially derived cultivars (Rodrigues et al., 2008).
The groups formed by the two methods were highly similar and coherent with their pedigree and phenotypic data used for varietal registration. For instance, cultivars MG/BR 46 Conquista, BRS Valiosa RR, and BRSMG 850GRR were grouped together
Table 2. Estimated size of amplified fragments, number of alleles, and polymorphic information content (PIC) in 30 soybean
cultivars for the AF162283, GMABAB, Sat_085, Satt002, Satt005, Satt045, and Satt070 markers, using the universal tail sequence primers (UTSP) and the conventional methods.
Cultivar AF162283 GMABAB Sat_085 Satt002 Satt005 Satt045 Satt070 UTSP Conv. UTSP Conv. UTSP Conv. UTSP Conv. UTSP Conv. UTSP Conv. UTSP Conv. BMX Magna RR 249 230 187 170 221 205 148 140 177 165 151 140 165 150
BRS 133 241 220 166 150 229 215 142 135 198 190 157 145 165 150
BRS 184 241 220 178 160 219 205 142/148 135 174 165 157 145 165 150 BRS 213 249 230 166 150 191 180 148 140 174/177 165 151 140 165/189 150/175
BRS 214 249 230 166 150 221 205 154 145 177 165 151 140 192 175
BRS 255RR 249 230 166 150 219 205 148/154 135 201 190 151 140 165/189 150/175 BRS 256RR 241 220 166 150 219 205 142/154 135 174 165 157 145 165 150
BRS 262 241 220 166 150 191 180 142 135 177 165 151 140 192 175
BRS 270RR 247 230 178 160 191 180 142 135 177 165 151 140 192 175 BRS Charrua RR 241 220 166 150 229 215 142 135 198 190 ‑(1) 145 165 150 BRS Gisele RR 241 220 178 160 219 205 154 145 174 165 151 140 165 150 BRSMG 850GRR 241 220 178 160 219 205 154 ‑ 165 155 151/157 140 165 150 BRS Pampa RR 241 220 166 150 229 215 142 135 198 190 157 145 165 150 BRSMT Pintado 249 230 166 150 191 180 148 ‑ 177 165 151 140 192 175 BRS Valiosa RR 241 220 178 160 219 205 154 145 165 155 151/157 140 165 150
CD 202 245 230 175 160 219 205 142 135 177 165 151 140 165 150
CD 206 249 230 175 160 219 205 142 135 198 190 151 140 165 150
CD 213RR 241 220 178 160 221 205 142 135 177 165 157 145 165 150
CD 214RR 249 230 178 160 221 205 142 135 177 165 151 140 189 175
CD 215 245 220 178 160 219 205 142 135 177 165 151 140 165 150
CD 217 241 220 178 ‑ 191 180 148 140 165 155 151 140 189 175
CD 219RR 247 230 178 160 191 180 142 135 174 165 151 140 189 175
CD 226 245 230 166 150 191 180 148 140 177 165 151 140 189 175
CD 228 247 230 182 170 191/219 180 142 ‑ 174 165 151 140 165/192 150/175
CD 229RR 247 230 166 150 191 180 142 ‑ 156 145 151 140 165 150
CD 237RR 241 220 178 160 191 180 148 ‑ 177 165 151 140 189 175
CD 240RR 245 230 178 160 ‑ 205 142 ‑ 177 165 157 145 165 150
MG/BR 46 Conquista 241 220 178 160 219 205 154 145 165 155 151 140 165 150 M‑SOY 7501 241 220 178 160 219 205 148 140 183/198 170 157 145 189 175
Vmax 249 230 166 150 219 205 142 135 165 155 151 140 165 150
Number of alleles 4 2 5 3 4 3 3 3 7 5 2 2 3 2
Pesq. agropec. bras., Brasília, v.48, n.3, p.270‑279, mar. 2013 DOI: 10.1590/S0100‑204X2013000300005
(Figure 3). Cultivar BRS Valiosa RR is essentially derived from cultivar MG/BR 46 Conquista. It was
obtained after five backcross cycles, but it harbors a
gene conferring resistance to glyphosate. Cultivar BRSMG 850GRR was protected and declared by its holders as being highly similar to BRS Valiosa RR. Two other cultivars that were grouped together were CD 215RR and CD 202. Cultivar CD 215RR was protected and declared as highly similar to CD 202. A third example refers to cultivars CD 237RR and CD 217, which were grouped together. CD 237RR is essentially derived from cultivar CD 217. However, grouping of cultivars BRS Pampa RR, BRS 133, and BRS Charrua RR by both genotyping methods
was slightly discrepant. These three cultivars were grouped together by the UTSP method, but cultivar BRS Pampa RR was grouped separately by the conventional method. BRS Pampa RR was obtained from the triple cross between Embrapa 61, E96‑246, and BRS 133, followed by backcrossing to BRS 133. BRS Charrua RR was protected as being highly similar to BRS 133.
The use of microsatellite marker data for distinguishing soybean cultivars showed high similarity with pedigree information. This is a strong indication that microsatellite marker information can be used as a complementary tool, associated to morphological
descriptors, for germplasm classification and
intellectual property protection.
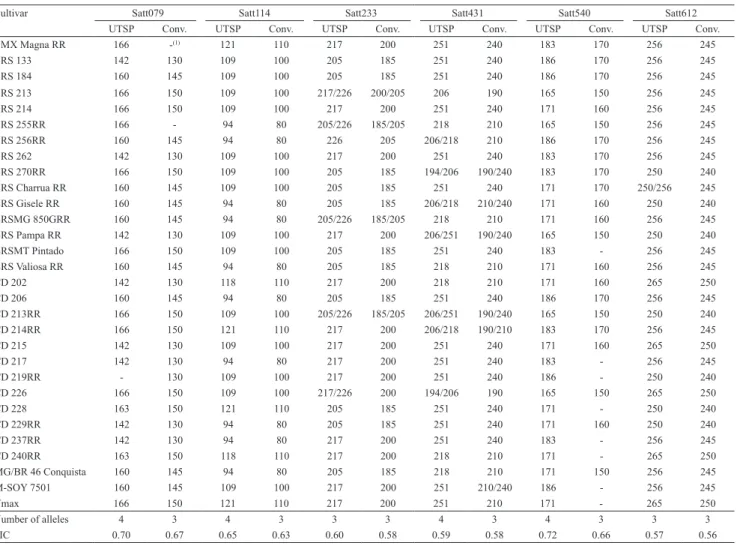
Table 3. Estimated size of amplified fragments, number of alleles, and polymorphic information content (PIC) in 30 soybean
cultivars for the Satt079, Satt114, Satt233, Satt431, Satt540, and Satt612 markers, using the universal tail sequence primers (UTSP) and the conventional methods.
Cultivar Satt079 Satt114 Satt233 Satt431 Satt540 Satt612
UTSP Conv. UTSP Conv. UTSP Conv. UTSP Conv. UTSP Conv. UTSP Conv.
BMX Magna RR 166 ‑(1) 121 110 217 200 251 240 183 170 256 245
BRS 133 142 130 109 100 205 185 251 240 186 170 256 245
BRS 184 160 145 109 100 205 185 251 240 186 170 256 245
BRS 213 166 150 109 100 217/226 200/205 206 190 165 150 256 245
BRS 214 166 150 109 100 217 200 251 240 171 160 256 245
BRS 255RR 166 ‑ 94 80 205/226 185/205 218 210 165 150 256 245
BRS 256RR 160 145 94 80 226 205 206/218 210 186 170 256 245
BRS 262 142 130 109 100 217 200 251 240 183 170 256 245
BRS 270RR 166 150 109 100 205 185 194/206 190/240 183 170 250 240 BRS Charrua RR 160 145 109 100 205 185 251 240 171 170 250/256 245 BRS Gisele RR 160 145 94 80 205 185 206/218 210/240 171 160 250 240 BRSMG 850GRR 160 145 94 80 205/226 185/205 218 210 171 160 256 245 BRS Pampa RR 142 130 109 100 217 200 206/251 190/240 165 150 250 240
BRSMT Pintado 166 150 109 100 205 185 251 240 183 ‑ 256 245
BRS Valiosa RR 160 145 94 80 205 185 218 210 171 160 256 245
CD 202 142 130 118 110 217 200 218 210 171 160 265 250
CD 206 160 145 94 80 205 185 251 240 186 170 256 245
CD 213RR 166 150 109 100 205/226 185/205 206/251 190/240 165 150 250 240
CD 214RR 166 150 121 110 217 200 206/218 190/210 183 170 256 245
CD 215 142 130 109 100 217 200 251 240 171 160 265 250
CD 217 142 130 94 80 217 200 251 240 183 ‑ 256 245
CD 219RR ‑ 130 109 100 217 200 251 240 186 ‑ 250 240
CD 226 166 150 109 100 217/226 200 194/206 190 165 150 265 250
CD 228 163 150 121 110 205 185 251 240 171 ‑ 250 240
CD 229RR 142 130 94 80 205 185 251 240 171 160 250 240
CD 237RR 142 130 94 80 217 200 251 240 183 ‑ 256 245
CD 240RR 163 150 118 110 217 200 218 210 171 ‑ 265 250
MG/BR 46 Conquista 160 145 94 80 205 185 218 210 171 150 256 245
M‑SOY 7501 160 145 109 100 217 200 251 210/240 186 ‑ 256 245
Vmax 166 150 121 110 217 200 251 210 171 ‑ 265 250
Number of alleles 4 3 4 3 3 3 4 3 4 3 3 3
PIC 0.70 0.67 0.65 0.63 0.60 0.58 0.59 0.58 0.72 0.66 0.57 0.56
Conclusions
1. The universal tail sequence primers (UTSP) method is very effective to detect polymorphisms among soybean cultivars, when compared to the conventional genotyping method using polyacrylamide gels.
2. The low cost of the UTSP method associated with its high accuracy, possibility for automation,
and high throughput analysis makes it ideal for the characterization of soybean cultivars and for the determination of genetic purity.
3. A highly robust and informative set of SSR markers is presented here, which can be used for
diversity analysis and for identification of soybean
cultivars.
Figure 3. Clustering of 30 soybean cultivars obtained with: A, the conventional genotyping method; and B, the universal
Pesq. agropec. bras., Brasília, v.48, n.3, p.270‑279, mar. 2013 DOI: 10.1590/S0100‑204X2013000300005
Acknowledgements
To the Agência Brasileira de Inovação (Finep) for
financial support; and to AgroGenética, for providing a
sound infrastructure for carrying out the research.
References
ANDERSON, J.A.; CHURCHILL, G.A.; AUTRIQUE, J.E.; TANKSLEY, S.D.; SORRELLS M.E. Optimizing parental selection for genetic linkage maps. Genome, v.36, p.181‑186, 1993. DOI: 10.1139/g93‑024.
ARRUDA, M.P. de; GONÇALVES, E.C.; SCHNEIDER, M.P.C.; SILVA, A.L.C.; MORIELLE‑VERSUTE, E. An alternative genotyping method using dye‑labeled universal primer to reduce
unspecific amplifications. Molecular Biology Reports, v.37,
p.2031‑2036, 2010. DOI: 10.1007/s11033‑009‑9655‑7.
BRASIL. Ministério da Agricultura, Pecuária e Abastecimento. Serviço Nacional de proteção de cultivar. CultivarWeb. 2013. Disponível em: <http://extranet.agricultura.gov.br/php/snpc/ cultivarweb/cultivares_protegidas.php>. Acesso em: 9 mar. 2013. COMPANHIA NACIONAL DE ABASETECIMENTO.
Acompanhamento da safra 2012/2013. 2013. Disponível em:
<http://www.conab.gov.br>. Acesso em: 8 mar. 2013.
CREGAN, P.B.; JARVIK, T.; BUSH, A.L.; SHOEMAKER, R.C.; LARK, K.G.; KAHLER, A.L.; KAYA, N.; VANTOAI, T.T.; LOHNES, D.G.; CHUNG, J.; SPECHT, J.E. An integrated genetic linkage map of the soybean genome. Crop Science, v.39, p.1464‑1490, 1999. DOI: 10.2135/cropsci1999.3951464x.
CRUZ, C.D. Programa GENES: versão Windows: aplicativo computacional em genética e estatística. Viçosa: UFV, 2006. 648p. DINIZ, F.M.; IYENGAR, A.; LIMA, P.S. da C.; MACLEAN, N.; BENTZEN, P. Application of a double‑enrichment procedure for microsatellite isolation and the use of tailed primers for high throughput genotyping. Genetics and Molecular Biology, v.30, p.380‑384, 2007. DOI: 10.1590/S1415‑47572007000300014.
DIWAN, N.; CREGAN, P.B. Automated sizing of fluorescent
labeled simple sequence repeat (SSR) markers to assay genetic variation in soybean. Theoretical and Applied Genetics, v.95, p.723‑733, 1997. DOI: 10.1007/s001220050618.
GARCIA, A.F.; ALBERINI, J.L.; ZUCCHI, M.I.; SOUZA, A.P.
de. Microsatellite molecular markers in the cultivar identification
of Brazilian soybean for human consumption. Crop Breeding and Applied Biotechnology, v.7, p.155‑164, 2007.
GOULART, I.C.G. dos R.; MEROTTO JUNIOR, A.; NUNES, A.L.; BERED, F. Otimização da utilização de marcadores moleculares microssatélites e sua aplicação em estudos com plantas daninhas. Planta Daninha, v.29, p.1175‑1181, 2011. DOI: 10.1590/S0100‑83582011000500025.
HAUGE X.Y.; LITT, M. A study of the origin of ‘shadow bands’ seen when typing dinucleotide repeat polymorphisms by the PCR.
Human Molecular Genetics, v.4, p.411‑415, 1993. DOI: 10.1093/
hmg/2.4.411.
HAYDEN, M.J.; NGUYEN, T.M.; WATERMAN, A.; CHALMERS, K.J. Multiplex‑ready PCR: a new method for multiplexed SSR and SNP genotyping. BMC Genomics, v.9, 2008. DOI: 10.1186/1471‑2164‑9‑80.
KALIA, R.K.; RAI, M.K.; KALIA, S.; SINGH, R.; DHAWAN, A.K. Microsatellite markers: an overview of the recent progress in plants. Euphytica, v.177, p.309‑334, 2011. DOI: 10.1007/ s10681‑010‑0286‑9.
LAZARUK, K.; WALSH, P.S.; OAKS, F.; GILBERT, D.; ROSENBLUM, B.B.; MENCHEN, S.; SCHEIBLER, D.; WENZ, H.M.; HOLT, C.; WALLIN, J. Genotyping of forensic short tandem repeat (STR) systems based on sizing precision in a capillary electrophoresis instrument. Electrophoresis, v.19, p.86‑93, 1998. DOI: 10.1002/elps.1150190116.
MARCELINO, F.C.; GUIMARÃES, M.F.M.; BARROS, E.G.
de. Detection and quantification of Roundup Ready (R) soybean
residues in sausage samples by conventional and real‑time PCR.
Ciência e Tecnologia de Alimentos, v.28, p38‑45, 2008. DOI:
10.1590/S0101‑20612008000500007.
MIAN, M.A.R.; KANG, S.‑T.; REDINBAUGH, M.G. Microsatellite diversity of soybean genotypes differing in bean pod mottle virus leaf symptom. Canadian Journal of Plant Science, v.89, p.359‑367, 2009. DOI: 10.4141/CJPS08046.
MILLER, M.J.; YUAN, B.Z. Semiautomated resolution of overlapping stutter patterns in genomic microsatellite analysis.
Analytical Biochemistry, v.251, p.50‑56, 1997. DOI: 10.1006/
abio.1997.2234.
MISSIAGGIA, A.; GRATTAPAGLIA, D. Plant microsatellite
genotyping with 4‑color fluorescent detection using multiple‑tailed
primers. Genetics and Molecular Research, v.5, p.72‑78, 2006. MULATO, B.M.; MÖLLER, M.; ZUCCHI, M.I.; QUECINI, V.; PINHEIRO, J.B. Genetic diversity in soybean germplasm
identified by SSR and EST‑SSR markers. Pesquisa Agropecuária
Brasileira, v.45, p.276‑283, 2010. DOI: 10.1590/S0100‑
204X2010000300007.
OBLESSUC, P.R.; CAMPOS, T. de; CARDOSO, J.M.K.; SFORÇA, D.A.; BARONI, R.M.; SOUZA, A.P.;
BENCHIMOL, L.L. Adaptation of fluorescent technique for
genotyping with new microsatellite markers in common bean.
Pesquisa Agropecuária Brasileira, v.44, p.638‑644, 2009. DOI:
10.1590/S0100‑204X2009000600013.
OETTING, W.S.; LEE, H.K.; FLANDERS, D.J.; WIESNER, G.L.; SELERS, T.A.; KING, R.A. Linkage analysis with multiplexed
short tandem repeat polymorphisms using infrared fluorescence
and M13 tailed primers. Genomics, v.30, p.450‑458, 1995. DOI: 10.1006/geno.1995.1264.
OLIVEIRA, M.B.; VIEIRA, E.S.N.; SCHUSTER, I. Construction
of a molecular database for soybean cultivar identification in
Brazil. Genetics and Molecular Research, v.9, p.705‑720, 2010. DOI: 10.4238/vol9‑2gmr706.
PRIOLLI, R.H.G.; MENDES‑JUNIOR, C.T.; ARANTES, N.E.; CONTEL, E.P.B. Characterization of Brazilian soybean cultivars using microsatellite markers. Genetics and Molecular Biology, v.25, p.185‑193, 2002. DOI: 10.1590/S1415‑47572002000200012. PRIOLLI, R.H.G.; MENDES‑JUNIOR, C.T.; SOUSA, S.M.B.; SOUSA, N.E.A.; CONTEL, E.P.B. Diversidade genética da soja entre períodos e entre programas de melhoramento no Brasil.
Pesquisa Agropecuária Brasileira, v.39, p.967‑975, 2004. DOI:
10.1590/S0100‑204X2004001000004.
PRIOLLI, R.H.G.; PINHEIRO, J.B.; ZUCCHI, M.I.; BAJAY, M.M.; VELLO, N.A. Genetic diversity among Brazilian soybean cultivars base on SSR loci and pedigree data. Brazilian Archives of Biology and Technology, v.53, p.519‑531, 2010. DOI: 10.1590/ S1516‑89132010000300004.
RODRIGUES, D.H.; ALCÂNTARA NETO, F. de; SCHUSTER,
I. Identification of essentially derived soybean cultivars
using microsatellite markers. Crop Breeding and Applied Biotechnology, v.8, p.74‑78, 2008.
SÁNCHEZ‑PÉREZ, R.; BALLESTER, J.; DICENTA, F.; ARÚS, P.; MARTÍNEZ‑GÓMEZ, P. Comparison of SSR polymorphisms using automated capillary sequencers, and polyacrylamide and agarose gel electrophoresis: implications for the assessment of genetic diversity and relatedness in almond. Scientia Horticulturae, v.108, p.310‑316, 2006. DOI: 10.1016/j.scienta.2006.02.004. SAYAMA, T.; HWANG, T.Y.; KOMATSU, K.; TAKADA, Y.; TAKAHASHI, M.; KATO, S.; SASAMA, H.; HIGASHI, A.; NAKAMOTO, Y.; FUNATSUKI, H.; ISHIMOTO, M. Development and application of a whole‑genome simple sequence repeat panel for high‑throughput genotyping in soybean. DNA Research, v.18, p.107‑115, 2011. DOI: 10.1093/dnares/dsr003.
SCHUSTER, I.; QUEIROZ, V.T. de; TEIXEIRA, A.I.; BARROS, E.G. de; MOREIRA, M.A. Determinação da pureza varietal de sementes de soja com o auxílio de marcadores moleculares microssatélites. Pesquisa Agropecuária Brasileira, v.39, p.247‑253, 2004. DOI: 10.1590/S0100‑204X2004000300007. SCHUSTER, I.; VIEIRA, E.S.N.; PADILHA, L. Marcadores moleculares no pós‑melhoramento. In: BÓREM, A.; CAIXETA, E.T. (Ed.). Marcadores moleculares. 2.ed. Viçosa: 2009. p.177‑208.
SINGH, R.K.; BHATIA, V.S.; BHAT, K.V.; MOHAPATRA, T.; SINGH, N.K.; BANSAL, K.C.; KOUNDAL, K.R. SSR and AFLP based genetic diversity of soybean germplasm differing in photoperiod sensitivity. Genetics and Molecular Biology, v.33, p.319‑324, 2010. DOI: 10.1590/S1415‑47572010005000024. SONG, Q.J.; MAREK, L.F.; SHOEMAKER, R.C.; LARK, K.G.; CONCIBIDO, V.C.; DELANNAY, X.; SPECHT, J.E.; CREGAN, P.B. A new integrated genetic linkage map of the soybean.
Theoretical and Applied Genetics, v.109, p.122‑128, 2004. DOI: 10.1007/s00122‑004‑1602‑3.
WANG, L.X.; GUAN, R.X.; LI, Y.H.; LIN, F.Y.; LUAN, W.J.; LI, W.; MA, Y.S.; LIU, Z.X.; CHANG, R.Z.; QIU, L.J. Genetic diversity of Chinese spring soybean germplasm revealed by SSR markers. Plant Breeding, v.127, p.56‑61, 2008. DOI: j.1439‑ 0523.2007.01429.x.
WENZ, H.M.; ROBERTSON, J.M.; MENCHEN, S.; OAKS, F.; DEMOREST, D.M.; SCHEIBLER, D.; ROSENBLUM, B.B.; WIKE, C.; GILBERT, D.A.; EFCAVITCH J.W. High‑precision genotyping by denaturing capillary electrophoresis. Genome Research, v.8, p.69‑80, 1998.