ABSTRACT: The development of efficient and low-cost genotyping methods is essential to pre-cise genetic characterization of cultivars. Here, we present a system based on fluorescently labeled universal tail sequence primers (UTSP) to resolve microsatellite (SSR) markers as an alternative for molecular fingerprinting of maize. A set of 20 SSRs using the UTSP presented an average polymorphic information content of 0.84, which provided a probability of random identity ranging from 10−7 to 10−14, and a minimum exclusion power of 99.99998 % in a group of 48 tropical maize single-cross hybrids traded in Brazil. The genetic diversity analysis based on multidimensional scaling explained approximately 28 % of the total variance for the first two coordinates, tending to group the hybrids according to their respective origin. Additionally, this genotyping system presented a high distinctiveness capacity, which is widely recommended for genetic purity and fingerprinting analyses. Thus, this marker system has a strong potential as a tool for complementary analysis of distinguishability, uniformity and stability required for cultivar registration.
Keywords: Zea mays, fingerprinting, genotyping, cultivar protection
Universal tail sequence-SSR applied to molecular characterization of tropical maize
Carlos Alexandre Gomes Ribeiro1, Marcos de Oliveira Pinto2, Talles Eduardo Ferreira Maciel3, Maria Marta Pastina2, Everaldo
Gonçalves de Barros4, Claudia Teixeira Guimarães2*
1Federal University of Viçosa − Dept. of Genetics and Breeding, Av. PH Rolfs, s/n − 36570-000 − Viçosa, MG − Brazil.
2Embrapa Maize and Sorghum, Rod. MG 424, km 65 − 35701-970 − Sete Lagoas, MG − Brazil.
3Federal University of Viçosa/Institute of Biotechnology Applied to Agriculture.
4Catholic University of Brasília −Dept. of Genomic Sciences and Biotecnhology, SGAN, 916 − 70790-160 − Brasília, DF − Brazil.
*Corresponding author <[email protected]>
Edited by: Roberto Fritsche Neto
Received March 02, 2016 Accepted April 16, 2016
Introduction
Maize is the most produced cereal in the world, and Brazil ranks as the third largest producer. Currently, over 2,500 maize cultivars, including inbred lines, single-cross hybrids, and varieties are registered in the National Culti-var Registration Service (MAPA, 2015). In 2014/2015, the Brazilian maize seed market accounted for over US$ 1.3 billion, considering the retail seed price (APPS, 2015), thus emphasizing the strategic importance of improved maize cultivars to the national economy. The increasing num-ber of registered maize cultivars hampers their distinction based on phenotypic analyses. Therefore, an accurate as-sessment of distinctiveness is needed for distinguishability, uniformity and stability (DUS) tests, which are officially required for cultivar registration in Brazil (MAPA, 2015). For this purpose, a set of morphological descriptors for each species has been defined (MAPA, 2015), which pres-ents a number of limitations, such as late and subjective evaluation, environmental influence and reduced number of traits. Thus, molecular markers can be an alternative to complement the morphological evaluation, bringing a su-perior level of accuracy to DUS tests (Priolli et al., 2002).
Several studies have been proposed for including microsatellites or simple sequence repeat (SSR) markers as molecular descriptors for DUS tests in Brazil. These markers have been used to characterize banana (Jesus et al., 2009), essentially derived soybean cultivars (Rodrigues et al., 2008) and for genetic purity certification of maize hybrid seeds (Salgado et al., 2006). However, little
informa-tion is available on a suitable combinainforma-tion of SSR mark-ers to be applied as molecular descriptors for commercial maize hybrids in Brazil.
SSR is a relatively simple technique, but its low level of automation increases the costs and time of large-scale analyses. The inclusion of an extended fluorescently la-beled tail in the SSR primers has been proposed to improve automation and reduce genotyping costs (Cryer et al., 2005; Arruda et al., 2010; Diniz et al., 2007; Hayden et al., 2008; Missiaggia and Grattapaglia, 2006; Ribeiro et al., 2013).
There is increasing demand for molecular fingerprint-ing of maize cultivars, especially as a result of the Plant Vari-ety Protection law, which requires a rapid and cost-effective genotyping methodology. Thus, our current study aimed to validate a set of SSR markers using a universal tail sequence primers (UTSP) system in 48 Brazilian maize single-cross hy-brids for future application in cultivar protection.
Materials and Methods
Plant material
We used 48 commercial maize single-cross hy-brids that were available in the Brazilian seed market in 2011. The seeds of all cultivars were purchased in local markets. The maize cultivars were developed by eight private seed companies and by Embrapa Maize & Sor-ghum, representing the public sector. Three single-cross hybrids from Embrapa were genotyped as well as their corresponding parental lines in order to confirm the ori-gin of the alleles present in the hybrids.
DNA extraction and genotyping
Genomic DNA was extracted using 96-well plates by the cetyl trimethylammonium bromide (CTAB) meth-od (Saghai-Maroof et al., 1984). Leaf discs were collected from a bulk of 20 seedlings, representing each genotype. The DNA was quantified spectrophotometrically.
Polymerase chain reaction (PCR) was performed using UTSP as described by Ribeiro et al. (2013). This ge-notyping system was originally proposed by Oetting et al. (1995), which used a fluorescently labeled primer to an-neal with a specific primer used to amplify the target frag-ments in PCR, labelling indirectly the amplified fragment. The UTSP system was composed of three primers: the sense microsatellite primer with 17 extra base pairs (bp) tail in the 5’ end, these additional sequences are identical to the universal primers T3 (ATTAACCCTCACTAAAG), T7 (AATACGACTCACTATAG) or M13 (GTAAAACGACG-GCCAGT); the respective antisense microsatellite primer, and the universal primer with the same sequences of the sense primer tails, which can be T3, T7 or M13 labeled with each of the fluorochromes HEX, NED or 6-FAM, re-spectively. The amplification reaction (20 µL) contained DNA (30 ng), 1X PCR buffer (10 mM Tris-HCl, pH 8.8, 50 mM KCl, 0.08 % Nonidet P40), 1.5 mM MgCl2, 0.25 mM dNTP, 0.025 µM of sense primer, 0.125 µM of antisense primer, 0.125 µM of labeled universal primer and 1.0 U of Taq DNA polymerase. Conventional amplification reac-tions were performed using the same condireac-tions applied to the UTSP, except for the primers, which were at 0.125 µM for the regular sense and antisense SSR primers. The PCR for each microsatellite locus was performed sepa-rately and mixed before loading in the sequencer.
The amplification program consisted of an initial denaturation step of 94 °C for 4 min, followed by 8 cycles of denaturation at 94 °C for 40 s, annealing at 68 °C for 40 s and extension at 72 °C for 40 s, and 25 cycles of dena-turation at 94 °C for 40 s, annealing at 60 °C for 40 s and extension at 72 °C for 40 s. The final extension step was set to 72 °C for 20 min. A volume of 1.0 µL of each PCR amplification product was mixed with 8.75 µL of Hi-Di formamide and 0.25 µL of molecular size standard GeneS-can 500 ROX (ThermoFisher Scientific Inc.). The samples were denatured for 3 min at 95 °C and maintained on ice until loading into the ABI 3100XL sequencer using POP4 polymer (ThermoFisher Scientific Inc.). The data were au-tomatically collected and coded with the GeneMapper 3.5 software (ThermoFisher Scientific Inc.).
Out of 100 primers previously tested in a larger number of lines, we selected a set of 20 SSR loci well dis-tributed along the maize genome and showing high poly-morphic information content (PIC) values among the 48 maize single-cross hybrids. The sequences of all selected SSR primers and the respective universal primer associ-ated with the fluorescence are shown in Table 1.
Data analysis
Each microsatellite allele was considered as a domi-nant marker, which was coded as 1 (presence) or 0 (ab-sence). The PIC was calculated according to the expression:
2
1
1
n
ij j
PIC P
=
= −
∑
,where 2 ij
P is the frequency of the jth allele of the ith marker.
Table 1 – SSR markers, sense and antisense primer sequences, and their respective universal primer and fluorescence.
Marker Tail sequence* Sense primer (5’ → 3’) Antisense primer (5’ → 3’) Universal primer /Fluorescence
bnlg182 GTAAAACGACGGCCAGTAGACCATATTCCAGGCTTTACAG ACAACTAGCAGCAGCACAAGG M13/6FAM
bnlg2241 GTAAAACGACGGCCAGTTGCACACTCTCTTGCATCG TAGTCAGCATCTGCCGTGTC M13/6FAM
bnlg589 GTAAAACGACGGCCAGTGGGTCGTTTAGGGAGGCACCTTTGGT GCGACAGACAGACAGACAAGCGCATTGT M13/6FAM
phi116 GTAAAACGACGGCCAGTGCATACGGCCATGGATGGGA TCCCTGCCGGGACTCCTG M13/6FAM
umc1016 GTAAAACGACGGCCAGTGTGATACCGGGTAATCTGGTGC GATGATGGGTGATCATCGGTTC M13/6FAM
umc1033 GTAAAACGACGGCCAGTCTTCTTCGTAAAGGCATTTTGTGC GTGCGGGATTCCTTAGTTTGC M13/6FAM
umc1862 GTAAAACGACGGCCAGTATGGGCACATGAAAAAGAGACATT CCCATGAGAAGAGTGAAGACAACA M13/6FAM
bnlg1006 ATTAACCCTCACTAAAGGACCAGCGTGTTGATCCC GGAGACCCCGACTCTCTCTC T3/HEX
bnlg125 ATTAACCCTCACTAAAGGGGACAAAAGAAGAAGCAGAG GAAATGGGACAGAGACAGACAAT T3/HEX
bnlg161 ATTAACCCTCACTAAAGGCTTTCGTCATACACACACATTCA ATGGAGCATGAGCTTGCATATTT T3/HEX
bnlg1863 ATTAACCCTCACTAAAGGGCGTTCGTTTTGCACTAAT CGACACAGTTGACATCAGGG T3/HEX
umc1008 ATTAACCCTCACTAAAGTCTAGCTTGTGGTGGTGGTTGA ACATGAGCACAAAGACTGACGC T3/HEX
umc1653 ATTAACCCTCACTAAAGGAGACATGGCAGACTCACTGACA GCCGCCCACGTACATCTATC T3/HEX
bnlg1338 AATACGACTCACTATAGGTGCAGAATGCAGGCAATAG GCAAATGTTTTCACACACACG T7/NED
dupssr14 AATACGACTCACTATAGAGCAGGTACCACAATGGAG GTGTACATCAAGGTCCAGATTT T7/NED
dupssr24 AATACGACTCACTATAGACTGCACTGCACCTCTCTC ACACAACGGCTTCTAACCTT T7/NED
phi053 AATACGACTCACTATAGCTGCCTCTCAGATTCAGAGATTGAC AACCCAACGTACTCCGGCAG T7/NED
phi084 AATACGACTCACTATAGAGAAGGAATCCGATCCATCCAAGC CACCCGTACTTGAGGAAAACCC T7/NED
umc1019 AATACGACTCACTATAGCCAGCCATGTCTTCTCGTTCTT AAACAAAGCACCATCAATTCGG T7/NED
A genetic dissimilarity matrix was calculated as proposed by Nei and Li (1979) using the software Genes version 2009.7.0. A classical multidimensional scaling (MDS) analysis was performed based on the dissimilar-ity matrix using the cmdscale function available in the R package (R-project, 2015), and a biplot for the first two coordinates was generated.
The probability of random identity (PRI) for all SSR markers was calculated as follows:
1 n
i i
PRI P
=
=
∏
where Pi is the frequency of allele i and n is the number of evaluated markers.
Based on the PRI values, the percentage of exclud-ing power (EP) was calculated as follows: EP = (1 – PRI) × 100, which indicates the power to unambiguously identify a given hybrid among all hybrids in the set, us-ing the 20 SSR markers described in this study.
Results and Discussion
Standardization of the universal tail sequence primer method
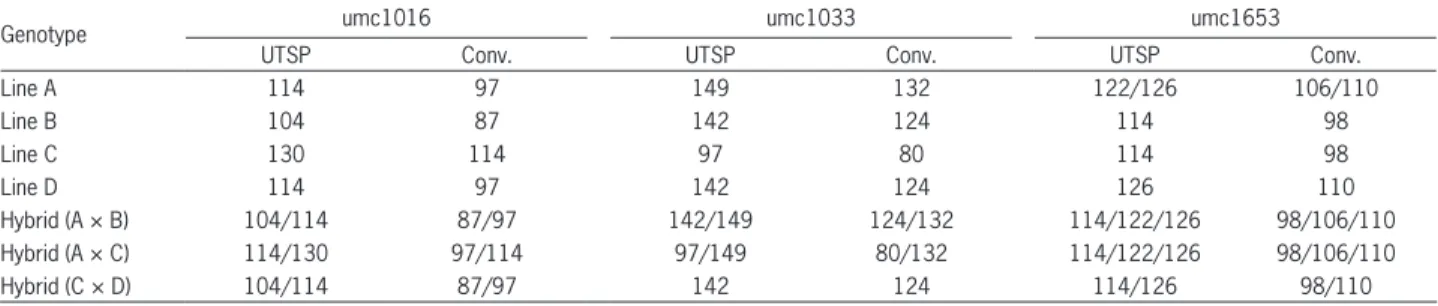
The alleles amplified using the UTSP method exhib-ited a difference of 17 bp, corresponding to the extended tail, in comparison with the amplified product using the conventional SSR primers. For example, in the parental line A, marker umc1016 amplified 114 and 97 bp-alleles by the UTSP and conventional SSR primers, respective-ly (Table 2). However, the alleles amplified with primer umc1653 presented a difference of 16 bp instead of the expected 17 bp (Table 2). Despite the high accuracy of the capillary electrophoresis system, small variations of up to two bp in the allele sizes can be expected. The alleles am-plified in the parental lines were also confirmed in their respective single-cross hybrids, using both UTSP and conventional methods (Table 2). Additionally, the UTSP method showed less amplification artifacts than the con-ventional SSR primers. Similar results were also obtained using 13 SSR based on UTSP to evaluate the genetic diver-sity of 30 soybean cultivars (Ribeiro et al., 2013).
Although maize is a diploid (2n = 2x = 20) species, up to four alleles per locus could be observed in a
single-cross hybrid, due to the residual heterozygosity in both parental inbred lines. In fact, two alleles were amplified in parental line A for umc1653, and were confirmed by both genotyping methods (Table 2). According to Liu et al. (2003), approximately 4 % of the 33,900 SSR geno-types generated more than one amplified band per maize inbred line, which could be due to residual heterozy-gosity, contamination, or the amplification of similar sequences in two different genomic regions. The minor allele frequency expected in a maize single-cross hybrid per locus would be 0.25, considering that both parental inbred lines are heterozygous for two different alleles each. As the probability of an allele being absent in a random sample is (1 - fi)n, where f
iis the allele frequency and n the bulk size, sampling 20 individuals corresponds to 0.32 % probability of not detecting an allele present at a frequency of 0.25 in the hybrid. Thus, it is highly recommended to use a representative bulk of individu-als in order to ensure the sampling reliability required for DUS tests.
Characterization of the SSR marker set
Twenty microsatellites selected based on PIC val-ues and genome distribution were converted to the UTSP system to genotype 48 commercial maize hybrids regis-tered in Brazil. A high level of polymorphism was found for the 20 SSR loci, with an average of 9.8 alleles per locus, ranging from four alleles for phi116 and umc1862 to 19 for umc1016. The PIC value ranged from 0.59 for umc1862 to 0.97 for bnlg1006, with an average of 0.84 (Table 3), which were relatively high compared with SSR markers described for apple cultivars (0.72, Galli et al., 2005), rice hybrids (0.35, Hashemi et al., 2009) and com-mercial maize hybrids (0.51, Daniel et al., 2012). These high values compared to other studies can be partially explained by the previous selection of the SSR markers based on their PIC value, but may also reflect the large genetic variability of maize cultivars in the Brazilian market. Garcia et al. (2004) genotyped a set of 18 tropi-cal maize inbred lines with different molecular markers, including SSRs, which presented a mean PIC value of 0.89. Besides the selection of highly informative SSRs, the tropical maize lines evaluated in this study also pres-ent wide genetic variability.
Table 2 – Estimated size in base pairs of the amplified fragments of three hybrids and their parents for SSRs umc1016, umc1033 and umc1653 using the universal tail sequence primers (UTSP) and the conventional fluorescently labeled primers (Conv.) in capillary electrophoresis.
Genotype umc1016 umc1033 umc1653
UTSP Conv. UTSP Conv. UTSP Conv.
Line A 114 97 149 132 122/126 106/110
Line B 104 87 142 124 114 98
Line C 130 114 97 80 114 98
Line D 114 97 142 124 126 110
Hybrid (A × B) 104/114 87/97 142/149 124/132 114/122/126 98/106/110
Hybrid (A × C) 114/130 97/114 97/149 80/132 114/122/126 98/106/110
The genotyping system using 20 conventional SSR loci would require 20 fluorescently labeled prim-ers and 20 regular primprim-ers, whereas under the pro-posed UTSP method, only three fluorescently labeled primers and 40 regular primers are needed. As fluo-rescently labeled primers are approximately 10 times more expensive than regular ones, using the proposed set of primers under the UTSP method reduces the to-tal primer cost approximately by half. In addition, the three fluorescently labeled primers under the UTSP method can be used with different sets of primers even for unrelated species due to the non-specificity of their sequences, which reduces even more the ge-notyping costs.
Molecular identity test
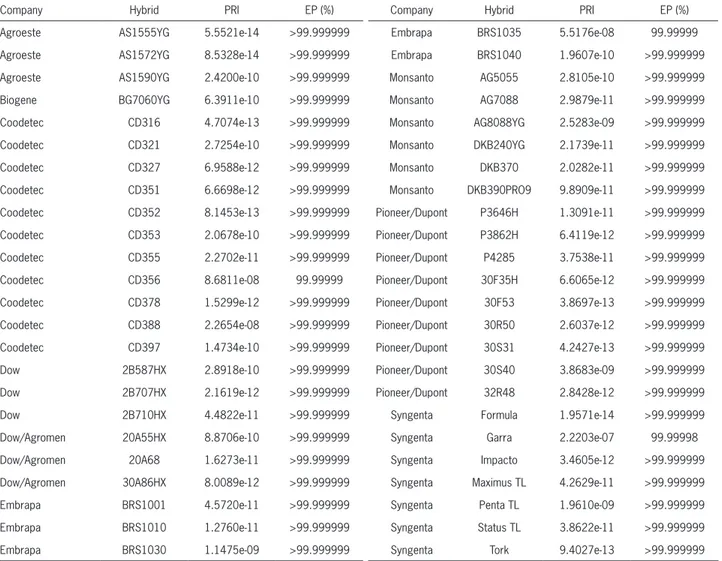
The set of 20 SSR markers generated a unique allelic combination for each single-cross hybrid evalu-ated, with the probability of random identity values ranging from 10−14, for hybrids AS1555YG, AS1572YG
and Formula, to 10−7 for hybrid Garra (Table 4).
These values generated a minimum exclusion power of 99.99998 % (Table 4). Six SSR markers generated an overall exclusion power greater than 99.99 % in a group of 192 eucalyptus trees (Kirst et al., 2005), whereas 13 SSR markers conferred more than 99.9999 % of exclusion power to distinguish 32 soybean
cul-tivars (Oliveira et al., 2010). Thus, this set of 20 SSR markers confers a high distinctiveness capacity and could be recommended as a molecular descriptor for maize cultivar registration purposes.
Genetic diversity
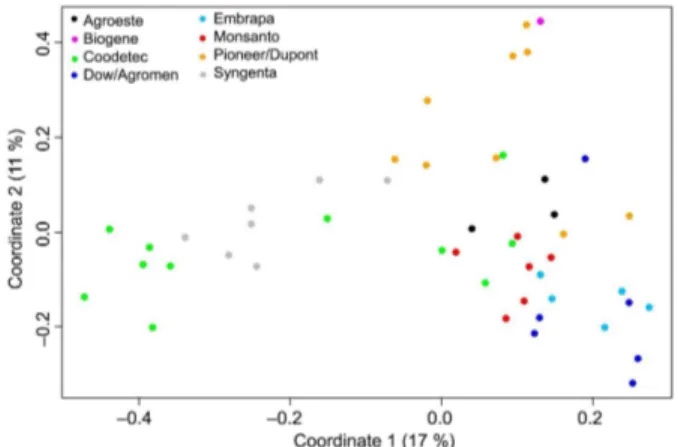
A classical MDS biplot was constructed to repre-sent the genetic relationship of the 48 maize commer-cial hybrids (Figure 1). Single-cross hybrids from the same company tended to group together, as expected, whereas other genotypes showed a wider dispersion, such as the hybrids from Coodetec along the first coor-dinate, and the hybrids from Pioneer along the second coordinate. Coordinates 1 and 2 explained 17 % and 11 % of the total variance, respectively. For a better rep-resentation of the genetic relationship among hybrids, a higher number of dimensions (coordinates) would be required to increase the percentage of variance ex-plained in the MDS analysis. Moreover, the different number of genotypes sampled for each seed company impairs a precise inference about the genetic diversity of the commercial hybrids. Despite these limitations, the current MDS analysis was able to represent the genetic diversity of the 48 Brazilian commercial maize hybrids.
Conclusion
The set of 20 SSR markers based on the UTSP method was efficient and cost-effective for molecular fingerprinting of single-cross maize hybrids. The pro-posed method reduces both the genotyping costs and time when compared to the conventional SSR marker, and presents a great power of distinctiveness. Thus, this genotyping system can be applied to genetic pu-rity testing and as a molecular descriptor for maize cultivar registration.
Figure 1 – Classical multidimensional scaling (MDS) biplot constructed based on 20 SSR markers obtained via the universal tail sequence primers (UTSP) method for 48 maize commercial hybrids. The percentage of variance explained by each coordinate is indicated within brackets.
Table 3 – Chromosome position in bin, repeat sequence motif, allelic range in base pairs (bp), number of alleles and polymorphic information content (PIC) for the 20 SSR markers based on the universal tail sequence primers (UTSP) method in 48 Brazilian commercial maize hybrids.
SSR Bin Motif Allelic range (bp)*
Number of alleles PIC
bnlg1006 5.00 AG 164-291 12 0.97
bnlg125 2.02 AG 313-422 7 0.84
bnlg1338 2.01 AG 166-280 8 0.82
bnlg161 6.00 AG 118-223 11 0.87
bnlg182 1.03 AG 83-401 13 0.87
bnlg1863 8.03 AG 114-182 11 0.87
bnlg2241 3.06 AG 188-244 6 0.77
bnlg589 4.10 AG 134-212 6 0.95
dupssr14 8.09 CT/CA 65-132 8 0.84
dupssr24 2.08 GA 75-147 11 0.90
phi053 3.05 ATAC 161-192 6 0.74
phi084 10.04 GAA 88-160 9 0.84
phi116 7.06 ACTG/ACG 136-170 4 0.74
umc1008 4.01 GT/GA 152-175 8 0.81
umc1016 7.02 CT 68-233 19 0.92
umc1019 5.06 CT 53-105 18 0.92
umc1033 9.02 GA 71-189 16 0.92
umc1084 10.07 CT 69-163 9 0.77
umc1653 6.07 GAAA 87-237 10 0.87
umc1862 1.11 GA 121-150 4 0.59
Mean 9.8 0.84
Table 4 – Probability of random identity (PRI) and the percentage of exclusion power (EP) of the 20 SSR markers for each of the 48 Brazilian commercial maize hybrids.
Company Hybrid PRI EP (%) Company Hybrid PRI EP (%)
Agroeste AS1555YG 5.5521e-14 >99.999999 Embrapa BRS1035 5.5176e-08 99.99999
Agroeste AS1572YG 8.5328e-14 >99.999999 Embrapa BRS1040 1.9607e-10 >99.999999
Agroeste AS1590YG 2.4200e-10 >99.999999 Monsanto AG5055 2.8105e-10 >99.999999
Biogene BG7060YG 6.3911e-10 >99.999999 Monsanto AG7088 2.9879e-11 >99.999999
Coodetec CD316 4.7074e-13 >99.999999 Monsanto AG8088YG 2.5283e-09 >99.999999
Coodetec CD321 2.7254e-10 >99.999999 Monsanto DKB240YG 2.1739e-11 >99.999999
Coodetec CD327 6.9588e-12 >99.999999 Monsanto DKB370 2.0282e-11 >99.999999
Coodetec CD351 6.6698e-12 >99.999999 Monsanto DKB390PRO9 9.8909e-11 >99.999999
Coodetec CD352 8.1453e-13 >99.999999 Pioneer/Dupont P3646H 1.3091e-11 >99.999999
Coodetec CD353 2.0678e-10 >99.999999 Pioneer/Dupont P3862H 6.4119e-12 >99.999999
Coodetec CD355 2.2702e-11 >99.999999 Pioneer/Dupont P4285 3.7538e-11 >99.999999
Coodetec CD356 8.6811e-08 99.99999 Pioneer/Dupont 30F35H 6.6065e-12 >99.999999
Coodetec CD378 1.5299e-12 >99.999999 Pioneer/Dupont 30F53 3.8697e-13 >99.999999
Coodetec CD388 2.2654e-08 >99.999999 Pioneer/Dupont 30R50 2.6037e-12 >99.999999
Coodetec CD397 1.4734e-10 >99.999999 Pioneer/Dupont 30S31 4.2427e-13 >99.999999
Dow 2B587HX 2.8918e-10 >99.999999 Pioneer/Dupont 30S40 3.8683e-09 >99.999999
Dow 2B707HX 2.1619e-12 >99.999999 Pioneer/Dupont 32R48 2.8428e-12 >99.999999
Dow 2B710HX 4.4822e-11 >99.999999 Syngenta Formula 1.9571e-14 >99.999999
Dow/Agromen 20A55HX 8.8706e-10 >99.999999 Syngenta Garra 2.2203e-07 99.99998
Dow/Agromen 20A68 1.6273e-11 >99.999999 Syngenta Impacto 3.4605e-12 >99.999999
Dow/Agromen 30A86HX 8.0089e-12 >99.999999 Syngenta Maximus TL 4.2629e-11 >99.999999
Embrapa BRS1001 4.5720e-11 >99.999999 Syngenta Penta TL 1.9610e-09 >99.999999
Embrapa BRS1010 1.2760e-11 >99.999999 Syngenta Status TL 3.8622e-11 >99.999999
Embrapa BRS1030 1.1475e-09 >99.999999 Syngenta Tork 9.4027e-13 >99.999999
Acknowledgements
The authors are thankful to the Brazilian National Council for Scientific and Technological Development (CNPq) and the Brazilian Agency of Innovation (Finep) for their financial support, to the AgroGenética compa-ny and the Brazilian Agricultural Research Corporation (Embrapa) for their logistical support.
References
Arruda, M.P.; Goncalves, E.C.; Schneider, M.P.C.; Silva, A.L.D.; Morielle-Versute, E. 2010. An alternative genotyping method using dye-labeled universal primer to reduce unspecific amplifications. Molecular Biology Reports 37: 2031-2036. Associação Paulista dos Produtores de Sementes e Mudas [APPS].
2015. Statistical Survey of Maize Seed Market = Levantamento Estatístico do Mercado de Sementes de Milho. Atualizado até 1º Levantamento Verão 2015. Available at: apps.agropecuaria. ws/site/Relatorio/30 [Accessed Aug 20, 2015] (in Portuguese).
Cryer, N.C.; Butler, D.R.; Wilkinson, M.J. 2005. High throughput, high resolution selection of polymorphic microsatellite loci for multiplex analysis. Plant Methods 1: 3.
Daniel, I.O.; Adetumbi, J.A.; Oyelakin, O.O.; Olakojo, S.A.; Ajala, M.O.; Onagbesan, S.O. 2012. Application of SSR markers for genetic purity analysis of parental inbred lines and some commercial hybrid maize (Zea mays L.). American Journal of Experimental Agriculture 2: 597-606.
Diniz, F.M.; Iyengar, A.; Lima, P.S.D.; MacLean, N.; Bentzen, P. 2007. Application of a double-enrichment procedure for microsatellite isolation and the use of tailed primers for high throughput genotyping. Genetics and Molecular Biology 30: 380-384.
Galli, Z.; Halasz, G.; Kiss, E.; Heszky, L.; Dobranszki, J. 2005. Molecular identification of commercial apple cultivars with microsatellite markers. Hortscience 40: 1974-1977.
Hashemi, S.H.; Mirmohammadi-Maibody, S.A.M.; Nematzadeh, G.A.; Arzani, A. 2009. Identification of rice hybrids using microsatellite and RAPD markers. African Journal of Biotechnology 8: 2094-2101.
Hayden, M.J.; Nguyen, T.M.; Waterman, A.; Chalmers, K.J. 2008. Multiplex-ready PCR: a new method for multiplexed SSR and SNP genotyping. BMC Genomics 9: 80.
Jesus, O.N.; Ferreira, C.F.; Silva, S.D.E.; Camara, T.R.; Soares, T.L.; Pestana, K.N. 2009. Characterization of recommended banana cultivars using morphological and molecular descriptors. Crop Breeding and Applied Biotechnology 9: 164-173.
Kirst, M.; Cordeiro, C.M.; Rezende, G.D.S.P.; Grattapaglia, D. 2005. Power of microsatellite markers for fingerprinting and parentage analysis in Eucalyptus grandis breeding populations. Journal of Heredity 96: 161-166.
Liu, K.; Goodman, M.; Muse, S.; Smith, J.S.; Buckler, E.; Doebley, J. 2003. Genetic structure and diversity among maize inbred lines as inferred from DNA microsatellites. Genetics 165: 2117-2128.
Ministério da Agricultura, Pecuária e Abastecimento [MAPA]. 2015. National Service of Cultivar Protection = Serviço Nacional de Proteção de Cultivar. Available at: http://www. agricultura.gov.br [Accessed Jan 7, 2015] (in Portuguese). Missiaggia, A.; Grattapaglia, D. 2006. Plant microsatellite
genotyping with 4-color fluorescent detection using multiple-tailed primers. Genetics and Molecular Research 5: 72-78. Nei, M.; Li, W.H. 1979. Mathematical model for studying genetic
variation in terms of restriction endonucleases. Proceedings of the National Academy of Sciences 76: 5269-5273.
Oetting, W.S.; Lee, H.K.; Flanders, D.J.; Wiesner, G.L.; Sellers, T.A.; King, R.A. 1995. Linkage analysis with multiplexed short tandem repeat polymorphisms using infrared fluorescence and M13 tailed primers. Genomics 30: 450-458.
Oliveira, M.B.; Vieira, E.S.N.; Schuster, I. 2010. Construction of a molecular database for soybean cultivar identification in Brazil. Genetics and Molecular Research 9: 705-720.
Priolli, R.H.G.; Mendes-Junior, C.T.; Arantes, N.E.; Contel, E.P.B. 2002. Characterization of Brazilian soybean cultivars using microsatellite markers. Genetics and Molecular Biology 25: 185-193.
Ribeiro, C.A.G.; Tanure, J.P.M.; Maciel, T.E.F.; Barros, E.G. 2013. Molecular characterization of soybean cultivars by microsatellite markers with universal tail sequence. Pesquisa Agropecuária Brasileira 48: 270-279.
Rodrigues, D.H.; Neto, F.D.; Schuster, I. 2008. Identification of essentially derived soybean cultivars using microsatellite markers. Crop Breeding and Applied Biotechnology 8: 74-78. Saghai-Maroof, M.A.; Soliman, K.M.; Jorgensen, R.A.; Allard,
R.W. 1984. Ribosomal DNA spacer-length polymorphisms in barley: mendelian inheritance, chromosomal location, and population dynamics. Proceedings of the National Academy of Sciences 81: 8014-8018.