R. Bras. Zootec., v.41, n.4, p.1009-1015, 2012
ISSN 1806-9290 www.sbz.org.br
Received March 11, 2011 and accepted November 23, 2011. Corresponding author: julimarzoo@hotmail.com
Reactivity, performance, color and tenderness of meat from Zebu cattle
finished in feedlot
1Julimar do Sacramento Ribeiro2, Tarcisio de Moraes Gonçalves3, Márcio Machado Ladeira3, Rymer Ramiz Tullio4, Fabrício Rodrigues Campos3, José Aurélio Garcia Bergmann5,
Otávio Rodrigues Machado Neto3, José Rodolfo Reis de Carvalho3
1Research financed by FAPEMIG. 2Universidade Federal de Alagoas - UFAL. 3Universidade Federal de Lavras - UFLA. 4EMBRAPA Pecuária Sudeste.
5Universidade Federal de Minas Gerais - UFMG.
ABSTRACT -The objective of this study was to study the animal reactivity and correlate it with performance and meat quality of cattle finished in feedlots. A total of 20 animals of the Tabapuã breed and 20 animals of the Nellore breed were confined for 112 days: 28 days of adaptation and 84 days of data collection. Performance was determined by the average daily weight gain (ADG) and average dry matter intake (DMI) estimated through the use of indicators. On the 1st, 42nd and 84th
days of the experiment, two methods were used to measure the animal reactivity: animal reactivity in mobile cage and visual reactivity during handling. The characteristics of meat quality were evaluated by the color, shear forceand pH24after slaughter (pH24). Through the study of correlation, the degree and direction of linear association on animal reactivity, performance and meat quality were established. Regression equations were generated for the parameters evaluated according to the values of animal reactivity. Correlations between mobile cage and visual reactivity were 0.77, 0.56 and 0.45 in the 1st, 2nd and 3rd evaluations, respectively. There was no correlation between animal reactivity and DMI. The correlations between ADG, pH24, and color with animal reactivity were -0.31, 0.40, 0.47 and -0.34, and -0.33 for mobile cage, 0.74, 0.71 and -0.51, for visual reactivity, respectively. The parameters of meat quality varied according to the reactivity. Undesirable values of pH24, animal reactivity and color were found when mobile cage reactivity was higher than 780, 590 and 540, respectively. In general, animals that show greater reactivity tend to have lower daily weight gain and lower meat quality. The reactivity can be used in animal breeding programs, in order to improve performance and meat quality of Zebu cattle finished in feedlot.
Key Words: bovine, meat quality, temperament
Introduction
Cattle subjected to sudden change of environment encounter a situation different from that to which they were adapted, requiring new social organization, and certainly changing their well-being. This fact is common in confinement, especially when the grouping of animals of different properties for the formation of lots occurs.
Overall, the temperament is defined as the reaction of the nervous system, which is determined by genetic and environmental factors (Lanier et al., 2001). The animal reactivity has been proposed as objective measurement of temperament, which may be related to feed efficiency, performance and meat quality (Curley et al., 2004; Lancaster et al., 2005). Due to its importance, the evaluation of animal reactivity should be done effectively, applying safe methods, efficient in determination and applicability within the production system (Paranhos da Costa, 2007).
The current scenario of the beef industry shows the need for a quality product that meets the consumers demand. The customer requirements are linked to meat characteristics that influence the buying decision. In a preference order, the purchase decision is influenced by color, tenderness, flavor and juiciness.
between animal reactivity, performance and meat quality of Zebu animals is not well understood.
This study was conducted to understand the temperament of animal (bovine reactivity) and its association with performance, feed efficiency and meat quality of Zebu animals finished in feedlot.
Material and Methods
A total of 40 Zebu steers, 20 from the Nellore breed and 20 from the Tabapuã breed, with average initial age of 18 months and initial weight of 350 kg were used. The animals were housed in collective stalls with an area of 30 m2 per animal, with 10 Nellore steers and 10 Tabapuã steers allocated in each stall. The feedlot facilities had a compacted earth floor and slope of approximately 8%, concrete area feeding trough, and were divided by smooth wire fences. The collective drinkers were located at the division of two stalls. Vinilona feeding troughs were place transversely at the upper part of the stall with 70 cm linear for each animal.
At the beginning of the adaptation period, the animals were weighed after fasting for 16 hours and treated against ecto and endoparasites. During the adaptation period, lasting 28 days, they were fed without restriction with the same diet of the experimental period.
The diet (Table 1) was formulated according to the NRC (2000) and supplied without restriction to the animals at 8:00 am and 3:00 pm, and the feed leftovers were collected the following morning. The quantity of diet supplied was adjusted each day to allow 5% of leftovers.
The experimental period, after the adaptation period, was divided into two phases of 42 days: from 1 to 42 days (Phase 1) and from 42 to 84 days (Phase 2). At each phase of evaluation, the dry matter intake and daily weight gain were obtained, and these values were used to study the correlation.
At every 14 days, the dry matter intake (DMI) was estimated through the use of indicators (chromic oxide and LIPE®), according to the methodology of Saliba (2005) and Valadares Filho et al. (2006) . The weighing of the animals was realized at the end of each period after fasting for 16 hours.
For the study of animal reactivity each animal was measured on the 1st, 42nd and 84th days of the experimental period, through the method of animal reactivity in mobile cage. For the measurement of the mobile cage reactivity, an electronic device that quantifies the frequency and intensity of movement of the animal was coupled to it and the assessments were made according to the methodology described by Maffei et al. (2006).
After the evaluation of the mobile cage reactivity, the animals were led to a paddock for the determination of animal visual reactivity, where a team of three evaluators ranked the animal temperament through a behavior scale adapted by Piovezan (1998) and Petherick et al. (2002), according to the following criteria:
- Score 1 (very docile): docile animal. Shows no aggression, walks slowly, allows the appraiser to approach slowly, no change in behavior due to plant or human presence.
- Score 2 (docile): slightly restless animal. Shows no aggression or sudden movements, moves quickly along the fence, but when the appraiser is away, it stays far away, watching the environment.
- Score 3 (mildly agitated): moderately aggressive animal. Runs over fences, is astonished by the approach of the observer and stops before colliding with the fence and gates;
- Score 4 (agitated): aggressive animal. The head remains high, very attentive to the environment, sudden movements or gets ready to attack if the observer approaches; trying to escape, collides with fences and gates.
- Score 5 (aggressive): very agitated and aggressive animal. Presents sharp and agile movements, is uncomfortable with the stable environment and human presence, gets ready to attack the evaluator, bumps against fences and jumps gates.
Because of the tendency of the observers to not separate animals classified as score 3 from those with scores 2 or 4, score 3 was omitted; thus, to improve the visual assessment of reactivity, only the scores 1, 2, 4 and 5 were used, as done by Carneiro et al. (2006).
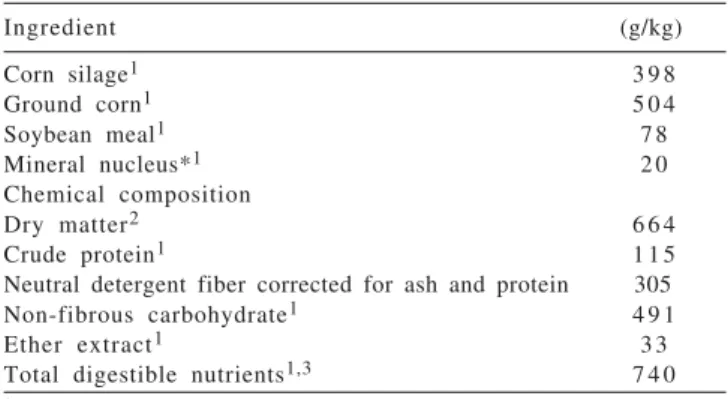
Table 1 - Composition of experimental diet supplied to Zebu cattle (Nellore and Tabapuã) finished in feedlot
Ingredient (g/kg)
Corn silage1 3 9 8
Ground corn1 5 0 4
Soybean meal1 7 8
Mineral nucleus*1 2 0
Chemical composition
Dry matter2 6 6 4
Crude protein1 1 1 5
Neutral detergent fiber corrected for ash and protein 305
Non-fibrous carbohydrate1 4 9 1
Ether extract1 3 3
Total digestible nutrients1,3 7 4 0
1 g/kg of dry matter. 2g/kg of natural matter.
3Calculated according to the NRC (2000).
All evaluations were realized by the same evaluators. The visual reactivity of the animal in each evaluation period was obtained by the average of the three evaluators.
After evaluation of reactivity (84 days) at 10:00 am, the animals boarded livestock truck with capacity of 22 animals each and were sent to commercial meat-packing, covering a distance of 60 km. During the pre-slaughter, the animals were fasted for solid diet and water for 24 hours in stalls without coverage, with the use of aspersion, for greater thermal comfort.
The slaughter was carried out as recommended by the RIISPOA (Brazil, 1997) in industrial meat-packing under Federal Inspection (SIF). After slaughter, the pH was measured (pH0) in the region of the longissimus dorsi
muscle between the 9th and 11th ribs of the left carcass. The pH0 was determined using a Mettler M1120x portable digital potentiometer (Mettler-Toledo International, Columbus, USA). The carcasses were identified, washed, divided into halves and put into cold storage for a period of 24 hours at a temperature of 1 °C.
After carcass cooling, the reading of the pH (pH24) was performed and samples were taken from the longissimus
dorsi between the 9th and 11th ribs of the left half carcass,
then packed and frozen for subsequent laboratory analysis. Analyses of meat quality: pH, color (CIELAB), shear force, loss of weight by cooking and water holding capacity were conducted at Embrapa Pecuária Sudeste laboratory in São Carlos, SP, according to methods described by Fernandes et al. (2008).
Cross-sectional samples of the longissimus dorsi were
made, for exposure of myoglobin to oxygen for 30 minutes (Abularach et al., 1998) and later, six readings of the color components of the meat through Minolta Chroma Meter portable colorimeter, model CR 300 were performed, and the average of six readings was calculated. According to the system CIE-L * a * b *, luminosity (L *), red index (a *) and yellow index (b *) were evaluated. For analysis of tenderness, samples of the longissimus dorsi of 2.54 cm thickness were
roasted in gas oven at 180 °C temperature, until reaching 70 °C in the center of the sample. The steaks were cooled to room temperature. After cooling, ten cylinders were removed from 2 cm in diameter, cut parallel to the fiber with the aid of a cutter. The forcerequired for the complete shearing of each cylinder was determined using a Texture Analyzer TA-texturometer XT2i, attached to Warner Bratzler - SMS blade. The average cutting force of the cylinder, expressed in kilograms force (kgf) was used to represent the shearforceof each steak.
The experimental design was completely randomized with two treatments (breed) and 20 repetitions; each animal was considered a repetition, in a total of 40 experimental
units. The model used was: in which:Yij = value of the dependent variables, µ = overall
mean; Ti = effect of the breed; εij = experimental residual
error. The data were subjected to analysis of variance and to the F test (α = 0.05) using the GLM procedure of the SAS
(Statistical Analysis Systems, version 8.0).
The adjustment to normal distribution for the data on visual animal reactivity was evaluated using the PROC UNIVARIATE NORMAL (Statistical Analysis Systems, version 8.0), the latter having made such distribution. Regression analysis and correlation between the reactivity and animal daily weight gain, pH after 24 hours, shear force and color were carried out, and significance was evaluated by the t test (α= 0.05). The procedures for analysis of
correlation and regression were realized using the PROC CORR and PROC REG of the SAS (Statistical Analysis Systems, version 8.0).
Results and Discussion
The variability of those characteristics was not influenced by breed (P>0.05), so the values correspond to data obtained from all animals. The values of DMI and ADG, and therefore feed efficiency (FE) are close to the values of 9.0 kg/day for DMI and 1.40 kg/day for ADG found in the NRC (2000) for Zebu animals in termination (Table 2), indicating that the diet was not a limiting factor to performance.
Table 2 - Adjusted means, minimum and maximum values, coefficient of variation (CV) and standard error of the mean (SEM) of different characteristics evaluated in Zebu cattle (Nellore and Tabapuã) finished in feedlot
Item Mean Least Highest CV SEM
DMI (kg/day) 9.65 8.83 10.48 4.44 0.07
ADG (kg/day) 1.26 0.84 1.72 19.56 0.04
FE (kg/kg) 0.13 0.09 0.17 18.51 0.003
MC0 1 0 7 7 2 4 1 4 0 6 4 88.52 154.72
MC1 5 6 2 2 6 1 1 2 4 4 47.23 43.06
MC2 4 3 8 2 7 0 8 4 5 38.92 27.30
VR0 2 . 5 1 4 44.37 0.17
VR1 2 . 5 1 5 48.40 0.19
VR2 2 . 4 1 4 40.91 0.15
p H 0 6.97 6.18 7.29 3.04 0.03
pH24 5.63 5.25 6.10 3.86 0.03
SF (kgf) 4.28 2.50 6.10 20.41 0.14
L* 38.50 33.40 44.73 8.26 0.50
a* 15.03 12.15 17.08 6.08 0.15
b* 13.45 8.84 15.75 10.73 0.23
There was a numerical decrease of 60% in mobile cage between the first and last measurements. The means of visual reactivity remained constant between the first and second measurement, a decrease of 4% from first to last evaluation, indicating a possible effect of the adaptability of the animal at management on the decrease in reactivity. The average age of slaughter around 21 months was possibly the main factor for the good quality meat observed in this experiment, since the average quality parameters are within the normal values recommended for beef (Shackelford et al. 1991; Muchenje et al., 2009).
There is a decrease in the correlation between the measured values of reactivity in different phases of measurement (Table 3).
The decrease in correlation values may indicate possible adaptation of animals to confinement and handling. Results with altered animal reactivity, as it extended the time of evaluation, were also reported by Hemsworth et al. (2000) and Aguilar et al. (2004).
The correlation between the methods was different, depending on the time of measurement. The drop in correlation coefficient between the two methods as they moved the evaluation period suggests a decrease of equivalence between the methods (Table 3). This may be related to the methodologies used, because the method of visual reactivity is subjective and has less capacity to detect changes in the temperament of the animal, which does not occur with the method of animal reactivity in mobile cage.
As the objective was to evaluate the difference in temperament between the animals, it is observed that the measurement made by the mobile cage enabled the detection of differences in animal behavior more clearly with the increase of assessments.
Analyzing the correlations between measures of reactivity and performance characteristics corresponding
to each phase of evaluation (Table 4), there are differences in these correlations. Only the measurements taken in the second phase had a negative correlation with the parameters analyzed.
In other study, in which reactivity was measured visually (Lancaster et al., 2005), correlation was observed between the reactivity and animal dry matter intake; however, this study found no correlation between measures of reactivity and DMI.
There was negative correlation between mobile cage and visual reactivity, with the ADG and FE, as the animal did not influence the reactivity DMI; it is believed that the drop in ADG is possibly linked to a higher demand in maintenance energy presented by the most reactive animals. This fact was related to the high metabolism and catabolism of the actions triggered by force factors (Munck, 1971; Voisinet et al., 1997; Sapolsky et al., 2000).
Only measures of reactivity (Table 4) measured in the last phase showed correlation with performance parameters, so according to the regression equation (Figure 1) for each increase of 0.1 points in the last phase, there is a reduction of five grams in the ADG of animals.
Despite the low value of r2 found for the equation, this
result indicates the possible negative influence of the higher reactivity on animal performance, which is consistent with the value of correlation between the last phase and ADG (Table 4).
Since only the measurements of animal reactivity in mobile cage and visual reactivity in 84 days correlated with performance parameters (Table 4), only these values were correlated with measures of meat quality (Table 5).
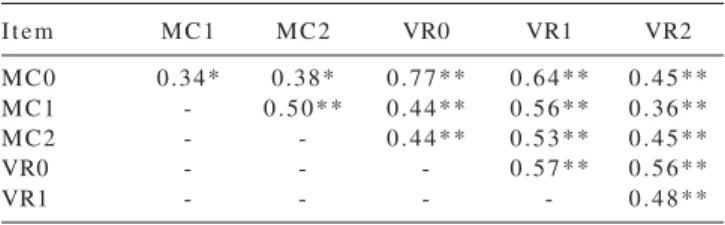
Table 3 - Correlation between the animal reactivity in mobile cage (MC) and visual reactivity (VR) and between the different phases of evaluation of the animal reactivity of Zebu cattle (Nellore and Tabapuã) finished in feedlot
Item MC1 MC2 VR0 VR1 VR2
MC0 0.34* 0.38* 0.77** 0.64** 0.45**
MC1 - 0.50** 0.44** 0.56** 0.36**
MC2 - - 0.44** 0.53** 0.45**
VR0 - - - 0.57** 0.56**
VR1 - - - - 0.48**
*Significant (P<0.05); **Significant (P<0.01). MC0 - animal reactivity in mobile cage on day 1; MC1 - animal reactivity in mobile cage in 42 days; MC2 - animal reactivity in mobile cage in 84 days; VR0 animal visual reactivity on day 1; VR1 -animal visual reactivity in 42 days; VR2 - -animal visual reactivity in 84 days.
Dashed line represents the ADG values generated by the equation: ADG = 1.4954 - 0.5461 (MC2), with r2 of 0.16.
Figure 1 - Functional relationship between animal reactivity in mobile cage, measured on the 84th day (MC2) and
average daily weight gain (ADG) of Zebu cattle (Nellore and Tabapuã) finished in feedlot.
0.7 0.9 1.1 1.3 1.5 1.7
0.25 0.35 0.45 0.55 0.65 0.75 0.85
A
verage
daily
gain
(kg/day)
.
The two measures of reactivity correlated with meat quality parameters (Table 5). The visual reactivity in 84 days showed the highest correlation; however, mobile cage reactivity allowed us to detect and evaluate the temperament of the animals in a more simple and objective way. In addition to not interfering in the management, the mobile cage reactivity leads to greater phenotypic variability due to its capacity to detect major changes in the reactivity of the animal. Therefore, this tool may be appropriate for evaluating animals. This evidence was also reported by Phocas et al. (2006) and Maffei (2009).
The positive correlation between measures of reactivity and pH24 (Table 5) suggests a greater expenditure of glycogen in more reactive animals, which would prevent an effective decrease in pH. For an ideal standard of quality to ocurr, there must be an effectively drop in pH in the meat, that is, it must fall to values around 7.0, immediately after slaughter to values around 5.5 to 5.6 at 24 hours post mortem (Stephens et al., 2006; Roça, 2009).
According Muchenje et al. (2009), although there is variation in the pH of beef from 5.4 to 6.7, the maximum acceptable value of pH24 for meat exports is 5.8. The occurrence of pH24 above the expected score is related to higher temperament. Nevertheless, on average, the animals
in this experiment had beef with the minimum quality requirement (Table 2).
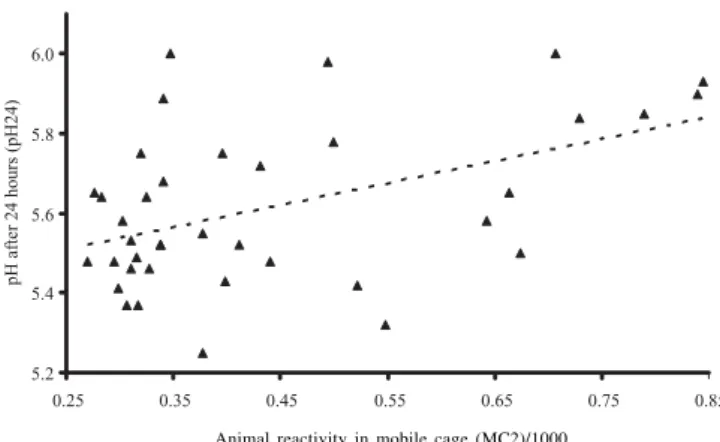
According to the regression equation (Figure 2), for each increase of 0.1 points in reactivity in mobile cage in 84 days, there is an increase of 0.06 points in the value of pH24. Taking into account the value of the correlation between reactivity and pH24 (Table 5) and the values observed in Figure 2, it is implied that animals intended for slaughter should present values of reactivity in mobile cage in 84 days less or equal to 780; however, due to the low r2 value found for the equation, it is recommended that further evaluation be carried out in order to confirm these results.
Although it is not the main objective of the study, but since the value of pH24 was correlated with the reactivity and it exerts great influence on meat quality parameters (MacDogaull, 1994, Watanabe et al., 1996), seeking to better understand the results, the correlation between pH24 and other determinants of meat quality was evaluated (Table 6). In this study, pH24 showed high positive correlation with shear force and a negative correlation with the parameters of color meat. The values of the parameters
Table 5 - Correlation between animal reactivity in mobile cage (MC) and visual reactivity (VR) with measures of meat quality in Zebu cattle (Nellore and Tabapuã) finished in feedlot
Item p H 0 pH24 SF L* a* b*
MC2 0.16 0.40** 0.47** -0.34* -0.23 -0.09
VR2 0.16 0.74** 0.71** -0.51** -0.22 -0.17
*Significant (P<0.05); **Significant (P<0.01). MC2 - animal reactivity in mobile cage in 84 days; VR2 - animal visual reactivity in 84 days; pH0 - pH immediately after slaughter; pH24 - pH 24 hours after slaughter; SF (kgf) - shear force expressed in kilogram force (kgf); L* - luminosity; a* - chromatic scale from green to red; b * - chromatic scale from blue to yellow.
Table 6 - Correlation between the pH measured 24 hours after slaughter (pH24) and other measures of quality of meat in Zebu cattle (Nellore and Tabapuã) finished in feedlot
Item SF L* a* b*
pH24 0.68** -0.66** -0.47** -0.30
**Significant (P<0.01). pH24 - pH 24 hours after slaughter; SF (kgf) - shear force expressed in kilogram force (kgf); L* - lightness; a* - chromatic scale from green to red; b * - chromatic scale from blue to yellow.
Table 4 - Correlation between animal reactivity in mobile cage (MC) and visual reactivity (VR) with measures of dry matter intake (DMI), daily weight gain (ADG) and feed efficiency (FE) in Zebu cattle (Nellore and Tabapuã) finished in feedlot
Item DMI ADG FE
MC1 -0.03 -0.26 -0.23
MC2 -0.05 -0.31* -0.32*
VR1 -0.17 -0.11 -0.11
VR2 -0.03 -0.33* -0.36*
*Significant (P<0.05). MC1 - animal reactivity in mobile cage in 42 days (first phase); MC2 animal reactivity in mobile cage in 84 days (second phase); VR1 -animal visual reactivity in 42 days (first phase); VR2 - -animal visual reactivity in 84 days (second phase).
Dashed line represents values generated by equation: pH24 = 5.373 + 0.5493 (MC2), with r2 of 0.22.
Figure 2 - Functional relationship between animal reactivity in mobile cage measured on the 84th day (MC2) and 24
hours post mortem pH (pH24) in meat from Zebu (Nellore and Tabapuã) finished in feedlot.
5.2 5.4 5.6 5.8 6.0
0.25 0.35 0.45 0.55 0.65 0.75 0.85
pH
after
24
hours
(pH24)
associated with meat color (Table 2) are consistent with those found in the literature (Munchenje et al., 2009). No relationship was found between the parameters a * and b * and reactivity (Table 5). However, the reactivity was negatively correlated with the values of L*, and that the smaller value, the darker the flesh and, consequently, the lower its acceptance by the consumer.
The effect of pH on the variation of L* can be related to alteration of enzyme complexes related to the coloration of the flesh caused by increased reactivity. According to Voisinet et al. (1997), these changes are due to changes in the metabolism of the animal at the time of pre-slaughter caused by the force triggers.
Based on studies of Abularach et al. (1998) and Silveira et al. (2006), the optimal value of L* for beef would be equal to 38. In the conditions of work, according to the regression equation for L * (Figure 3), as it increases the reactivity, the luminosity of the flesh tends to be less intense. Thus, to obtain a good meat market acceptance, less reactive animals must be sought.
The meat of the animals evaluated in this experiment was considered tender. The average animal reactivity found was 4.26 kg (Table 2) and, according to the methodology used in this study for analysis of tenderness, the meat is considered tender if the animal reactivity value is below 4.60 kg (Fernandes et al., 2008).
The animal reactivity shows a positive correlation with shear force (Table 5), and according to the regression equation (Figure 4), for each increase of 0.1 points in animal
reactivity there is an increase of 0.25 points in the value shearforce.
Thus, the interaction between the animal reactivity and shear force (Table 5) is also evidenced by the values obtained by the regression equation (Figure 4), despite the low r2value presented.
The influence of animal reactivity on the shear force can be explained by the change in pH24 because it is related to the action of enzymes responsible for meat tenderness. Among these enzymes are cathepsins, which have optimum point for enzyme activity with the pH24 around 5.6 (Pardi et al., 2001; Alves et al. 2007; Roça, 2009). On the other hand, the calpains with optimum point at pH above 6.2 are the most important enzymes for meat tenderness. Thus, pH24 near the optimal value for the action of calpain promotes increased meat tenderness (Koohmaraie, 1994; Luchiari Filho, 2000; Volpelli et al., 2005).
Nevertheless, the positive correlation between reactivity and shear force found in this study may be explained by the fact that the maximum value of pH24 observed in the experiment was 6.1, since, according to Watanabe et al. (1996), in the pH24range between 5.8 and 6.1 there is no effective action of cathepsins. It is believed that the most reactive animals exhausted their glycogen stores, allowing small drop in pH, which was kept in a range that provides tougher meat. It is suggested that this was also the reason for the changes in meat color, because it is influenced by chemical reactions dependent on the ideal pH (Munchenje et al. 2009; Roça, 2009).
Dashed line represents values of L * generated by the equation: L * = 42.231 to 8.7502 (MC2), with r2 of 0.21.
Figure 3 - Functional relationship between the animal reactivity in mobile cage measured on the 84th day (MC2) and
meat luminosity (L *) in meat from Zebu (Nellore and Tabapuã) finished in feedlot.
32 33 34 35 36 37 38 39 40 41 42 43 44 45
0.25 0.35 0.45 0.55 0.65 0.75 0.85
Luminosity
(L*)
.
Animal reactivity in mobile cage (MC2)/1000
Dashed line represents values of shear force (SF) generated by the equation: SF = 3.0698 + 2.5364 (MC2), with r2 of 0.31.
Figure 4 - Functional relationship between animal reactivity in mobile cage measured on the 84th day (MC2) and
shear force (kgf) in meat from Zebu (Nellore and Tabapuã) finished in feedlot.
3.1 3.6 4.1 4.6 5.1 5.6 6.1
0.25 0.35 0.45 0.55 0.65 0.75 0.85
Shear
force
(kgf)
.
Conclusions
To quantify the reactivity, the methodology of animal reactivity in mobile cage is recommended. Animals with higher levels of reactivity tend to have average daily gain lower and below meat quality attributes. The evaluation of bovine reactivity can be used in animal breeding programs aiming to improve performance and meat quality.
References
ABULARACH, M.L.S.; ROCHA, C.E.; FELÍCIO, P.E. Características de qualidade do contrafilé (músculo longissimus dorsi) de touros
jovens da raça Nelore. Ciência e Tecnologia de Alimentos,
v.18, n.2, p.205-210, 1998.
AGUILAR, N.M.A.; BALBUENA, O.; PARANHOS DA COSTA, M.J.R. Evaluacion Del temperamento em bovinos cruza cebú. In: ENCONTRO ANUAL DE ETOLOGIA. COMPORTAMENTO E DESENVOLVIMENTO SUSTENTÁVEL, 22., 2004, Campo Grande. Anais... Campo grande: Sociedade Brasileira de Etologia, [2004]. (CD-ROM).
ALVES, D.D.; MANCIO, A.B. Maciez da carne bovina: uma revisão.
Revista da Faculdade de Zootecnia, Veterinária e Agronomia,
v.14, n.1, p.193-216, 2007.
BRASIL. Ministério da Agricultura e do Abastecimento. Regulamento da inspeção industrial e sanitária de produtos de origem
animal. Brasília: MMA, 1997. 241p.
CARNEIRO, R.L.R.; DIBIASI, N.F.; THOLON, P. et al. Estimative of heritability to temperament in Nelore cattle. In: WORLD CONGRESS ON GENETICS APPLIED TO LIVESTOCK
PRODUCTION, 8., 2006, Belo Horizonte. Proceedings...
Belo Horizonte: Instituto Prociência, 2006. p.12-17. CURLEY JUNIOR, K.O.; NEUENDORFTT, D.A.; LEWIS, A.W.
Evaluation of temperament and stress physiology may be useful
in breeding programs. Beef Cattle Research, p.1-4, 2004.
FERNANDES, A.R.M.; SAMPAIO, A.A.M.; HENRIQUE, W. et al. Características da carcaça e da carne de bovinos sob diferentes
dietas, em confinamento. Arquivo Brasileiro de Medicina
Veterinária e Zootecnia, v.60, n.1, p.139-147, 2008.
HEMSWORTH, P.H.; COLEMAN, G.J.; BARNETT, J.L. et al. Relationships between human-animal interactions and
productivity of commercial dairy cows. Journal of Animal
Science, v.78, n. 11, p.2821-2831, 2000.
KOOHMARAIE, M. Muscle proteinases and meat aging. Meat
Science, v.36, n.1, p.93-104, 1994.
LANCASTER, P.A.; CARSTENS, G.E.; BROWN, E.G. et al. Relationships between residual feed intake, ultrasound, and
temperament traits in Brangus heifers. Journal of Animal
Science, v.83, p.325, n.1, 2005 (suppl.).
LANIER, J.L.; GRANDIN, T.; GREEN, R. A note on hair whorl
position and cattle temperament in the auction ring. Applied
Animal Behavior Science, v.73, n.2, p.93-101, 2001.
LE NEINDRE, P.; BOIVIN, X.; BOISSY, A. Handling of extensively
kept animals. Applied Animal Behaviour Science, v.49,
n.1, p.73-81, 1996.
LUCHIARI FILHO, A. Pecuária da carne bovina. São Paulo:
LinBife, 2000. 134p.
MAFFEI, W.E.; BERGMANN, J.A.G.; PINOTTI, M. Reatividade em ambiente de contenção móvel: uma nova metodologia para avaliar
o temperamento bovino. Arquivo Brasileiro de Medicina
Veterinária e Zootecnia, v.58, n.6, p.1123-1131, 2006.
MAFFEI, W.E. Reatividade animal. Revista Brasileira de
Zootecnia, v.38, p.81-92, 2009 (supl. especial).
MACDOUGALL, D.B. Colour meat. In: PEARSON, A.M.; DUTSON,
T.R. (Eds.). Quality attributes and their measurement in
meat, poultry and fish products - Advances in Meat Research
Series. London: Blackie Academic & Professional, 1994. v.9, p.79-93.
MUCHENJE, V.; DZAMA, K.; CHIMONYO, M. et al. Some biochemical aspects pertaining to beef eating quality and consumer health: a review. Food Chemistry, v.112, n.2, p.270-289, 2009. MUNCK, A. Glucocorticoid inhibition of glucose uptake by peripheral tissues: old and new evidence, molecular mechanisms, and
physiological significance. Perspectives in Biology and
Medicine, v.14, n.2, p.265-269, 1971.
NATIONAL RESEARCH COUNCIL - NRC. Nutrient requirements
of beef cattle. 7.ed. Washington, D.C.: 2000. 242p.
PARANHOS DA COSTA, M.J.R.; SILVA, E.V.C. Aspectos básicos
do comportamento social de bovinos. Revista Brasileira de
Reprodução Animal, v.31, n.2, p.172-176, 2007.
PARDI, M.C.; SANTOS, F.; SOUZA, E.R. et al. Ciência, higiene
e tecnologia da carne. 23.ed. Goiânia: UFG, 2001. 623p.
PETHERICK, J.C.; HOLROYD, R.G.; DOOGAN, V.J. et al. Productivity, carcass and meat quality of lot fed Bos indicus cross
steers grouped according to temperament. Australian Journal
of Experimental Agriculture, v.42, n.4, p.389-398, 2002.
PHOCAS, F.; BOIVIN, X.; SAPA, J. et al. Genetic correlations between temperament and breeding traits in Limousin heifers.
Animal Science, v.82, n.6, p.805-811, 2006.
PIOVENZAN, U. Análise dos fatores genéticos e ambientais
na reatividade de quatro raças de bovino de corte ao
manejo. 1998. 42f. Dissertação (Mestrado em Zootecnia)
-Faculdade de Ciências Agrárias e Veterinárias/Universidade Estadual Paulista “Júlio de Mesquita Filho”, Jaboticabal. ROÇA, R.O. [2009]. Modificações p o s t - m o r t e m. Botucatu:
Laboratório de Tecnologia dos Produtos de Origem Animal. Available at: <http://www.fca.unesp.br>. Accessed on: Sept. 12, 2009.
SALIBA, E.O. Uso de indicadores: passado, presente e futuro. In: TELECONFERÊNCIA SOBRE O USO DE INDICADORES EM
NUTRIÇÃO ANIMAL, 1., 2005, Belo Horizonte. Anais... Belo
Horizonte: UFMG, 2005. p.4-22.
SAPOLSKY, R.M.; ROMERO, L.M.; MUNCK, A.U. How do glucocorticoids influence stress responses? Integrating permissive, suppressive, stimulatory, and preparative actions.
Endocrine Reviews, v.21, n.1, p.55-89, 2000.
SHACKELFORD, S.D.; KOOHMARAIE, M.; MILLER, M.F. et al. An evaluation of tenderness of the longissimus muscle of Angus
by Hereford versus Brahman crossbred heifers. Journal of
Animal Science, v.69, n.1, p.171-177, 1991.
SILVEIRA, I.D.B.; FISCHER, V.; SOARES, G.J.D. Relation between genotype and temperament of grazing steers on meat quality.
Revista Brasileira de Zootecnia, v.35, n.2, p.519-526, 2006.
STEPHENS, J.W.; DIKEMAN, M.E.; UNRUH, J.A. et al. Effects of prerigor injection of sodium citrate or acetate, or post-rigor injection of phosphate plus salt on post-mortem glycolysis, pH, and pork quality attributes. Meat Science, v.74, n.4, p.727-737, 2006.
VALADARES FILHO, S.C.; MORAES, E.H.B.K.; DETMANN, E. Perspectivas do uso de indicadores para estimar o consumo individual de bovinos alimentados em grupo. In: REUNIÃO ANUAL DA SOCIEDADE BRASILEIRA DE ZOOTECNIA, 43., 2006, João Pessoa. Anais... João Pessoa: SBZ, 2006. (CD-ROM). VOISINET, B.D.; GRANDIN, T.; TATUM, J.D. et al. Feedlot cattle with calm temperaments have higher average daily gains than cattle with excitable temperaments. Journal of Animal Science, v.75, n.4, p.892-896, 1997.
VOLPELLI, L.A.; FAILLA, S; SEPULCRI, A. et al. Calpain system in vitro activity and myofibril fragmentation index in fallow deer
(Dama dama): effects of age and supplementary feeding. Meat
Science, v.69, n.3, p.579-582, 2005.
WATANABE, A.; DALY, C.C.; DEVINE, C.E. The effect of the ultimate pH of meat on tenderness changes during ageing. Meat