Lithic technological responses to Late
Pleistocene glacial cycling at Pinnacle Point
Site 5-6, South Africa
Jayne Wilkins1,2*, Kyle S. Brown1, Simen Oestmo3, Telmo Pereira4, Kathryn L. Ranhorn5, Benjamin J. Schoville1,3, Curtis W. Marean2,3
1 Human Evolution Research Institute, Department of Archaeology, University of Cape Town, Rondebosch, Private Bag, South Africa, 2 Centre for Coastal Paleoscience, Nelson Mandela Metropolitan University, Port Elizabeth, Eastern Cape, South Africa, 3 Institute of Human Origins, School of Human Evolution and Social Change, Arizona State University, Tempe, AZ, United States of America, 4 Interdisciplinary Center for Archaeology and Evolution of Human Behavior, Faculdade das Ciências Humanas e Sociais, Universidade do Algarve, Campus Gambelas, Faro, Portugal, 5 Center for the Advanced Study of Human Paleobiology, George Washington University, Washington, DC, United States of America
*jayne.wilkins@uct.ac.za
Abstract
There are multiple hypotheses for human responses to glacial cycling in the Late Pleisto-cene, including changes in population size, interconnectedness, and mobility. Lithic techno-logical analysis informs us of human responses to environmental change because lithic assemblage characteristics are a reflection of raw material transport, reduction, and discard behaviors that depend on hunter-gatherer social and economic decisions. Pinnacle Point Site 5–6 (PP5-6), Western Cape, South Africa is an ideal locality for examining the influence of glacial cycling on early modern human behaviors because it preserves a long sequence spanning marine isotope stages (MIS) 5, 4, and 3 and is associated with robust records of paleoenvironmental change. The analysis presented here addresses the question, what, if
any, lithic assemblage traits at PP5-6 represent changing behavioral responses to the MIS 5-4-3 interglacial-glacial cycle? It statistically evaluates changes in 93 traits with no a priori
assumptions about which traits may significantly associate with MIS. In contrast to other studies that claim that there is little relationship between broad-scale patterns of climate change and lithic technology, we identified the following characteristics that are associated with MIS 4: increased use of quartz, increased evidence for outcrop sources of quartzite and silcrete, increased evidence for earlier stages of reduction in silcrete, evidence for increased flaking efficiency in all raw material types, and changes in tool types and function for silcrete. Based on these results, we suggest that foragers responded to MIS 4 glacial environmental conditions at PP5-6 with increased population or group sizes, ‘place provisioning’, longer and/or more intense site occupations, and decreased residential mobility. Several other traits, including silcrete frequency, do not exhibit an association with MIS. Backed pieces, once they appear in the PP5-6 record during MIS 4, persist through MIS 3. Changing paleoenviron-ments explain some, but not all temporal technological variability at PP5-6.
a1111111111 a1111111111 a1111111111 a1111111111 a1111111111 OPEN ACCESS
Citation: Wilkins J, Brown KS, Oestmo S, Pereira T, Ranhorn KL, Schoville BJ, et al. (2017) Lithic technological responses to Late Pleistocene glacial cycling at Pinnacle Point Site 5-6, South Africa. PLoS ONE 12(3): e0174051.https://doi.org/ 10.1371/journal.pone.0174051
Editor: Michael D. Petraglia, Max Planck Institute for the Science of Human History, GERMANY Received: November 10, 2016
Accepted: March 2, 2017 Published: March 29, 2017
Copyright:© 2017 Wilkins et al. This is an open access article distributed under the terms of the Creative Commons Attribution License, which permits unrestricted use, distribution, and reproduction in any medium, provided the original author and source are credited.
Data Availability Statement: All relevant data are within the paper and its Supporting Information files.
Funding: Funding was provided by the Social Science and Humanities Research Council of Canada (JW), NORAM and The American-Scandinavian Foundation (SO), Fundac¸ão para a Ciência e Tecnologia SFRH/BPD/73598/2010 (TP), IGERT DGE 0801634 (KLR), the Hyde Family Foundations, Institute of Human Origins, and the National Science Foundation 9912465,
BCS-Introduction
Humans are unique for their extreme behavioral plasticity and their exaggerated dependence on social learning [1–7]. Given that the modern human lineage originates in Africa, it then fol-lows that the roots for these traits have their origins in Africa, but the origin point or points are still unknown. Humans with modern physical characteristics first appeared in East Africa ~190–150 ka [8–10]. Evidence for behaviors linked to modern behavioral capacities–symbol-ism, complex tools, sophisticated foraging strategies–first begin appearing in South Africa at about the same time ~ 160 ka [11,12], but become more common and widespread starting ~100 ka [13–32].
The latter part of the evolution of our species witnessed three major glacial cycles; marine isotope stages (MIS) 6 (191 ka-130 ka), MIS 4 (74 or 71 ka-57 ka), and MIS 2 (29 ka-14 ka) [33,34]. While the precise environmental impacts of these glacial cycles are still relatively unknown, it is safe to say that they would have had some significant impacts on the distribu-tion of resources upon which humans relied. It has been argued that humans adapted to cli-mate change by changing their mobility strategies and the degree to which they invested in inter-group trade and exchange [35], and that fluctuating conditions through the Plio-Pleisto-cene may have selected for human traits that permit flexible behavioral responses to new environments [36]. Glacial pulses in the Pleistocene may have also isolated early human popu-lations, explaining evidence for low genetic diversity in modern human populations [37] and perhaps promoted territoriality and hyper-prosociality [38,39]. On the south coast of South Africa, there is a research program in place to specifically model these impacts [40,41].
There is some consensus that behavioral variability through the Late Pleistocene in South Africa is at least in part explained by technological adaptation to changing environmental con-ditions. However, as is detailed below, even at the largest scale of MIS and glacial/interglacial cycles, there is a huge degree of disagreement on how exactly early modern humans responded to these changing environmental conditions, even on a broad, time-averaged scale. The dis-agreement persists largely because few Late Pleistocene archaeological sites are connected to robust and regional paleoenvironmental records, and there are few sites that preserve long sequences across multiple MIS. Because it is linked to a robust paleoenvironmental record and a multidisciplinary program focused on characterizing past resource availabilities [40,42–50], Pinnacle Point Site 5–6 (PP5-6) presents an ideal case study for examining the nature of early modern human behavioral responses to glacial cycling in the Late Pleistocene.
Lithic artifacts are a reflection of cognition, cultural patterns, technological needs, and eco-nomic decision making, and they provide information on how past populations moved across the landscape, chose stone raw material sources, manufactured tool blanks and tools, and dis-carded debris. Informed by a combination of experimental and ethnographic research, lithic technology is used to make higher-level interpretations about human behaviors such as inter-action (e.g. [35,51–53]), mobility (e.g. [35,54]), cultural learning and innovation (e.g. [23,55,
56]), and group/population size (e.g. [35,57]).
This paper investigates how early modern humans responded to glacial cycling during the Late Pleistocene at PP5-6, South Coast, South Africa. It examines the lithic technological sequence from the site at the scale of MIS. Based on more than 65 optically stimulated lumines-cence (OSL) age estimates, PP5-6 provides a high-resolution, nearly continuous record of early modern human behavior between ~89 and ~51 ka [22,43], spanning two interglacials (MIS 5 and MIS 3) and one glacial (MIS 4). The question addressed by this analysis is:what, if any, lithic assemblage traits at PP5-6 represent changing behavioral responses to the MIS 5-4-3 interglacial-glacial cycle?
0130713, BCS-0524087, BCS-1138073 (CWM). Marean recognizes the support of a grant from the John Templeton Foundation to the Institute of Human Origins at Arizona State University. The opinions expressed in this publication are those of the author(s) and do not necessarily reflect the views of the John Templeton Foundation or any other granting agency. The funders had no role in study design, data collection and analysis, decision to publish, or preparation of the manuscript. Competing interests: The authors have declared that no competing interests exist.
Background
The effect of Late Pleistocene glacial cycling on temperature and rainfall
Researchers generally associate glacial periods in Africa with colder, drier climates and inter-glacial periods, such as today, with warmer, wetter climates (e.g., [58]). The sedimentary and speleothem records at some interior sites are in line with this generalization [59,60]. These patterns, however, varied across the continent [61] and for southern Africa [62]. Environmen-tal indicators at many sites are consistent with cooler and wetter conditions during the Last Glacial Maximum [63–65] and MIS 4 [66]. For the Cape, there is disagreement on whether gla-cial phases were characterized by increased aridity or increased moisture, and the lack of evi-dence for major changes in precipitation suggests that changes in overall moisture availability may have been muted [67], while changes in rainfall seasonality may have been significant [42].
In addition to influencing the amount of precipitation, it has been argued that glacial cycling influenced the position of the winter rainfall belt, changing for many regions across South Africa the relative inputs of winter and summer rainfall [68]. The exact impacts are still unclear [67]; the winter rainfall regime in South Africa generally supports C3pathway plants,
while the summer and bimodal rainfall regime supports more C4pathway grasses. At Crevice
Cave on the South Coast near Pinnacle Point, speleothem isotopes track this shifting rainfall regime, showing relatively more input from the summer rainfall regime during MIS 4 with a lessened summer rain input during MIS 5 [42]. This finding is inconsistent with general pre-dictions that glacial phases will normally be characterized by expansions of the winter rainfall regime [69,70]. For most parts of South Africa, whether glacial conditions were wetter or drier, and whether there was an increase or decrease in seasonal rainfall are not yet resolved, but there is consensus that the large-scale global changes in temperature resulted in differing rainfall conditions during MIS 5, 4, and 3.
The effect of Late Pleistocene glacial cycling on food resource
distribution
Changes in climate and vegetation due to glacial cycling would have affected the distribution of food resources for supporting a hunter-gatherer lifestyle across the landscape, and theory allows some basic predictions as to how this may have affected hunter-gatherer behavior. For example, Dyson-Hudson and Smith [71] emphasized the importance of resource predictability and density for understanding human territoriality (see also [72–74]). Harpending and Davis [75] have highlighted the relationship between resource predictability, density and mobility. Bleed [76] argues that the most important parameter for understanding hunting weapon design is predictability. Resource density will also set the limits on population size. In general, humans should adapt to predictable and densely-packed resources with elevated territoriality [71], decreased mobility [75], and ‘over-designed’ reliable hunting weapons [76], and their populations will increase. Building on the above, Ambrose and Lorenz [35] hypothesized the resource distribution during MIS 5 in South Africa (interglacial) was predictable and dense, during MIS 4 (glacial) resource distribution was predictable and scarce, and that during MIS 2 (glacial), resource distribution was unpredictable and dense. Resource structure for MIS 3 (interglacial) remains unknown. These generalizations were based on a combination of envi-ronmental and archaeological data from sites such as Border Cave, Boomplaas Cave, Montagu Cave, Nelson Bay Cave, and Klasies River, and on the following characterizations: (1) resources in savanna and grassland biomes with large herds of migratory ungulates are unpredictable and dense, (2) coastal resources such as shellfish are predictable and dense, (3) scrub or fynbos
is characterized by predictable, but scarce resources in the form of small mammals with an even dispersion. The characterization for MIS 4 is partly based on evidence for scrub-adapted species in the archaeological record during this time [35].
In contrast, Marean [38,77] suggests that resource predictability and density across much of the West and South Coast changed little in response to glacial cycling. The primary driver of Pleistocene change was the expansion and contraction of the Paleo-Agulhas Plain, which resulted in changes in the size and structure of resources based on that plain [67]. A key com-ponent of this model is that by the late Middle Pleistocene or early Upper Pleistocene humans had adopted a coastal adaptation on the south coast that relied to a large extent on shellfish resources which tend to be dense and predictable [38], and was supplemented by exploitation of the diverse geophyte plants and a migratory large mammal ecosystem on the Paleo-Agulhas Plain [49,77,78]. Because of the stable supply of predictable and dense resources, these regions may have been able to support human populations through glacial periods when other regions were not, however, a more robust investigation is required to hind cast changes in resource availabilities in response to glacial cycling [40].
The effect of Late Pleistocene glacial cycling on human behaviors
There are many hypotheses about how Late Pleistocene humans in South Africa responded to changing resource availabilities due to glacial cycling and some hypotheses are contradictory to each other. To summarize what will be detailed below, the various human responses to gla-cial conditions in southern Africa that have been proposed include reduced population sizes (page 107 in [79] and page 163 in [80]), demographic expansions ([81], c.f. [82]), increased population and/or group sizes and longer and more intense site occupations [43], increased mobility [35,54], decreased residential mobility [54], increased interconnectedness [35,51,
83], decreased interconnectedness [84], increased resource intensification [15,35,85–87], and decreased territoriality [35,79,80].
Some researchers have focused on changes in mobility and settlement systems. Ambrose and Lorenz [35] suggest that foragers in southern Africa generally had higher mobility during glacials than during the current interglacial. Similarly, McCall and Thomas argue that the unique technological characteristics of two MSA industries that date to MIS 4—the Still Bay (SB) and Howiesons Poort (HP)—reflect changing mobility systems during a glacial period. It is argued by McCall and Thomas [54] that the SB reflects extreme mobility, and the HP differs from the SB in that it reflects a logistical mobility system that would have resulted in longer occupations at residential camps (i.e., reduced residential mobility). Consistent with the latter prediction for reduced residential mobility, but not necessarily a logistical mobility system, Karkanas et al. (2015) found there is sedimentological evidence for increased site occupation intensity during the MIS 4 glacial compared to the MIS 5 interglacial at PP5-6. At Klipdrift Shelter, Reynard et al. [88], found that an environmental shift toward open grasslands during the HP occupation corresponds with increased faunal density and trampling evidence suggest-ing increased occupation intensity [88].
Another potential response of humans to glacial cycling concerns interaction and inter-group connectedness. Mackay et al. [51] suggest that during MIS 4 (glacial), there was in-creased interconnectedness, or ’coalescence’, in contrast to MIS 5 and 3 (interglacials), when human populations were more fragmented and isolated. In a related vein, Ambrose and Lorenz [35] suggest that there was increased information exchange during MIS 2 and 4 (gla-cials) compared to the current interglacial. Lowered sea-levels during glacials, which expose a continuous, unobstructed coastal plain that is accessible to the interior, may have facilitated these increased interactions [83].
Related to inter-group connectedness, innovation and symbolism have also been tied to MIS 4 glacial conditions. For example, it is argued that rapid cooling events in MIS 4 created selective pressures for the innovation and invention of new technologies such as bifacial points and backed pieces [89]. Glacial conditions may have changed resources distributions in such a way as to select for risk reduction behaviors in humans, such as technological overdesign (i.e., reliable technology [90]) and increased trade and exchange [35]. Increased information exchange and interaction between groups living in diverse environments helps buffer the effects of environmental change and scarce or unpredictable resources [91]. Interaction is facil-itated by symbolic items–in MIS 4, potentially ochre, beads, engraved ostrich eggshell, weapon tips, rare raw material types [13,15,52,53,92]–and increased interaction fuels innovation– because it expands the number and reach of social learning opportunities [93]. Mellars [81] suggests new economic, social, and cognitive behaviors in MIS 4 were the impetus for a dra-matic demographic expansion that ultimately resulted in the dispersal of modern humans into Eurasia and beyond. However, Wadley [94,95] problematizes using similarities in lithic mate-rial culture to make interpretations about the flow of ideas, and the presence of what archaeol-ogists consider symbolic items as evidence for cultural complexity.
In contrast, others argue that it was strong glacial pulses in the Pleistocene that likely isolated early human populations [77,78,84,96], particularly during MIS 6 when genetic evidence sug-gests a bottleneck in the human lineage [97]. Isolated populations result in diversifying popula-tions and cultures, and can lead to regional population extincpopula-tions. However, Blome et al. [61] show that changes in the frequency of archaeological sites is asynchronous with climate change, and argue that there is no support for population decline during MIS 4.
Lithic technological responses. Two technological industries in South Africa–the Still
Bay (SB) and Howiesons Poort (HP)–date to MIS 4 [98–100]. The SB, characterized primarily by the presence of finely-made bifacial points, and the HP, characterized primarily by the pres-ence of backed pieces and bladelets, have been presented as exceptional technological phases that flickered in and out of existence (e.g. [89,93,98,101,102]). Based on numerous and well-constrained age estimates at PP5-6, Brown et al. [22] have showed that backed pieces and small blade technology persisted for at least 11 ka starting 71 ka. Earlier dates for the HP at Diepkloof in the order of ~100 ka have also been produced, and are the focus of current debate [99,103–105]. The post-HP MIS 3 assemblages [~58 ka, 98] at Klasies River lack backed pieces [106], but backed pieces are present in other early MIS 3 assemblages at sites such as Diepkloof Rockshelter [107], Rose Cottage Cave [108], and Sibudu Cave [109]. It has been suggested that, in general, Late Pleistocene glacial assemblages compared to interglacial assemblages exhibit more emphasis on blade flaking systems rather than radial flaking systems and more emphasis on backed artifacts or bifacial points rather than unifacial points or denticulates, [51]. How-ever, backed pieces and bifacial points are not unique to one particular time period and have a long, but perhaps, punctuated, chronology in the South African MSA [110].
With regard to human behavioral responses to glacial cycling that are reflected specifically by lithic technology, the observations and interpretations are diverse. Some researchers pro-pose that the lithic assemblages of MIS 4 are marked by inter-regional similarities, and MIS 5 and 3 by inter-regional heterogeneity [35,51]. Based on the presence of large assemblages with evidence for onsite production, Mackay et al. [51] suggest that there is increased evidence for ‘place’ rather than individual provisioning during the HP. For the SB, small assemblages with emphasis on implement repair and maintenance are consistent with individual provisioning [51]. Comparisons to earlier and later time periods are not available because of limited data. The HP (glacial) phase at Diepkloof and Klein Kliphuis is characterized by an increased edge length to mass ratio compared to earlier and later periods, which is reflective of more conser-vative, more efficient flaking strategies [111].
One of the best documented shifts in lithic technology at South African sites is an increase in more ‘non-local’ (c.f. [112]) and/or fine-grained raw materials during glacial MIS 4 [35,51,
113] and glacial MIS 2 [79,90]. It is now known that in many cases, the “non-local” silcrete at MSA assemblages is actually local [112] and only appears different due to the effects of heat treatment [12]. At Klasies River, the frequency of silcrete and other fine-grained raw materials decreases in the MIS 3 (MSA III) occupation compared to the MIS 4 (HP) occupation [114]. At other sites, such as Diepkloof [107], Rose Cottage Cave [108], and Sibudu Cave [115], the raw material shift is less pronounced or absent.
The lithic characteristics described above have been variably linked to aspects of hunter-gatherer demography, mobility, and interaction, but there are inter-analyst differences in how the variability is interpreted. For example, the increased use of ‘non-local’ or fine-grained raw material has been interpreted as evidence for increased residential mobility [35,54], decreased residential mobility [54], and increased interconnectedness [35,51]. Related to the latter, other researchers have emphasized the non-functional, symbolic aspects of raw material choice [52,
53]. The raw material shift associated with MIS 4 has also been interpreted in a strictly cost-benefit framework, where the shift can be explained by changing costs in the procurement and production of silcrete versus quartzite [113,116].
More recently researchers have been emphasizing the lack of a deterministic relationship between environment and lithic technology in the MSA. For example, Wurz [56], draws atten-tion to the point that the apparent increase in temporal and spatial patterning during the SB and HP compared to earlier and later time periods could be in part a reflection of more intense research, and that those industries are best understood within the context of local historical trajectories of technological change rather than as responses to environmental change. This perspective of the MSA in general is supported by evidence for dynamic, short-term behavioral variability in the recently studied MIS 3 levels at Sibudu [117–119]. At Blombos Cave, the SB technocomplex is associated with warmer temperatures (based on shellfish types) and higher productivity (based on mammal assemblages), leading Langejans et al. [120] to argue that the SB technocomplex is not an adaption to harsh conditions or low environmental productivity as has previously been suggested. Clark [121] and Wadley [95] highlight a marked disconnect at Sibudu in the timing and nature of changes in the local environment relative to HP-post HP technological change and at the scale of the technocomplex. A lack of correlation between local environmental change and technological change at Blombos Cave and Klipdrift Shelter is used to argue that environment was not a significant driver of innovation, also at the scale of the technocomplex [122]. In their multi-site, macro-scale investigation of MSA variability, Kandel et al [123] argue that the Early MSA, SB, HP, and Late MSA are not associated with any particular environmental condition or conditions, and thus cultural change is not con-nected to environmental factors.
Mobility and lithic assemblage characteristics. Lithic assemblage characteristics have
been used to establish how hunter-gatherer mobility changed through time. Mobility can be classified as residential or logistical [124], where the mobility strategy of a hunter-gatherer group is conceptualized as involving both kinds of mobility, but with different relative impor-tance along a continuum [125–127]. Residential mobility describes the process of moving all members of a group from one residential location to another. Logistical mobility describes the process of a small sub-groups moving away from the residential site for short-term stays at sep-arate camps. Often, groups with low residential mobility have high logistical mobility, because special task groups move resources back to residential camps, reducing the need to move the whole group. However, this is not always the case; some hunter-gatherer groups, such as many contact period California Indians, simultaneously exhibit low residential mobility and low logistical mobility, and can thus be described as relatively more sedentary then other
hunter-gatherer groups [41]. This mobility strategy is normally associated with focused use of dense and predictable resources, such as marine resources. Therefore, mobility strategy must be characterized, not along a single residential-logistical continuum, but along two axes, with the second axis reflecting degree of sedentariness combined with a lack of logistical mobility [41].
PP5-6 permits a consideration of changing degrees of residential mobility and sedentari-ness. The protective nature and large space afforded by the rockshelter geologic structure would make the site an attractive locus of re-occupation. The high density of artifacts particu-larly compared to nearby open-air localities at Vleesbaai [128], low frequency of impact frac-tures [129], and range of tool edge damage patterning that represents a range of processing activities [130] suggest that PP5-6 served primarily as a residential site [124,131] through much, but not necessarily all, of its occupation record. For that reason, duration of occupation at PP5-6 primarily informs us about degree of residential mobility. The resource structure and low seasonality of southern Africa would, in general, not promote high degrees of logistical mobility, but there were likely changes in the degree of residential mobility, or sedentariness, depending on the resource base [41].
Proxies for the duration of occupation at PP5-6 give an indication of how frequently early modern human hunter-gatherers made residential moves. The archaeological record indicates that many prehistoric North American groups shifted to more ‘expedient’ and ‘informal’ stone technologies (i.e., fewer prepared cores, fewer retouched pieces, less intense reduction) when they became more sedentary, and their residential mobility decreased [132]. This is because lithic raw material can be effectively abundant at base camps due to direct local availability, embedded procurement, or place provisioning. However, others have demonstrated that more ‘formal ‘ technologies that lengthen the use-life of cores and tools (i.e., more prepared cores, more retouched pieces, and/or more intense reduction) are produced by sedentary groups when good quality lithic raw materials are not locally abundant [131,133]. When decreased residential mobility situates hunter-gatherer groups where there is a local scarcity of good quality lithic raw material, hunter-gatherers can respond by using more intense reduction strategies, represented by a higher blank to core ratio, smaller flakes and cores, and less cortex [134]. Depletion can also play a role in raw material availability; raw material will also be more efficiently and intensely reduced when raw materials near a site are continuously exploited because duration of occupation is longer, or group/population size is larger [135]. How we interpret the lithic assemblage characteristics at PP5-6 with respect to mobility will depend on what probable stone raw material sources we identify and how use of those sources changed through time. As will be discussed further below, the coastal characteristics of the area where Pinnacle Point is located might considerably influence the recognition of raw material sources. Some may currently be submerged and others may be hidden under the dunes.
Pinnacle Point 5–6
PP5-6 is a rockshelter and cave site at Pinnacle Point on the south coast of South Africa near Mos-sel Bay. The rockshelter and cave formed in the quartzitic cliffs that belong to the Table Mountain Sandstone Group. There are two main sections of the site, PP5-6 North and PP5-6 South, which were probably connected in the past but are now separated by a major eroded area. PP5-6 North is divided into three areas—the Northwest Remnant, the Long Section, and the South Remnant. The Long Section has the temporally longest and vertically thickest main deposit at the site. It is a ~14 vertical meter excavated section of sediment that built up against a cliff face and partially under the rockshelter. That sediment stack overlies an aeolian dune that is at least ~4 m thick, and probably is the same dune that sealed many of the caves on the western side of Pinnacle Point ~90 ka [43]. The rockshelter follows a south-trending fault breccia. An erosion gully that follows
the back wall of the shelter has removed some of the original deposit there, and created a west-fac-ing cliff-face that is one of the two cliff-faces in the Long Section targeted for excavation. The other cliff-face is south-facing and resembles a catastrophic detachment of sediment, probably due to high-sea stands [43]. The excavated portion of the PP5-6 North Long Section exposes a continuous section of Middle Stone Age deposits, ~14 m in height, rich in lithic artifacts, fauna, ochre, ostrich eggshell, and hearths.
The PP5-6 North Long Section consists of 11 major geological Stratigraphic Aggregates (StratAggs) defined based on broad-scale changes in sedimentation. These StratAggs are hori-zontally continuous across large excavation areas and represent a homogenous set of forma-tion processes recognized based on field observaforma-tions, micromorphology, and GIS-based analysis of structure in the plotted finds [43]. Within the StratAggs there are several other geo-logical stratigraphic groupings at smaller scales that capture more subtle changes in sedimenta-tion. Sub-Aggregates (SubAggs) have a horizontally continuous character beyond a 1 x 1 m square and are typically either palimpsests of combustion features with dense artifact concen-trations or strongly geogenic units. Stratigraphic Units (StratUnits) represent small strati-graphic lenses and features and capture the most subtle changes in sediment color and texture. This scale of stratigraphic grouping does not typically extend beyond a 50 x 50 cm quadrant; when it does, each quadrant is further divided into Lots. A Lot is the smallest unit within this system of hierarchical stratigraphic grouping, and excavation occurs at the scale of the Lot. All excavated artifacts within the PP5-6 North Long Section have been piece-plotted using total stations. More than 300,000 plotted finds have been excavated so far.
Below is a summary of each of the geological StratAggs in the PP5-6 North Long Section, from bottom of the sequence to the top. Details about the sedimentology and micromorphol-ogy have been reported by Karkanas et al. [43]. More than 65 single-grain OSL age estimates from this section provide a robust and detailed chronology. Optically stimulated luminescence (OSL) analyses were conducted by Zenobia Jacobs. Updated weighted mean OSL ages for each StratAgg were reported by Karkanas et al. [43] and those ages are used here. The Pinnacle Point OSL chronologies have been blind tested with U-Th dating in two separate caves and found to be concordant [42,136].
Yellow Brown Sand (YBS), weighted mean OSL age 96 ± 6 ka, MIS 5—aeolian dune at base of
sequence, at least 3 m in thickness, minimal anthropogenic input, rare artifacts near contact with overlying StratAgg, corresponds with aeolian event that has also been recognized at other Pinnacle Point sites and is tightly constrained to ~90 ka [42,136,137];
Yellowish Brown Sand and Roofspall (YBSR), weighted mean OSL age 89 ± 5 ka, MIS
5—roof-spall rich, contains lenses of combustion features representing single intact hearth structures normally with significant mollusk remains, interbedded with layers of free-fall roofspall with little anthropogenic input, 1.25 m in thickness;
Light Brown Sand and Roofspall (LBSR), weighted mean OSL age 81 ± 4 ka, MIS
5—sedimen-tologically similar to YBSR, roofspall rich, contains lenses of combustion features representing single intact hearth structures normally with significant mollusk remains, interbedded with layers of roofspall with little anthropogenic input, ~4.5 m in thickness;
Ashy Light Brown Sand (ALBS), weighted mean OSL age 72 ± 3 ka, MIS 4—sands with
sev-eral lenses of dense human occupation and ash rich shell middens, deposited after a significant roof fall event, 0.8 m in thickness;
Shelly Ashy Dark Brown Sand (SADBS), weighted mean OSL age 71 ± 3 ka, MIS 4—thick
deposit of trampled combustion microfacies that represent a cumulative palimpsest of hearth features that are not individually discernable, mollusk remains abundant but not forming a shell supported matrix, the oldest assemblage of backed pieces at Pinnacle Point were recov-ered from this StratAgg [22], 0.7 m in thickness;
Orange Brown Sand 1 (OBS1), weighted mean OSL age 69 ± 3 ka, MIS 4—aeolian sand layers
with thin layers of trampled and reworked combustion feature palimpsests, mollusk remains present, 0.7 m in thickness;
Shelly Gray Sand (SGS), weighted mean OSL age 64 ± 3ka, MIS 4—concentrated input of
trampled and reworked combustion feature palimpsests, very dense shell-supported matrix in some SubAggs, 0.3 m in thickness;
Orange Brown Sand 2 (OBS2), weighted mean OSL age 63 ± 3 ka, MIS 4—similar to OBS1,
aeolian sand layers with thin layers of trampled and reworked combustion feature palimpsests, mollusk remains appear absent, decalcified, 1 m in thickness;
Dark Brown Compact Sand (DBCS), weighted mean OSL age 62 ± 3 ka, MIS 4—debris flow
that truncates OBS2, SGS, and OBS1, lithic artifacts consistent with strict definition of HP industry [22], earlier phase of the same depositional process that produced the BBCSR (see below), includes eroded sediments of OBS2, 0.75 m in thickness;
Black Brown Compact Sand and Roofspall (BBCSR), weighted mean OSL age 52 ± 3 ka, MIS 3—previously Black Compact Sand and Roofspall (BCSR), thick black layer rich in burnt
finds, 0.5 m in thickness;
Reddish Brown Sand and Roofspall (RBSR), weighted mean OSL age 51 ± 2 ka, MIS
3—aeo-lian sand with paleosol formation, centimetric and decimetric roofspall, find density low, over-lies entirety of North Long Section, 2.75 m in thickness.
For the analyses presented here, StratAggs were lumped into MIS stages based on their mean OSL age estimate; StratAggs YBSR and LBSR date to MIS 5, ALBS, SADBS, OBS1, SGS, OBS2, and DBCS date to MIS 4, BBCSR and RBSR date to MIS 3. The ALBS represents a major break in the formation of the site and the sedimentation from roofspall-dominated to aeolian [43]. The sedimentation change is roughly concordant with the transition from warmer conditions in MIS 5 to cooler conditions in MIS 4 [138] and also coincides with a shift in coastline distance [44]. For these reasons SADBS and ALBS are included within MIS 4, fol-lowing Karkanas et al. [43], despite having weighted mean OSL age estimates that situate them right at the MIS 5 to MIS 4 boundary.
Glacial cycling at PP5-6
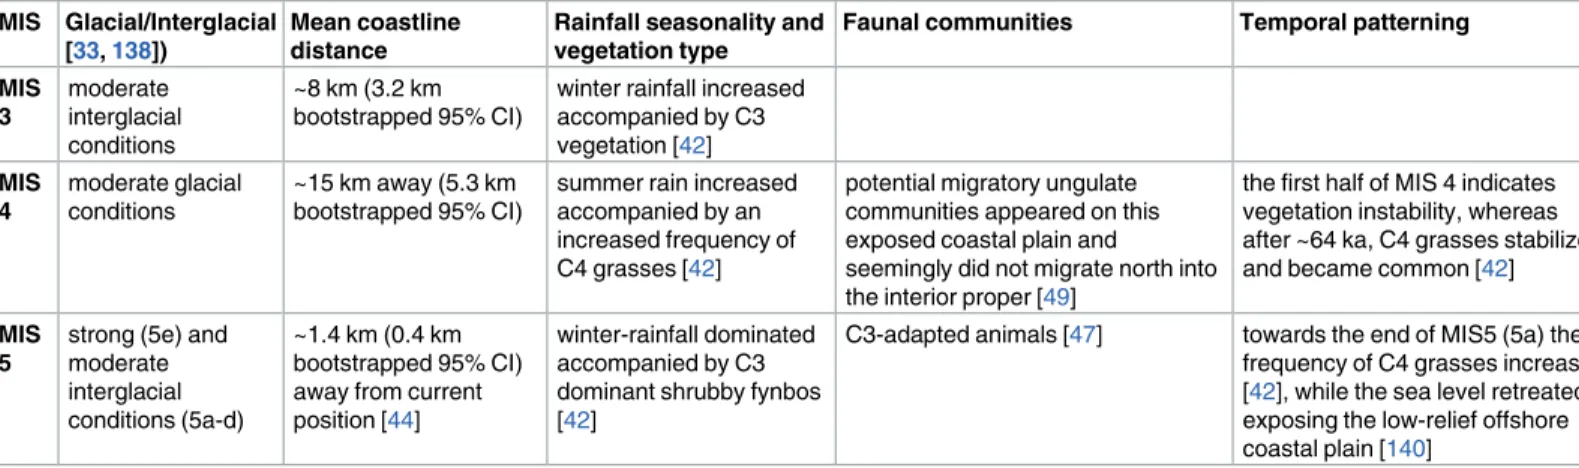
The time period represented at PP5-6 covers a portion of MIS 5b and the entirety of MIS 5a, all or at least most of MIS 4, and of the early part of MIS 3. Based on benthicδO18records, MIS 5b and 5a were moderate interglacial periods; MIS 4 is a moderate glacial period with medium-low temperatures; and MIS 3 is a moderate return to near interglacial conditions with medium-high temperatures [33,138]. At PP5-6, glacial cycling influenced distance to coastline [44,139], the size of the Paleo-Agulhas plain and the presence of grazing ungulates [49] and C3 adapted animals [47], C3-C4 vegetation types [42], and raw material availability [113,128], with trickle-down effects on hunter-gatherer economic decision-making and adap-tation [67].Table 1summarizes the changing conditions at Pinnacle Point by MIS.
Distance to coastline. Glacial conditions in the Pleistocene resulted in lower sea levels
across the South Coast of South Africa. Because of the broad, shallow continental shelf of the shores near PP5-6, a small change in sea level there resulted in large changes in the landscape. At some points in the 40 thousand years of Late Pleistocene represented at PP5-6 the coastline was as much as 30 km away [44]. This distance is beyond the normal daily foraging radius of a hunter-gatherer group as documented in modern ethnography. A typical one day roundtrip for hunter-gatherers rarely exceeds 15–30 km [141–143]. Half of this average roundtrip, 8–15 km, represents the daily foraging radius. During the PP5-6 MIS 5 phase of occupation, the coastline was near to site, with a minimum modeled distance of 0.8 km to a maximum modeled distance of
4.1 km [43]. During MIS 4, the coastline was usually far from site, with the mean distances rang-ing from 10.7 km to 20.7 km at the StratAgg-scale. The minimum modeled distance durrang-ing MIS 4 is 1.7 km and the maximum distance is 30.0 km [43]. During MIS 3, the coastline was on average 10.1–11.6 km away, with a minimum distance of 7.8 km and a maximum distance of 14.4 km.
Fig 1provides a simplified representation of mean distance to coastline at the MIS-scale. To summarize, the coast was always within the daily foraging radius of hunter-gatherers during MIS 5. The coast was generally far, and outside this radius during MIS 4, but distance to coast-line fluctuated through this period. The coast was a moderate distance from site in MIS 3, with mean values sitting within the ~8–15 km threshold for hunter-gatherer daily foraging radius. Based on multibeam bathymetry and side-scan sonar, a low-relief ‘plains’ landscape occurred between PP5-6 and the coastline when sea levels were lower than present day [140]. Offshore quartzite outcrops and shelf sand would have provided the substrate for both sandy and rocky shorelines during times of lowered sea-level [140]. Different resources would have been avail-able depending on sea level–coastal and terrestrial resources when the sea was close, and potentially more terrestrial resources when the sea was more than 10 km away. In general, PP5-6 was positioned for the exploitation of both coastal and terrestrial resources in MIS 5, but for the exploitation of more terrestrial resources in MIS 4 and MIS 3. During MIS 3, the coast was within the daily foraging radius. When exposed during MIS 4 and MIS 3, the wide Paleo-Agulhas Plain probably supported large migratory ungulate populations [77,78] that did not migrate north in to the interior [49]. Dense shellfish remains at PP5-6 in some MIS 4 levels indicate the coastal resources still played a significant role in the adaptive system during those periods, and that these may correlate to short transgressions.
C3-C4 vegetation types. Carbon isotope (δ13C) records from speleothems at Crevice Cave have been interpreted to indicate changing amounts of C4grass in the immediate area.
For most of MIS 5, input from C4grass is interpreted to be minor and consistent with the
strongly C3shrubby fynbos vegetation that occurs along the coast today. At the end of MIS 5,
there is an increase in the amount of C4grasses at Pinnacle Point, probably in response to
increased summer rains [42]. During this period, sea levels were retreating, the low-relief Agulhas Bank was exposed [140], and vegetation in the area around Pinnacle Point was likely grassy fynbos, and possibly sub-tropical thicket [42]. Hunter-gatherers using and discarding lithic material at PP5-6 were more inland, and occupying a different environment with a broader plain between PP5-6 and the ocean. Through roughly the first half of MIS 4, theδ13
C carbon isotope record indicates instability. After ~64 ka, C4grasses are common again. There
is variability within each MIS, but at the coarsest scale, MIS 5 is characterized by a stronger C3
Table 1. Summary of changing environmental conditions at Pinnacle Point at the scale of MIS. MIS Glacial/Interglacial
[33,138])
Mean coastline distance
Rainfall seasonality and vegetation type
Faunal communities Temporal patterning
MIS 3 moderate interglacial conditions ~8 km (3.2 km bootstrapped 95% CI)
winter rainfall increased accompanied by C3 vegetation [42] MIS 4 moderate glacial conditions ~15 km away (5.3 km bootstrapped 95% CI)
summer rain increased accompanied by an increased frequency of C4 grasses [42]
potential migratory ungulate communities appeared on this exposed coastal plain and seemingly did not migrate north into the interior proper [49]
the first half of MIS 4 indicates vegetation instability, whereas after ~64 ka, C4 grasses stabilized and became common [42] MIS
5
strong (5e) and moderate interglacial conditions (5a-d)
~1.4 km (0.4 km bootstrapped 95% CI) away from current position [44]
winter-rainfall dominated accompanied by C3 dominant shrubby fynbos [42]
C3-adapted animals [47] towards the end of MIS5 (5a) the frequency of C4 grasses increased [42], while the sea level retreated exposing the low-relief offshore coastal plain [140]
signal and MIS 4 by a relatively stronger C4signal. The Crevice record ends at 53 ka, and
there-fore does not cover the entirety of MIS 3. However, for the first 7 ka the Crevice Cave record suggests a return to more C3conditions with a drop in summer rain.
Fig 1. Simplified model of raw material availabilities based on current outcrop locations and mean modelled coastline distance for each MIS [43,
44]. The dispersed distribution of quartz is represented by the light green shade in the background. Each grid square is 5 km x 5 km. The uppermost row of stacked bar graphs present the relative frequencies of each raw material type within each MIS. The lower rows of stacked bar graphs present the relative frequency of cobble and outcrop cortex for each raw material type. Only quartzite and silcrete showed a significant association between cortex type and MIS (Table E inS1 Dataset).
There is significant correlation between the nearby Crevice Caveδ13C carbon isotopes and the types of raw materials discarded at PP5-6 [42,113]. Peaks in silcrete frequency during the SADBS and DBCS (MIS 4) at PP5-6 correspond to modeled spikes in C4vegetation. It has
been suggested that changing raw material frequencies could represent different mobility strat-egies in response to different environmental conditions [113] and/or different availabilities of wood fuel required for heat treating silcrete [67,116]. The increased sample sizes reported here permit us to further investigate the pattern reported by Bar-Matthews et al. [42] and Brown [113]. Specifically, this analysis expands on the portions of the MIS 4 PP5-6 sequence between ~69 and 64 ka, and on the earlier part of the MIS 5 occupation ~89 ka.
Raw material availability. Glacial cycling at PP5-6 likely had an impact on raw material
availability (Table 2,Fig 1). Today, quartzite is the most abundant material near PP5-6 suitable for knapping, but good quality quartzite may not always have been as readily available in the past. The Pinnacle Point caves occur in Skurweberg quartzitic sandstone; however most of this material is coarse-grained and does not fracture conchoidally. The quartzite lithic artifacts at PP5-6 are not manufactured on this material. Water-worn quartzite cobbles are abundant in Eden Bay, directly adjacent to PP5-6, but these derive primarily from the Skurweberg Forma-tion, which is not ideal for lithic reduction (page 81 in [113]). Better quality quartzite is avail-able at this nearby beach, but requires increased time investment to recover [113]. Cobble beaches at Dana Bay, located ~5 km west of Pinnacle Point, are also composed mainly of quartzite, and the material at these beaches are fine-grained and exhibit good potential for knapping. Quartzite cobbles are also available in the De Hoopvlei and Enon conglomerate for-mations, exposed today, respectively, at 5.5 km and 14 km away from Pinnacle Point, however, there may be other Enon conglomerate exposures closer to PP5-6 (page 215 in [144]). Primary sources of good quality quartzite of the Robberg Formation are available at Cape St. Blaize, 6.4 km from Pinnacle Point.
Today, and during past interglacial conditions when sea levels were high, the cobble beaches near PP5-6 are continuously refreshed with new cobbles. During past glacial condi-tions, when sea levels were low, such as during MIS 4, the cobbles in these beaches would have experienced no turnover and may have even been covered by sediment [77,113,128]. If the cobble bed was visible, hunter-gatherers exploiting these patches of raw material would have quickly depleted the best quality nodules and there would be no ocean currents replenishing the raw material source. However, the rate of such depletion is not yet known. Rocky shore-lines at the new coastline would have been a source for quartzite cobbles during lowered sea levels [140], but these sources would have been up to 30 km away [44].
Silcrete is rarer in the immediate vicinity of Pinnacle Point today. The nearest known pri-mary source of silcrete is 8.5 km northwest of the site at Rietvlei (pages 77, 80 in [113]). How-ever, it remains possible that there is a primary source of silcrete closer to Pinnacle Point currently submerged that may have been exposed when sea levels are low [113]. Silcrete
Table 2. Summary of minimum distances to different raw material types in each MIS. Secondary sources (cobbles) depend on modeled sea levels [43, 44]. The distance for primary sources (outcrops) is presented under the assumption that lowered sea levels did not expose good quality outcrops.
Silcrete Quartzite Quartz Chert/chalcedony
Primary Secondary Primary Secondary Primary Secondary Primary Secondary
MIS 3
8.5 km 8–14 km, depending on sea level (mean range 10–11 km)
6 km 8–14 km, depending on sea level (mean range 10–11 km)
<5 km <5 km >100 km
8–14 km, depending on sea level (mean range 10–11 km) MIS
4
8.5 km 5–30 km, depending on sea level (mean range 10–20 km)
6 km 5–30 km, depending on sea level (mean range 10–20 km)
<5 km <5 km >100 km
5–30 km, depending on sea level (mean range 10–20 km) MIS 5 8.5 km <5 km 6 km <5 km <5 km <5 km >100 km <5 km https://doi.org/10.1371/journal.pone.0174051.t002
nodules have been encountered in very low frequencies (~1%) at Dana Bay about 5 km from Pinnacle Point (page 81 in [113]). It is possible the silcrete is or was also available as nodules at Eden Bay immediately adjacent to the Pinnacle Point sites due to water currents transporting materials from the Gouritz River Mouth east along the coastline. Further quantitative survey at Eden Bay is required to establish the availability of silcrete nodules there. In any case, silcrete foraging requires a significant increase in time-investment or transport compared to quartzite under current environmental conditions.
Quartz has a broad distribution. It is available in seams within the Skurweberg quartzitic sandstone [144], and is available as small nodules at secondary sources; 4% small quartz nod-ules were recovered at Eden Bay during a quantitative survey [144]. Surveys have also found that angular quartz nodules are associated with the primary silcrete sources nearest to Pinnacle Point [113].
Other raw material types are rare and only known at the local scale from secondary sources. Hornfels nodules have been recovered in low frequencies (4%) at Dana Bay about 5 km from Pinnacle Point [113]. Cherts and chalcedonies have been recovered from river beds and con-glomerates at Hartenbos ~17 km from Pinnacle Point [144]. The Gouritz River (~30 km away) would be another likely source for chert nodules. The Gouritz and its tributaries cut through primary sources of chert in the southern Karoo Basin more than 100 km away [113]. This river also carries chert nodules to the coastline where they can be transported by water currents to cobble beaches near Pinnacle Point [113]. Chert nodules were recovered from Kanon Beach just east of the Gouritz River Mouth about 28 km from Pinnacle Point.
Brown [113] hypothesized that changes in the kinds of raw material used at PP5-6 could be in part explained by distance to coastline. When the coastline was near, similar to the condi-tions today, there would be greater use of local quartzite and more artifacts with water-worn cobble cortex. In contrast, when the coastline was distant, raw material foraging strategies would shift to primary sources, particularly silcrete, because cobble beaches were no longer rejuvenated with new cobbles. Initial investigation of the PP5-6 assemblage provided some support for this hypothesis [113]; secondary sources of quartzite were more frequently ex-ploited during the LBSR when sea levels are modelled to be high [44], and primary sources of silcrete were more frequently exploited during the SADBS, when sea levels are modelled to be lower. However, the hypothesis is not supported by raw material types in the OBS and SGS when sea level regression peaks. During the OBS and SGS, silcrete frequency is lower than the SADBS, and the frequency of small cobbles of quartz and chert increases [113]. Furthermore, during the DBCS and RBSR, when sea levels where lower than today, there is a high frequency of water-worn cobble cortex. The results presented here, which increase the sample sizes, and occurs at a different scale of analysis (i.e., MIS) permits further consideration of the raw mate-rial and coastline distance hypothesis.
Sample selection and methods
Multiple scales of analysis are possible for the PP5-6 lithic artifacts. Analysis can occur at the level of MIS, technocomplex, geological StratAgg, the more specific Sub-aggregate, or smaller, at the level of the plotted artifact within a Stratigraphic Unit. The maximum amount of behav-ioral information will come from conducting analyses at each of these multiple scales [118,
123,145]. This first overall analysis of the assemblage examines variation mainly at the largest scale–MIS.
MIS-scale analysis is appropriate for the first large scale of analysis for the PP5-6 technolog-ical sequence for three main reasons. First, there is a precedent for making interpretations about MSA behavioral variability at the scale of glacial periods or MIS as summarized above
(e.g. [15,35,43,51,54,79–81,83,84,87]) and conducting analyses at the MIS scale permits us to quantitatively test those previously put forth hypotheses. Second, as a coarse-grained cli-matic framework, MIS is the appropriate framework for testing hypotheses about coarse-grained, long-term, time-averaged behavioral responses to paleoenvironmental change, which is the focus or this investigation. Lastly, this MIS-scale analysis is conducted independently from traditional culture-historic designations (e.g., MSA II, HP, MSA III etc.), and does not makea priori assumptions about the structure of the lithic technological variability. Because
our question is about the influence of glacial cycling on human technological behaviors, we have chosen not to impose a techno-typological framework at this stage.
The technocomplex concept is problematic for many reasons [146], and is an inappropriate scale of analysis to use here because lithic technological traits can independently vary in re-sponse to different factors. For example, while the HP technocomplex is characterized by high frequencies of backed pieces, an emphasis on blade production and the use of fine-grained raw materials, each of these variables can change at different times and in response to different fac-tors. Likewise, one cannot use any trait alone to identify a technocomplex; for example, bifacial points in MSA assemblages are often equated with the SB, but low frequencies of bifacial points come and go through the MSA [118]. When analyses are carried out at the technocomplex scale there is an untested assumption that all the changes in the multiple traits that characterize the technocomplex are coeval and influenced by the same processes. Some recent investiga-tions have found no association between the appearance of new MSA technocomplexes and environment [95,121–123]. However, those studies did not test for an association between individual lithic assemblage traits and environmental change, and in that way their methodol-ogies differ significantly from ours.
Importantly, it isnot our goal here to establish what factors best explain all the variability at
6. Nor are we testing whether environment or MIS best explain all the variability at PP5-6, or the appearance of new MSA technocomplexes. The goal is to identifying which,if any,
individual lithic assemblage traits are associated with MIS. Because lithic assemblage traits are proxies for reduction stage, flaking efficiency, reduction strategy, percussion technique, and tool function they inform us on how higher-level hunter-gatherer behavioral traits associate with MIS, such as demography, provisioning, and mobility strategies. At the MIS-scale, lithic assemblage traits tell us how early modern humans responded on a large, time-averaged scale to major environmental change. Traits that do not associate with MIS have potential to inform of us on other factors that influence technological change, including socio-cultural ones.
The MIS-scale analysis carried out here has two main limitations. First, because it aggre-gates data, it necessarily leads to the homogenization of data and masks internal variability. Second, the PP5-6 sequence contains only one glacial period, MIS 4 with no other glacial period comparison, so the extent to which the results apply to other glacial periods cannot be assessed using this dataset. For the reasons highlighted above, MIS-scale analysis is still appro-priate for addressing our questions about the influence of glacial conditions on Pleistocene technological behaviors. The strength of our approach is that it identifies which lithic assem-blage traits demonstrate a cyclical pattern, allowing us to consider human dynamics before, during, and after a glacial period. Analyses at other scales and including sequences from MIS 6 and 2 contexts are forthcoming.
Lithic analysis
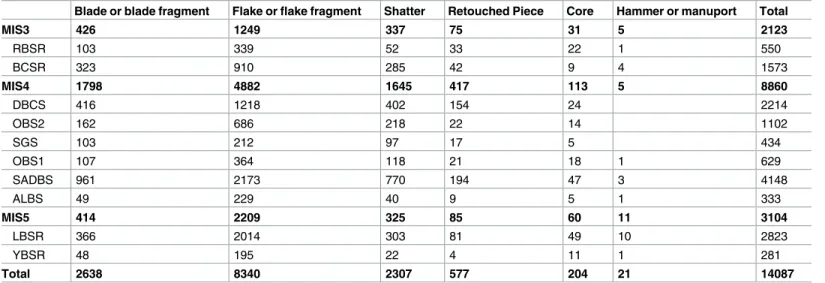
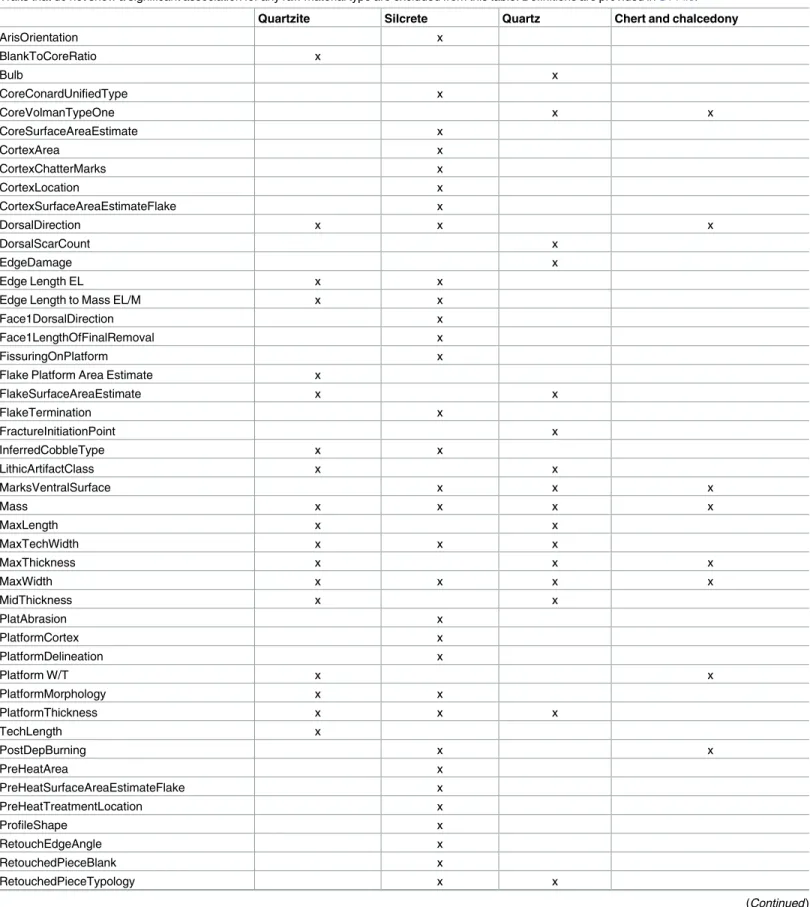
The PP5-6 lithic artifacts were examined by five lithic analysts (JW, KR, BJS, SO, TP) in 2013. The total analyzed sample is more than 14 000 artifacts (Table 3). The team represents different backgrounds and experiences with respect to lithic analysis, and is in line with the goal of
optimizing the potential for identifying significant temporal variation and for maximizing comparability with other lithic assemblages in South Africa, East Africa, and Europe. Multi-analyst teams are rare in lithic studies, and we think this approach helps reduce person-specific bias and contributes positively to the reliability of our data set. The methods of analysis were designed to build upon and complement the analyses of Brown [12,22,113], who had already examined a sample of ~8000 lithic artifacts from the PP5-6 Long Section. We recorded many of the traits used by Brown (2011) so that the two sets of databases could be combined, and then an additional set of traits that expands the range of possible inter-site comparisons and research questions were documented during the Oct-Nov 2013 season. Our method incorporates traits and typological identifications from multiple sources, including published reports by Villa et al. [106] and Wurz [147,148] at Klasies River, Wadley [149–151] and Villa et al. [115,152] at Sibudu, Wadley and Harper [153] and Soriano et al. [108] at Rose Cottage Cave, and Porraz et al. [107] at Diepkloof. A total of 93 different attributes were recorded, which included metric traits such as length, width, and thickness, technologically-relevant traits such as dorsal scar pat-tern and number of platform scars, and functionally-relevant traits such as presence of “diag-nostic impact fractures”. A complete list of recorded traits and definitions is available inS1 File. For analysis some trait categories were lumped together (e.g., ‘small lip’ and ‘large lip’ lumped as ‘lipped’). Many recorded metric traits were converted into technological-relevant ratios (e.g., technological length/technological maximum width), which are indicated inS1 File.
The total assemblage analyzed amounts to 47% of the plotted lithic assemblage from the PP5-6 Long Section as of 2013 and includes a robust sample from each of the StratAggs and MIS (Table 3). Selection for analysis occurred at the level of the Lot; Lots were selected for analysis in a manner that maximized vertical coverage through the excavation. All plotted finds within an analyzed Lot were examined without a size cut-off, except for cases where the number of artifacts within a Lot was too large and random sampling was required, or when the Lot had been excavated with residue analysis protocol with powder free latex gloves. In the latter cases, a random sample (20%) was preserved for residue analysis.
Analyzed artifacts were washed using an ultrasonic cleaner and soft bristle brush. Those with concreted adhesions were treated with a commercial calcium remover.
Open source software (E4,http://www.oldstoneage.com/software/e4.shtml) was used for data entry. This program, developed by Shannon McPherron and Harold Dibble, is designed
Table 3. Summary of analyzed sample from PP5-6.
Blade or blade fragment Flake or flake fragment Shatter Retouched Piece Core Hammer or manuport Total
MIS3 426 1249 337 75 31 5 2123 RBSR 103 339 52 33 22 1 550 BCSR 323 910 285 42 9 4 1573 MIS4 1798 4882 1645 417 113 5 8860 DBCS 416 1218 402 154 24 2214 OBS2 162 686 218 22 14 1102 SGS 103 212 97 17 5 434 OBS1 107 364 118 21 18 1 629 SADBS 961 2173 770 194 47 3 4148 ALBS 49 229 40 9 5 1 333 MIS5 414 2209 325 85 60 11 3104 LBSR 366 2014 303 81 49 10 2823 YBSR 48 195 22 4 11 1 281 Total 2638 8340 2307 577 204 21 14087 https://doi.org/10.1371/journal.pone.0174051.t003
to reduce analysis time and to minimize data entry errors. The complete E4 code we developed is available inS1 File.
Raw data, including all specimen numbers, are included inS2 Dataset. All materials are cur-rently housed at the Munro House, Dias Museum, Mossel Bay, South Africa. Once all analyses are complete, the material will be permanently housed at the Iziko South Africa Museum, Cape Town, South Africa. The permit to carry out the work presented here was granted by Heritage Western Cape (1402103TS0225M).
Statistical analysis
All recorded lithic attributes were included in a statistical analysis comparing the three MIS. The analysis was conducted with noa priori predictions of which traits would be influenced by
glacial cycling or how. Raw material type was analyzed first, and then frequencies and means of the lithic attributes were calculated for each raw material type (quartzite, silcrete, quartz, and chert/chalcedony) separately. Chert and chalcedony were lumped because of their similar distribution and availability on the landscape near PP5-6, and the difficulties distinguishing between them based on visible characteristics alone [154].
The two different data types in the PP5-6 lithic database–categorical and numerical—were necessarily analyzed differently. Categorical traits such as platform type, dorsal scar direction, and retouched piece typology, were examined via contingency tables and Chi2or Fisher exact test for small samples. Multivariate traits were examined further using correspondence analy-sis. Numerical traits were examined by using the non-parametric pairwise Wilcoxon test to compare means. All tests were conducted using JMP 11 software.
We propose that a trait that represents a behavioral response to MIS 4 glacial conditions should be more alike before and after MIS 4 than during it. If there is an explanatory associa-tion between interglacial-glacial cycles and a given trait, then we expect the following: 1. A significant association between MIS and the trait;
2. MIS 4 different from MIS 5 and MIS 3;
3. The change in values from MIS 5 to 4 and MIS 4 to 3 occurs inversely. For example, if the frequency of a particular trait increases from MIS 5 to 4, then it should decrease from MIS 4 to 3
Categorical data. Trait frequencies for each MIS and comparison statistics are provided
in Tables D -E inS1 Dataset. A Pearson Chi2test was used to determine whether the distribu-tion of the trait is the same across each MIS. When the contingency table had cells with a count of less than five, a Fisher’s Exact Test was conducted. A trait was determined to have a positive association with MIS when p<0.05. For each of those cases, the temporal trend exhib-ited by the variability was characterized based on the following criteria and indicated in Table E inS1 Dataset:
1. Glacial cycling—MIS 4 exhibits higher or lower frequencies compared to MIS 3 and 5; 2. Threshold MIS 4—MIS 5 exhibits the highest or lowest frequency, MIS 3 and 4 exhibit
simi-lar frequencies;
3. Threshold MIS 3—MIS 3 exhibits the highest or lowest frequency, MIS 4 and 5 exhibit simi-lar frequencies;
4. Temporally-vectored—the trait frequency increases or decreases through time (e.g. MIS 5>MIS 4>MIS 3);
5. Other—there is change through time, but the change does not fit one of the above pat-terns–usually for multivariate traits where the three MIS plot far from each other on multi-ple axes (see below).
Correspondence analysis was carried out for multivariate categorical data that exhibited a significant association with MIS (Tables F-H inS1 Dataset, Figs A-D inS2 File). Correspon-dence analysis is a PCA-type multivariate analysis for count data and is used by archaeologists to compare assemblages in terms of the representation of different artifact types [155,156]. Correspondence analysis calculates the eigenvalues and eigenvectors of a matrix containing the Chi2distances between all rows. Traits that are strongly associated with MIS will exhibit large absolute eigenvectors, and traits typical for an association with a particular MIS will plot in the vicinity of that association. Traits strongly associated with glacial cycling will exhibit large absolute eigenvectors on the axis that exhibits the most separation of MIS 4 from MIS 5 and 3.
Numerical data. Mean values for each MIS and comparison statistics are provided in
Tables I-J inS1 Dataset. Means were compared using the nonparametric Wilcoxon Each Pair test. For each case, the temporal trend exhibited by the variability was characterized based on the following criteria and indicated in Table J inS1 Dataset:
1. Glacial cycling—MIS 4 exhibits significantly higher or lower means compared to MIS 3 and 5, MIS 3 and 5 means not significantly different, or the size of the effect is very small; 2. Threshold MIS 4—MIS 5 exhibits the highest or lowest mean and is significantly different
from both MIS 3 and MIS 4, MIS 3 and 4 exhibit similar means that are not significantly different;
3. Threshold MIS 3—MIS 3 exhibits the highest or lowest mean and is significantly different from both MIS 4 and MIS 5, MIS 4 and 5 exhibit similar means that are not significantly different;
4. Temporally-vectored—the means are significantly different and they increase or decrease through time (e.g., MIS 5 > MIS 4 > MIS 3).
MIS-scale values
Two additional values were calculated at the MIS scale–estimated nodule size and blank to core ratio (Tables K-L inS1 Dataset). Nodule size is estimated based on the maximum dimen-sions of flakes and cores within each MIS, with the minimum representing the maximum dimension minus 10% and the max representing that dimension plus 20% (page 223 in [113]). Blank to core ratio was calculated by dividing the number of complete and proximal flakes and blades by the number of cores.
Explanation of variability
The above analyses resulted in a summary results table linking each lithic artifact trait for each raw material type with a temporal trend (i.e., glacial cycling, threshold MIS 4, threshold MIS 3, temporally-vectored, other, or no significant association, Tables E and J inS1 Dataset). A Chi2 test and correspondence analysis, as described above, were used to test for association and visualize the relationship between raw material and the frequency of traits linked to glacial cycling.
Each trait was also linked to a higher-level behavioral interpretation. For example, cortex amount is often used as an indicator for reduction stage and/or intensity (e.g. [134,157]).
Here, we use the term ‘reduction stage’ to identify which portions of the reduction sequence are represented. Early stages of core reduction such as decortification and preliminary core shaping often produce different kinds of by-products than later stages, such as the ‘optimal’ blade production phase (sensu [108]), core rejuvenation and maintenance. The term ‘reduc-tion intensity’ refers to the use-life of a tool or core–how thoroughly it is knapped or used before it is discarded. The reason reduction intensity and stage have to be lumped for many traits is that if reduction intensity is high, there will be proportionally more products from later stages.
Edge length to mass ratio is used as a proxy for flaking efficiency (e.g. [111,158]). Here, flaking efficiency refers to the degree to which the cutting edge is maximized for the amount of raw material used [102,111,132,133,158–162] before retouch (c.f. [163]). It is not referring to the maximization of useable blanks [164] or functional efficiency. We measured efficiency directly using edge length to mass ratio, and indirectly by studying proxies associated with blade production, such as bidirectional scar pattern and frequency of cores with parallel re-movals. Platform thickness is an example used as a proxy here for percussion technique (e.g. [106,108,117]), where percussion technique refers to the manner with which flakes and blades are detached from stone cores, employing direct or indirect percussion or pressure, using hard or soft percussors and marginal or invasive percussion. A list of each behavioral interpretation with references and explanation is provided in Table M inS1 Dataset. By assigning each trait to a single higher-level behavioral interpretation, we are able to offer hypotheses for the tempo-ral variability related to glacial cycling, and explore differences between raw material types using the same statistical tests described above. The behavioral interpretations we assign are generalizations, are not necessarily mutually exclusive, and there are sometimes interpretive contradictions, but as a combined dataset they provide a means for quantitatively exploring possible drivers of lithic variability through time at PP5-6.
Intra-MIS variability
MIS are not homogenous. Nor are the lithic assemblage traits within each MIS. To address intra-MIS variability, seven key traits that exhibited a significant relationship with MIS and a pattern consistent with glacial cycling were examined at the smallest possible scale. Individual plotted find coordinates were displayed in ArcGIS to observe how variability is distributed across the whole PP5-6 sequence, and to visually evaluate the degree and nature of that vari-ability. Relative point density maps for each of the key traits were generated based on point elevation.
Results
Descriptive and comparative statistics for all recorded traits are available in Tables A-O inS1 Dataset. Correspondence plots are also presented in Figs A-D inS2 File. Results are summa-rized here in Figs1–5, and Tables3–5. Additional intra-MIS variability plots are available in the Figs E-K inS3 File.
Raw material type
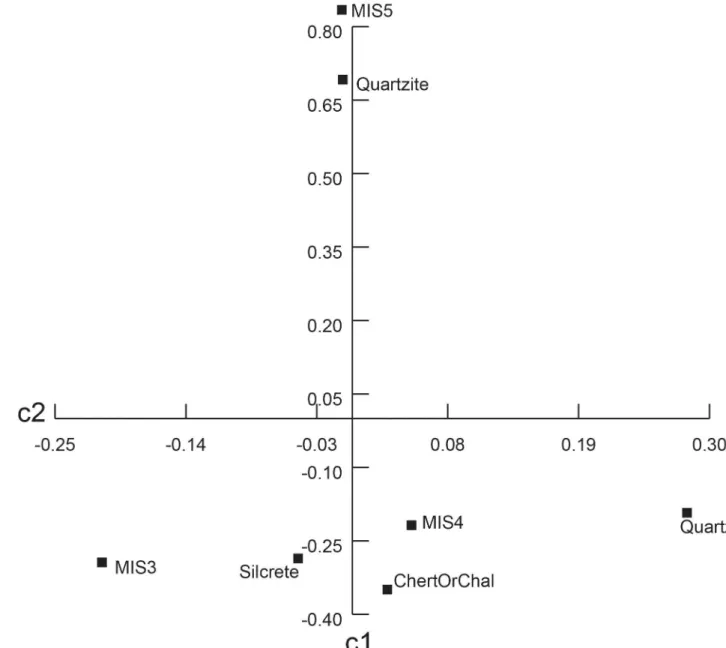
There is a significant association between raw material type and MIS (Pearson Chi2= 2815, p<0.001). Silcrete and chert/chalcedony frequencies are high in MIS 4 and MIS 3, whereas quartzite frequency is high in MIS 5. Based on correspondence analysis, the main trend of vari-ation for raw material type on axis 1, which explains 96% of the total varivari-ation (Table C inS1 Dataset), runs from high quartzite frequencies associated with MIS 5 and high silcrete and chert/chalcedony frequencies associated with MIS 3 and 4 (Fig 2). The quartz dimension
makes a small contribution to the difference between the glacial (MIS 4) and interglacial (MIS 3 and 5) periods on axis 2. Only quartz shows similar frequencies in MIS 3 (4.4%, n = 91) and 5 (5.6%, n = 168) that differ from the frequency in MIS 4 (11.5%, n = 1008). In other words, only quartz frequency exhibits a pattern consistent with a glacial cycling effect. During the gla-cial period, there was overall an increased frequency of quartz use compared to the interglagla-cial periods, and other raw material types do not fit this pattern.
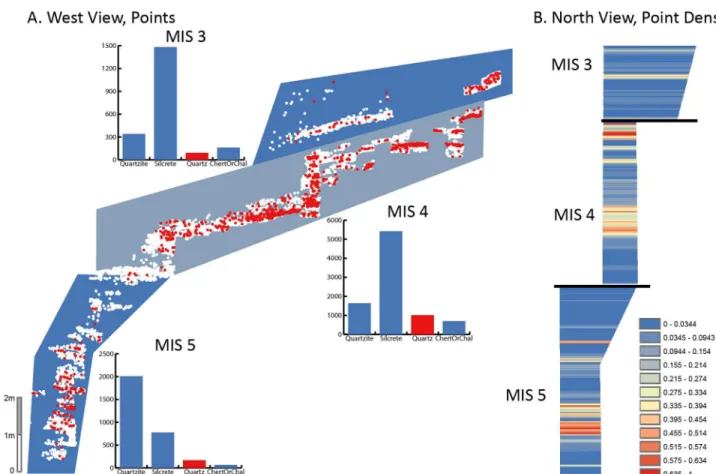
A consideration of the vertical variability through the PP5-6 sequence demonstrates that quartz frequency fluctuated through time. There are periods during MIS 4 when quartz fre-quency was low, and periods during MIS 5 and 3 when quartz frefre-quency was high; however, during MIS 4 there are longer stretches of the sequence with 16% or more quartz and several pulses with 40% or more (Fig 3).
Fig 2. Correspondence plot of raw material types by MIS. c1 explains 96% of variation. c2 explains 4% of variation. Pearson Chi2= 2815, p<0.001.
Lithic attributes
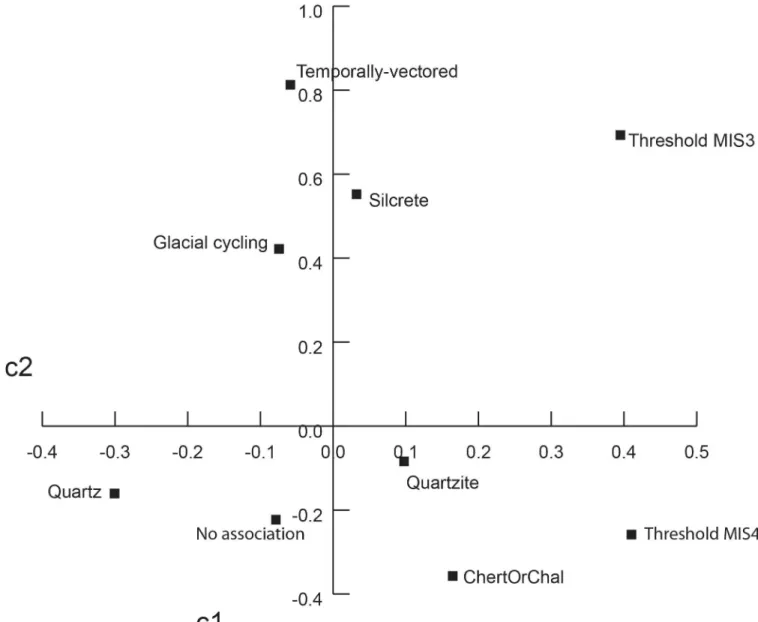
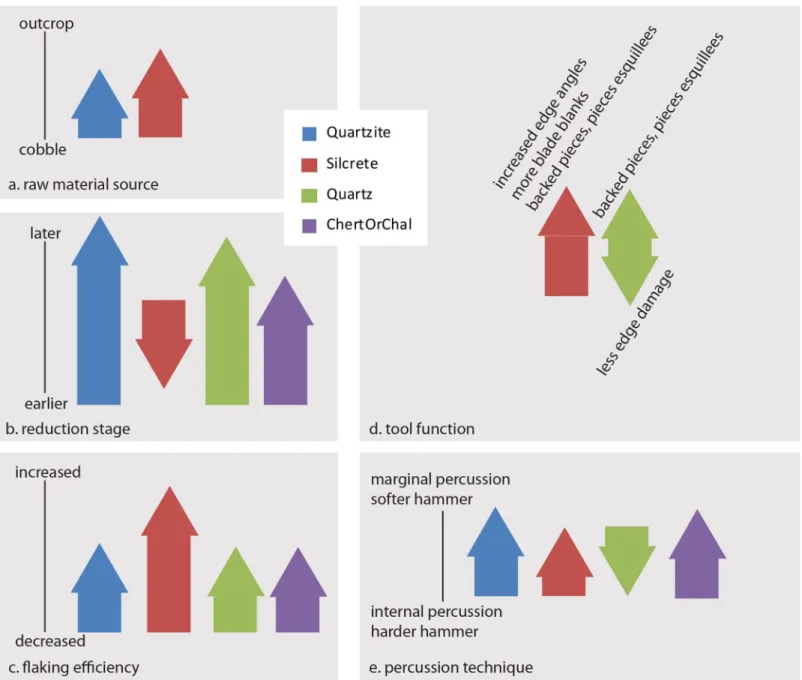
Table 4lists all attributes by raw material type that exhibit temporal change consistent with an effect from glacial cycling. The traits that exhibit other types of temporal change can be found in theS1 Dataset, and are not discussed further here. For quartzite, 22% (n = 18) of traits show variability consistent with glacial cycling, 39% (n = 35) for silcrete, 22% (n = 18) for quartz, and 11% (n = 9) for chert/chalcedony. Silcrete exhibits the highest frequency of traits that show a pattern consistent with an effect from glacial cycling. There is a significant association between the frequency of different temporal trends and raw material (Pearson Chi2= 51.5, p =
<0.0001). On a correspondence plot (Fig 4, Table N inS1 Dataset), silcrete, glacial cycling, temporally-vectored, and threshold MIS 3 associate on one end of axis 1, which explains 78% of the variability, while quartzite, chert, quartz, no association, and threshold MIS 4 associate on the other end of axis 1. At PP5-6, silcrete was treated differently during the glacial occupa-tion (MIS 4) than it was during the interglacial occupaoccupa-tions (MIS 3 and 5). All raw material types were affected by glacial cycling to some extent, however, silcrete exhibits significantly more traits influenced by glacial cycling.
Fig 3. Vertical distribution of quartz frequency at PP5-6. When lumped by MIS stage, relative quartz frequency is highest in MIS 4, though there is variability through the sequence. A. West view of PP5-6 lithic artifact plotted find X,Y,Z coordinates. MIS boundaries indicated by blue bounded areas are defined based on the mean OSL age estimate within StratAggs. Red points are quartz lithic artifacts, white points are lithic artifacts in other raw material types. Bar plots indicate frequency counts of raw material types and MIS. B. Relative point density map of north view of PP5-6 quartz lithic artifact plotted finds generated in ArcMap using the rectangular neighborhood option and based on point elevation. Classes defined based on 1/3 standard deviation. Because some of the deposits dating to late MIS 4 and early MIS 3 overlap with respect to elevation (Z), the MIS 3 relative density map was generated separately from the rest of the sequence and is depicted above the MIS 4 deposits in the point density column.
The lithic artifact traits are proxies for a number of behaviors: changing raw material sources, reduction stage and/or intensity, flaking efficiency, tool function, and percussion technique (Table M inS1 Dataset). With a couple of exceptions discussed further below, most behavioral interpretations are represented at least once within each raw material type category (Fig 5, Table O inS1 Dataset). And, for the traits that show a pattern consistent with an effect from glacial cycling, there is no significant association between raw material type and behav-ioral interpretation (Fisher’s Exact Test, p = 1.000, each of four tests). In other words, hunter-gatherers occupying PP5-6 altered the way they treated quartzite in multiple ways, which included shifts in changing raw material sources, reduction stage, flaking efficiency, tool func-tion, and percussion technique. The same is true for every other raw material type. However, in some cases the nature and direction of these changing treatments differs between the raw material types (Fig 5), as discussed further below.
Fig 4. Correspondence plot of raw material types by temporal trend. c1 explains 78% of variation. c2 explains 27% of variation. Pearson Chi2
= 51.5, p =<0.0001.
![Fig 1. Simplified model of raw material availabilities based on current outcrop locations and mean modelled coastline distance for each MIS [43, 44]](https://thumb-eu.123doks.com/thumbv2/123dok_br/18745228.921058/11.918.70.864.107.888/simplified-material-availabilities-current-locations-modelled-coastline-distance.webp)
![Table 2. Summary of minimum distances to different raw material types in each MIS. Secondary sources (cobbles) depend on modeled sea levels [43, 44]](https://thumb-eu.123doks.com/thumbv2/123dok_br/18745228.921058/12.918.53.863.908.1047/summary-minimum-distances-different-material-secondary-sources-cobbles.webp)