Engenharia
Experimental Study of a Single Droplet Impinging
upon Liquid Films: Jet Fuel and Biofuel Mixtures
(versão corrigida após defesa)
Daniela Filipa Santo Ribeiro
Dissertação para obtenção do Grau de Mestre em
Engenharia Aeronáutica
(ciclo de estudos integrado)
Orientador: Prof. Doutor André Resende Rodrigues da Silva
iii
Acknowledgments
First, I want to thank my supervisor, Dr. André Resende Rodrigues da Silva for believing in me and accepting to guide this work on such short notice. I am grateful for all the support, dedication, knowledge, guidance and availability.
I would like to acknowledge the opportunity to belong and collaborate in the activities of AeroG – Aeronautics and Astronautics Research Center, presided by Professor Jorge Manuel Martins Barata who unceasingly encourage the scientific research. I also like to thank my colleagues, especially Nuno Cunha.
I would like to take this opportunity to express my gratitude to the people who helped me to measure the physical properties of the substances, Dr. Sónia Sousa, Dr. Ilídio Correia, Dr. Adriana Sousa and also to the PhD student Sónia Miguel.
I would like to express my gratitude to the lab technician, Mr. Rui Manuel Tomé Paulo who always assisted me in building the experimental facility.
I would like to thank my friends who enriched my academic life and who always helped and supported me. Especially to Micael, who constantly encouraged me to put the better of me in everything I do.
Last, but not least I want to thank my parents since without their support, patience and dedication none of this could be possible and to my brother Samuel who can always inspire me to work harder.
v
Resumo
O presente trabalho foca-se no impacto de uma única gota com um filme de líquido do mesmo fluido. Este estudo particular tem interesse para várias áreas de pesquisa e tem uma grande variedade de aplicações tais como injeção de combustível em motores de combustão interna e processos que envolvem pintura a spray, revestimentos e arrefecimento de sistemas. O Ser Humano começou a procurar novas alternativas para reduzir a poluição e visto que os transportes contribuem com uma porção significativa é extremamente necessário apostar em alternativas aos combustíveis fósseis. A introdução de biocombustíveis no sector da aviação poderia ser um exemplo. O grande desafio passa então por modificar e otimizar motores a pistão de forma a operarem eficientemente com combustíveis alternativos. De forma a alcançar isso, nestes ensaios experimentais foram usadas misturas de Jet Fuel e Biocombustível. O principal objetivo desta dissertação é visualizar o comportamento dinâmico do impacto de gotas únicas com filmes de líquido com diferentes espessuras relativas, vários resultados são possíveis. Para o obter foram usados quatro fluidos: água (como referência), 100% Jet A-1 e misturas de 75%/25% e 50%/50% de Jet A-1 e NEXBTL, respetivamente, visto que na aviação civil só são aceites misturas com no mínimo 50% de Jet Fuel em volume. Para garantir cálculos precisos as propriedades físicas dos fluidos foram medidas.
Uma montagem experimental foi idealizada e construída. A instalação inclui uma câmara digital de alta velocidade que foi manualmente acionada com um tempo de exposição específico. O local de impacto foi iluminado por uma lâmpada led através de um vidro difusor de forma a fornecer uma luz uniforme de frente para a câmara. Uma bomba infusora foi conectada à agulha e libertava as gotas a uma taxa de bombeamento específica. Um recipiente de perspex conteve o filme de líquido. Foram utilizadas cinco agulhas com diâmetros internos diferentes para produzir cinco diâmetros de gota diferentes para cada fluido. Adicionalmente, foram estabelecidas três alturas de impacto para proporcionar três velocidades de impacto e três números de Weber para cada agulha. Foram consideradas espessuras do filme de líquido de 10%, 50% e 100% do diâmetro da gota.
A existência de splash foi reportada, assim como as suas características. Algumas conclusões sobre a influência das condições de impacto e das propriedades físicas das substâncias foram indicadas. Usando os dados obtidos foram feitas comparações com os limites de splashing disponíveis na literatura.
vi
Palavras-Chave
vii
Abstract
The present work is focused on a single droplet impinging upon a liquid film of the same fluid. This particular study is a matter of interest for several research areas and has a wide variety of applications such as fuel injection in internal combustion engines and processes involving spray paints, coatings and systems cooling. The human being started searching for new alternatives to reduce pollution, and since transports contribute with a significant portion, it is extremely necessary to bet on alternatives to fossil fuels. The introduction of biofuels in the aviation sector could be an example. The huge challenge is to modify and optimize piston engines to operate efficiently with alternative fuels. In order to achieve that, in these experiments, Jet Fuel and Biofuel mixtures were used.
The main goal of this dissertation is to visualize the dynamic behavior of single droplets impinging upon liquid films with different relative thicknesses, several outcomes are possible. To accomplish that, four fluids were used: water (as reference), 100% Jet A-1, 75%/25% and 50%/50% mixtures of Jet A-1 and NEXBTL, respectively, since civil aviation only accept mixtures with at least 50% Jet Fuel in volume. To assure the accuracy of the calculations, the fluids physical properties were measured.
An experimental facility was designed and built, and the setup includes a high-speed digital camera that was manually triggered with a specific exposure time. The impact site was illuminated by a led lamp through a diffusion glass to provide uniform back lighting. A syringe pump connected to the needle released the droplets with a specific pumping rate. The liquid film is held by a perspex container. Five needles were used with different inner diameters to yield five distinct droplet sizes for each fluid. Additionally, three impact heights were established to provide three impact velocities and Weber numbers for each needle. The liquid films depths considered were 10%, 50% and 100% of the droplet diameter.
The existence of splash was reported as well as its characteristics. Some conclusions about the influence of the impact conditions and the fluids physical properties were indicated. Using the obtained data comparisons were made with some splashing thresholds available in the literature.
Keywords
ix
Index
Acknowledgments ... iii Resumo ... v Abstract... vii List of Figures ... xi Nomenclature ... xvList of Acronyms ... xvii
1 Introduction ... 1
1.1 Motivation ... 1
1.2 Literature Review ... 2
1.2.1 Impingement Governing Parameters ... 2
1.2.2 Impact Regimes ... 4 1.2.3 Wetted Surfaces ... 7 1.2.4 Experiment’s Background ... 7 1.2.5 Splashing Thresholds ... 11 1.3 Objectives ... 16 1.4 Organization ... 16 2 Experimental Procedure ... 19 2.1 Experimental Arrangement ... 19 2.1.1 Image Acquisition ... 20 2.1.2 Impact Surface ... 20
2.1.3 Droplet Dispensing System ... 21
2.1.4 Impact Site Illumination ... 22
2.2 Characterization of the Fluid Properties ... 23
2.2.1 Density ... 23
2.2.2 Surface Tension ... 24
2.2.3 Viscosity ... 25
2.3 Work Methodology ... 26
2.4 Measurement Techniques and Methodologies to Process Data ... 27
2.4.1 Droplet Diameter ... 27
2.4.2 Impact Velocity ... 29
x
3 Results and Discussion ... 33
3.1 Impact Characterization ... 33
3.1.1 Droplet Diameter ... 33
3.1.2 Impact Velocity ... 36
3.1.3 Liquid Film Thickness and Dimensionless Numbers ... 38
3.2 Visualization ... 41
3.3 Outcomes ... 47
3.4 Splashing/Deposition Threshold ... 59
3.4.1 Bai and Gosman (1995) ... 59
3.4.2 Cossali et al. (1997) ... 60
3.4.3 Senda et al. (1997) ... 62
3.4.4 Vander Wal et al. (2006a) ... 63
3.4.5 Huang and Zhang (2008) ... 64
3.4.6 Summary ... 65
4 Conclusions and Future Work ... 67
4.1 Conclusions ... 67
4.2 Future Work ... 70
xi
List of Figures
Figure 1.1 Definition of the static contact angle by Rioboo et al. (2001): a) non-wetting
system; b) highly wetting system. ... 4
Figure 1.2 Impingement representation by Yarin and Weiss (1995): (a) splashing mechanism; (b) free rim and secondary droplets magnified. ... 4
Figure 1.3 Stick regime according to Bai and Gosman (1995). ... 5
Figure 1.4 Deposition regime according to Rioboo et al. (2001). ... 5
Figure 1.5 Prompt splash regime according to Rioboo et al. (2001). ... 5
Figure 1.6 Crown splash regime according to Rioboo et al. (2001). ... 6
Figure 1.7 Complete rebound regime according to Rioboo et al. (2001). ... 6
Figure 1.8 Partial rebound regime (or jetting) according to Rioboo et al. (2001). ... 6
Figure 1.9 Splash model and the coordinate system used by Macklin and Metaxas (1976). 8 Figure 2.1 Experimental Facility. ... 19
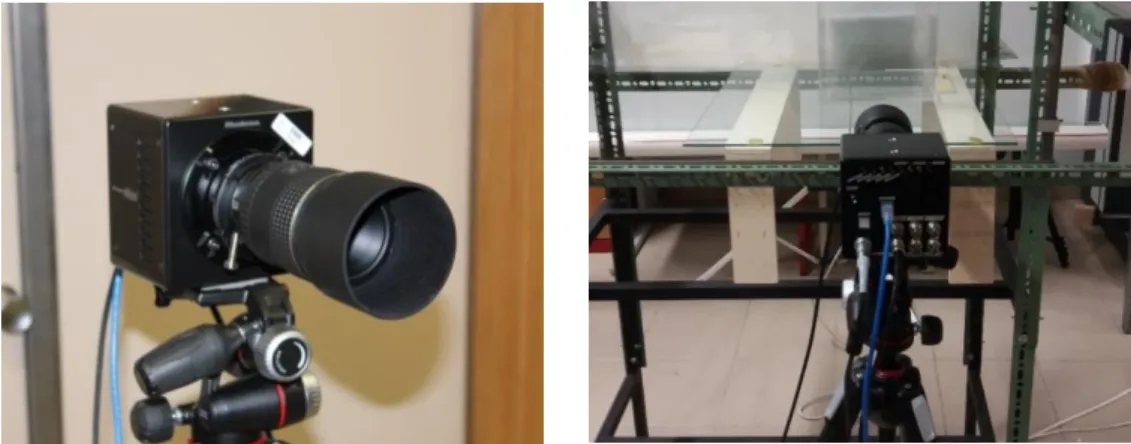
Figure 2.2 Photron FASTCAM mini UX 50 and the Macro Lens Tokina AT-X M100 AF PRO D. ... 20
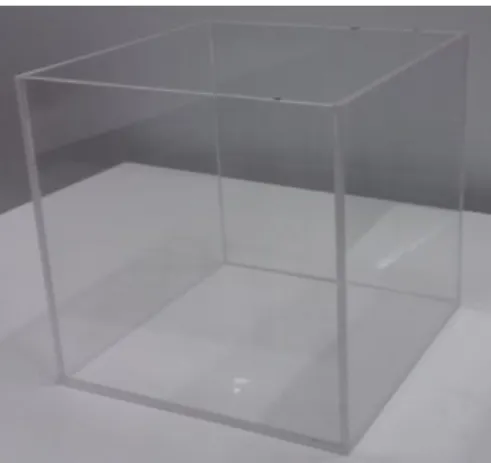
Figure 2.3 Perspex container 200x200x200mm. ... 21
Figure 2.4 Syringe Pump NE-1000. ... 21
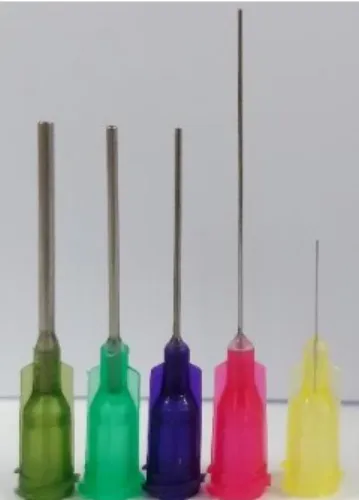
Figure 2.5 Stainless steel needles. Left to right the correspondent inner diameters are: 1.50mm, 0.84mm, 0.51mm, 0.25mm and 0.10mm. ... 22
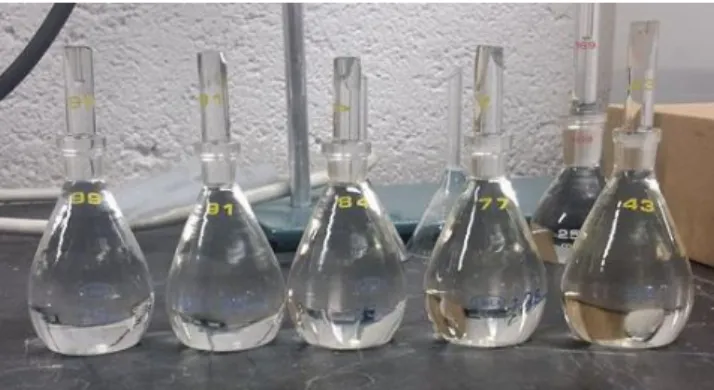
Figure 2. 6 The pycnometers with the different substances. Left to right: 100% Jet A-1, 75% Jet A-1 – 25% HVO, 50% Jet A-1 – 50% HVO, 25% Jet A-1 – 75% HVO and 100% HVO. ... 23
Figure 2.7 Data Physics – OCAH200 used to measure the surface tension. ... 24
Figure 2.8 Brookfield Rheometer with a cone and plate geometry for small samples. ... 25
Figure 2.9 On the left an image of the background and on the right an image with the droplet. ... 28
Figure 2.10 Data processing to obtain the droplet diameter: (a) Subtraction between the image of the droplet and the background; (b) Transformation into binary; (c) Fill the area within the droplet perimeter. ... 28
Figure 2.11 Assembly of five frames separated by 5ms to represent the shape-shifting of the falling droplet along the vertical fall. ... 29
xii
Figure 2.12 Assembly of two frames containing a droplet 5𝑚𝑠 before impact and the last one before impact. ... 30 Figure 2.13 Two frames used to calculate the impact velocity, both droplets with a black
cross that represents the droplet centroid. ... 30 Figure 2.14 Reference used to determine the pixel size 𝐷𝑜𝑢= 1.82𝑚𝑚. ... 31
Figure 3.1 Graphics comparing the measured droplet size to the theoretical droplet size: a) H2O; b) mixture of 50% Jet A-1 and 50% HVO; b) mixture of 75% Jet A-1 and 25% HVO; d) Jet A-1. ... 35 Figure 3.2 The difference between the droplet size according to the inner diameter of the
needle used to produce them: a) Din=1.50mm; b) Din=0.84mm; c)
Din=0.51mm; d) Din=0.25mm; e) Din=0.10mm. ... 36
Figure 3.3 Image sequences: a) the spreading of a single droplet in a liquid film for the 75% JF/25% HVO mixture (𝐷𝑖𝑛= 0.84𝑚𝑚, 𝐷0= 2.77𝑚𝑚, ℎ = 175𝑚𝑚, 𝛿∗= 1);
b) the fingering of a single droplet in a liquid film for the 75% JF/25% HVO mixture (𝐷𝑖𝑛= 0.51𝑚𝑚, 𝐷0= 2.47𝑚𝑚, ℎ = 175𝑚𝑚, 𝛿∗= 0.1). ... 42
Figure 3.4 Prompt splash of a single droplet in a liquid film for the 50% JF/50% HVO mixture (𝐷𝑖𝑛= 1.50𝑚𝑚, 𝐷0= 3.06𝑚𝑚, ℎ = 1𝑚, 𝛿∗= 0.1)... 43
Figure 3.5 Image sequences: a) crown splash of a single droplet in a liquid film for H2O
(𝐷𝑖𝑛= 0.51𝑚𝑚, 𝐷0= 3.23𝑚𝑚, ℎ = 1𝑚, 𝛿∗= 0.1∗); b) Jetting in a liquid film
for 100% JF (𝐷𝑖𝑛 = 1.50𝑚𝑚, 𝐷0= 3.04𝑚𝑚, ℎ = 175𝑚𝑚, 𝛿∗= 1). ... 44
Figure 3.6 Crown splash follow by bubbling for the 75% JF/25% HVO mixture (𝐷𝑖𝑛= 1.50𝑚𝑚, 𝐷0= 3.05𝑚𝑚, ℎ = 1𝑚, 𝛿∗= 0.5)... 47
Figure 3.7 Graphic comparing the study results with Bai and Gosman splashing threshold. ... 60 Figure 3.8 Graphics comparing the study results with Cossali et al. splashing threshold for
each fluid: a) H2O; b) 50%/50% mixture; b) 75%/25% mixture; d) 100% Jet A-1.
... 61 Figure 3.9 Graphics comparing the study results with Senda et al. splashing threshold for
each fluid: a) H2O; b) 50%/50% mixture; b) 75%/25% mixture; d) 100% Jet A-1.
... 62 Figure 3.10 Graphic comparing the study results with Vander Wal et al. splashing threshold. ... 64 Figure 3.11 Graphics comparing the study results with Huang and Zhang splashing threshold
for each fluid: a) H2O; b) 50%/50% mixture; b) 75%/25% mixture; d) 100% Jet
xiii
List of Tables
Table 1.1 Summary of the splashing thresholds presented in the literature and used in
this study. ... 14
Table 2.1 Impact conditions range of the experiments. ... 22
Table 2.2 Realized essays in order to obtain the density of every fluid. ... 24
Table 2.3 Realized essays to obtain the surface tension of every fluid. ... 25
Table 2.4 Values of the dynamic and kinematic viscosity of every fluid. ... 26
Table 3.1 The droplet diameters used in the experiments. ... 34
Table 3.2 The impact velocities used in the experiments. ... 37
Table 3.3 The thickness of the liquid films used in the experiments. ... 38
Table 3.4 The relative thickness of the thinner liquid films for H2O. ... 39
Table 3.5 Dimensionless numbers used in the experiments (Oh, La, Re and We). ... 40
Table 3.6 Splash and non-splash outcome identification. ... 48
Table 3.7 Description of the outcomes for the lower impact height (ℎ1= 0.175𝑚). ... 50
Table 3.8 Description of the outcomes for the second impact height (ℎ2= 0.5𝑚). ... 52
xv
Nomenclature
𝐴 Coefficient which depends on the surface roughness
𝐵𝑜 Bond Number
𝐶𝑎 Capillary Number
𝐷0 Droplet diameter
𝐷𝑖𝑛 Needle inner diameter
𝐷𝑚𝑒𝑎𝑠 Measured Diameter
𝐷𝑜𝑢 Needle outer diameter
𝐷𝑡ℎ𝑒𝑜 Theoretical Diameter
𝐹𝑟 Froude Number
𝑔 Acceleration due to gravity
ℎ1, ℎ2, ℎ3 Impact heights: 1 – 0.175𝑚; 2 – 0.500𝑚; 3 – 1.000𝑚.
𝐾𝐿 Splashing/Deposition Limit
𝑙𝑎 Surface roughness
𝐿𝑎 Laplace Number
𝑚𝑝 Mass of the empty pycnometer
𝑚𝑠 Mass of the pycnometer full of the substance
𝑂ℎ Ohnesorge Number
𝑅0 Droplet radius
𝑅𝑒 Reynolds Number
𝑅𝑖𝑛 Needle inner radius
𝑅𝑛𝑑 Dimensionless parameter related to the surface roughness
𝑈0 Droplet impact velocity
𝑉𝑝 Volume of the pycnometer
𝑊𝑒 Weber Number
𝑊𝑒𝑐 Critical Weber Number
Greek Symbols
𝛿 Thickness of the liquid film
𝛿∗ Relative thickness of the liquid film
𝜃𝑠𝑡𝑎𝑡 Static contact angle
𝜇 Dynamic Viscosity
𝜈 Kinematic Viscosity
ρ Density
σ Surface Tension
𝜏 Time after impact
Subscripts
0 Related to the droplet
𝑖𝑛 Related to the needle
xvii
List of Acronyms
fps Frames per second
HVO Hydroprocessed Vegetable Oil
JF Jet Fuel
1
Chapter 1
Introduction
This dissertation is devoted to the experimental study of the dynamic behavior of a single droplet impinging upon a liquid film with various relative thicknesses using Jet Fuel and Biofuel mixtures. The outcomes of these impacts provided different phenomena which will be studied and compared with splashing thresholds available in the literature.
This first chapter was divided into four sections. In the first section, the motivation to develop this study is explained. A literature review (section 1.2) was made to present the actual state of knowledge about this theme, including several studies which are considered in the plan and execution of these experiments. In the third section, the objectives of this dissertation are listed and explained. Lastly, in the last section, the general outline of the document is summarized.
1.1 Motivation
Fortunately, the human being has already started to be environmentally concern and the search for new alternatives to reduce pollution increased. Transports are responsible for a significant portion and it is extremely necessary to bet on alternatives to fossil fuels. The introduction of biofuels in aero-engines could be an example. In order to modify and optimize piston engines and gas turbines to operate efficiently with alternative fuels, this work used Jet Fuel and Biofuel mixtures.
The introduction of alternative fuels becomes more important since the fossil fuel resources are scarce and not renewable. So, studies were needed to optimize the mixture preparation and also to study the phenomena created by the spray impingement in the interposed surfaces. In order to achieve that, the present work is focused on a single droplet impinging upon a liquid film of the same fluid. The study of single droplets is important to help develop numerical spray models.
However, this particular study is a matter of interest for several research areas and has a wide variety of applications such as fuel injection in internal combustion engines, processes involving spray paints, coatings, and cooling of electronic equipment. In several of these applications the droplets impinged upon a dry surface, but quickly a thin liquid film was formed by the preceding droplets. This is the reason for the investigation of the dynamic behavior of single droplets impinging upon liquid films.
2
The current legislation only allows fuel mixtures with at least 50% Jet Fuel in volume, for that reason only mixtures with 50% or less of Biofuel were studied since the objective of this work is to be able to be implemented immediately in civil aviation. The biofuel chosen is the NEXBTL (Pizziol, 2017), an hydroprocessed vegetable oil.
1.2 Literature Review
The droplet impingement on the literature was reported for various cases, mainly upon dry and wetted surfaces. When the impact is on a dry wall, the surface could be smooth or rough, heated or angled, and it can even be influenced by a crossflow. When the impact is upon a liquid film, the surface underneath can be smooth or rough, the thicknesses of the liquid films can be thin or really thick, and heat could also be applied.
In the following subsections, the impingement governing parameters, as well as, the impact regimes will be presented and explained. Some considerations about the droplet impinging upon wetted surfaces will be detailed. In the fourth subsection, an experiment’s background will be provided including the conclusions of several authors regarding the impact upon liquid layers. Finally, some splashing thresholds will be considered and clarified.
1.2.1 Impingement Governing Parameters
Many studies encompass the dynamic behavior of droplets impinging upon dry and wetted surfaces. The resultant phenomena of these impacts were always difficult to understand, due to its complexity but also to the number of parameters involved. In order to group some of them, the dimensionless numbers were usually used by the researchers. Bai and Gosman (1995) described two of them: the droplet Weber number and the droplet Laplace number. The Weber number is the ratio between the inertial and surface tension forces, so it is the relation between the droplet kinetic energy and surface energy. The equation to calculate the Weber numbers is presented below:
𝑊𝑒 =𝜌𝐷0𝑈0
2
𝜎 (1.1)
where 𝜌 is the density of the droplet fluid, 𝐷𝑜 is the droplet diameter, 𝑈𝑜 is the droplet impact
velocity and 𝜎 is the surface tension of the droplet fluid. The Laplace number is a measure of the surface tension and viscous forces acting on the liquid and it is defined by the equation 1.2.
𝐿𝑎 =𝜌𝜎𝐷0
𝜇2 (1.2)
where 𝜇 is the dynamic viscosity of the droplet fluid. However, more dimensionless numbers were used in the study of droplet interactions, and Yarin (2006) [20] described some more. The
3
Reynolds number is the ratio between the inertial and viscous forces and it is defined in the equation 1.3.
𝑅𝑒 =𝜌𝐷0𝑈0
𝜇 (1.3)
The Ohnesorge number is also often times used, it relates the viscous forces to the inertial and surface tension forces and can be equated relating the Weber and Reynolds numbers, as can be seen in equation 1.4.
𝑂ℎ = 𝜇
√𝜌𝜎𝐷0
=√𝑊𝑒
𝑅𝑒 (1.4)
Other dimensionless numbers are the Bond, the Froude, and the Capillary numbers. The Bond number is a ratio between the body (gravitational) forces and the surface tension forces, it characterizes the gravity-related effects and is presented in the equation 1.5. The Froude number is the ratio between the inertial and the gravitational forces and it is presented in the equation 1.6. Lastly, the Capillary number is the ratio between the viscous and the surface tension forces and can be seen in equation 1.7.
𝐵𝑜 =𝜌𝑔𝐷0 2 𝜎 = 𝑊𝑒 𝐹𝑟 (1.5) 𝐹𝑟 = 𝑈0 √𝑔𝐷0 (1.6) 𝐶𝑎 =𝜇 𝜎𝑈𝑜 = 𝑊𝑒 𝑅𝑒 (1.7)
However, these three dimensionless numbers will not be used in this dissertation since Yarin (2006) said that in the phenomena obtained by the droplet impacts, the gravity effects were normally not significant.
It is through the impact conditions that the dimensionless numbers were calculated, thus parameters such as the droplet size and impact velocity also governed the outcomes of the droplet impact. The relative thickness of the liquid film is a crucial parameter and it will be explained in section 1.3.3.
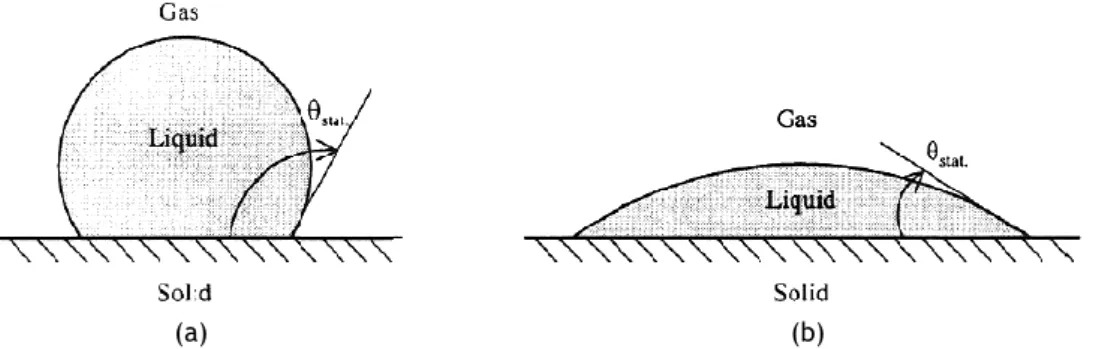
The wettability of the surface also governs the droplet/wall interactions. According to Rioboo et al. (2001), the wettability is defined as the ability of a fluid to spread out on a solid surface and it is quantified by the static contact angle (𝜃𝑠𝑡𝑎𝑡), as can be seen in Figure 1.1.
4
(a) (b)
Figure 1.1: Definition of the static contact angle by Rioboo et al. (2001): a) non-wetting system; b) highly wetting system.
For example, a smooth perspex surface and pure water are a non-wetting system, while a smooth perspex surface and 100% Jet A-1 are a highly wetting system.
Understanding the different components evolved in the droplet impingement is essential to comprehend the content of this dissertation. In this way, over this document some of the nomenclature used are proposed by Yarin and Weiss (1995) and can be seen in figure 1.2. Through this image it is possible to clearly identify what are those components, such as the crown sheet, the rim, the cusp, the secondary atomization, etc.
Figure 1.2: Impingement representation by Yarin and Weiss (1995): (a) splashing mechanism; (b) free rim and secondary droplets magnified.
1.2.2 Impact Regimes
Along with the great amount of parameters that govern the droplet impact upon a dry or wetted surface, a set of possible phenomena can happen depending on the different impact conditions. It is important to identify these regimes as well as understand their differences. Several authors tried to define these phenomena and their opinions are not always unanimous.
The definitions change according to the authors, so the definitions used in this dissertation will be presented as well as others that were found important. A definition of the different phenomena involved in the droplet impact upon both dry and wetted surfaces will be given below.
Stick was defined as when the droplet adheres to the surface in a spherical-like form (figure 1.3), which happen normally at very low Weber numbers (Bai and Gosman, 1995). This phenomenon appears typically for impacts upon dry surfaces.
(a) 1 – residual top of the droplet; 2 –
wall; 3 – section of crown-like sheet propagating outwards; 4 –
cross-section of free rim; 5 – secondary droplets formed from the cusps of free rim; 6 – liquid layer on wall; (b) 1 – crown-like sheet; 2 – free rim at its top edge; 3 – cusp; 4 – thin jet emerging at cusp; 5 – secondary droplets formed on the breakup of the jet.
5 Figure 1.3: Stick regime according to Bai and Gosman (1995).
Spread (figure 1.4), also called deposition was defined as all the process when the droplet deformed and stayed at the surface, without any droplets ejected (Rioboo et al., 2001). By Bai and Gosman (1995) it was reported that spreading happens when the impinging droplet merges with a pre-existing film or spreads out and forms a liquid film on a dry surface. These two definitions were basically the same, and spread or deposition occurs commonly for low impact energies.
Figure 1.4: Deposition regime according to Rioboo et al. (2001).
When a droplet impinges upon a dry surface or liquid film with high Reynolds and Weber numbers a number of fingers are formed radially. The droplet spreading can haveinstabilities at the outer rim of the liquid lamella that can be called fingering. These fingers grow as result of these instabilities (Marmanis and Thoroddsen, 1996), images will be presented ahead.Some authors called these “fingers” jets and identify this phenomenon as jetting, but this description will not be adopted in this dissertation and the phenomenon considered as jetting will be explained ahead.
Prompt splash occurs when the impact energy is high enough for the droplet to disintegrate in the first moments after impact, according to Rioboo et al. (2001).Very tiny droplets are ejected from the periphery of the liquid lamella while the crown is still rising or advancing (figure 1.5). Rioboo et al. (2001) wrote that prompt splash is only observed in the impact with rough surfaces, however, this is not the case since in the literature there are reports of this phenomenon with a whole range of surface topography and also in the impact with liquid films. Therefore, it is clearly influenced by the surface structure.
6
The crown splash phenomenon is widely described in the literature and it is also called corona splash or delayed splash (figure 1.6).Crown splash occurs after the stage of maximum expansion and encompasses the break up of the crown fluid sheet and is really common in the impact with liquid films.
Figure 1.6: Crown splash regime according to Rioboo et al. (2001).
The rebound or partial rebound occurs only when a receding phase is observed (the droplet recoils towards the impact point). This phenomenon was also called jetting and that is the nomenclature used in this dissertation. Shortly, when a droplet impinges upon a dry surface or a liquid film, sometimes after the crown collapses, a vertical extension of fluid, called “jet”, rises from the center of the impact site and droplets are ejected, continuing its upward movement and then falling by gravity forces. Rebound can only happen for the impact upon dry surfaces, as can be seen in figure 1.7.
Figure 1.7: Complete rebound regime according to Rioboo et al. (2001).
The partial rebound can happen in both dry or liquid surfaces (figure 1.8). Again, in this dissertation, since the impact is upon liquid films, this phenomenon will be called jetting.
Figure 1.8: Partial rebound regime (or jetting) according to Rioboo et al. (2001).
The last phenomenon which is important to mention regarding this study is the bubbling, reported by Macklin and Metaxas (1976) as an event where a crown was formed and started to close forming a dome or a bubble.
The occurrence of bubbling normally just happen for liquid films with higher relative thickness, such as deep pools (𝛿∗> 10). Images of this phenomenon will be presented ahead.
7
1.2.3 Wetted Surfaces
The most important characteristic of the liquid films is their thickness, to simplify the comparison between the authors, it is often described as a relative thickness or as a dimensionless thickness (𝛿∗) and can be calculated by the ratio between the thickness of the
liquid films (𝛿) and the droplet diameter (equation 1.8).
𝛿∗= 𝛿
𝐷0
(1.8)
Several studies reported that the relative thickness of the liquid film influences the droplet impact outcomes. According to the value of the relative thickness, it can be divided into categories as suggested by Tropea and Marengo (1999):
Thin film: relative thickness of the liquid film between 𝑙𝑎
𝐷0
⁄ < 𝛿∗< 3𝑅
𝑛𝑑0.16, the impact
depends on the surface topography;
Medium liquid film: relative thickness of the liquid film between 3𝑅𝑛𝑑0.16< 𝛿∗< 1.5 the
droplet impact still depends on the surface topography, but its influence becomes weaker; Shallow pool: relative thickness of the liquid film between 1.5 < 𝛿∗< 4 the impact does
not depend on the surface topography, but only on the thickness of the liquid film;
Deep pool: relative thickness above 4 (𝛿∗≫ 4) the impact does not depend either on the
surface topography or the thickness of the liquid film.
Other authors made other divisions. For example, Vander Wal et al. (2006b) considers thin films when 𝛿∗≈ 0.1, thick films when 1 ≤ 𝛿∗≤ 10 and deep pools for 𝛿∗≫ 10. In that way, along this
dissertation and due to the range of relative thicknesses of the liquid films (0.1 ≤ 𝛿∗≤ 1), it
will be considered that the film with 𝛿∗= 0.1 is a thin liquid film, the films with 𝛿∗= 0.5 is a
shallow liquid film and the film with 𝛿∗= 1 is a thick liquid film. Therefore, it will be easier to
address the different thicknesses of the liquid films. In the next subsection the influences of these liquid films will be reported by the experimental work of several authors.
1.2.4 Experiment’s Background
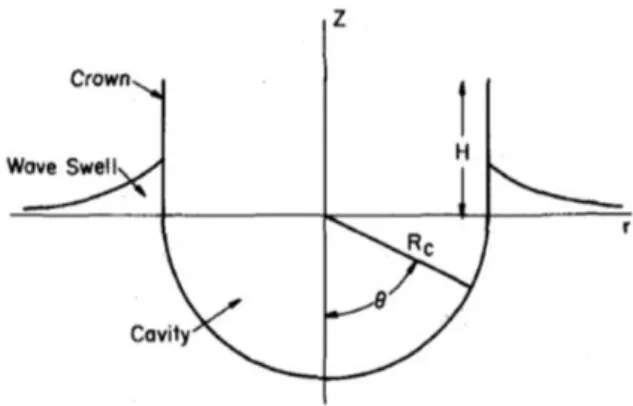
Macklin and Metaxas (1976) experimentally tested the impact of water droplets upon liquid films (0.4 < 𝛿∗< 50). They observed the general characteristics of splashing upon thin and thick
films. For thin films, the cavity (illustrated in figure 1.9) was cylindrical and the wave swell seemed negligible. In contrast, when the thickness of the liquid film increased, the cavity presented a more hemispherical form and the wave swell was more pronounced.
Through their experiments, they also reported that both the crown height and the ejected droplets decreased while the thickness of the liquid film increased, however, the height of the jet formed increased. It is interesting to mention that for nearly all the impacts upon deep
8
pools, bubbling did not occur. Lastly, they reported that for deep splashing (𝛿∗≥ 1.5) the
bottom of the container did not affect the splashing, and for shallow splashing (𝛿∗≤ 0.1) the
cavity was nearly cylindrical. As can be seen, their division of the thicknesses of the liquid films were different than the presented by Tropea and Marengo (1999).
Figure 1.9: Splash model and the coordinate system used by Macklin and Metaxas (1976).
The Chandra and Avedisian (1991) experiments were essentially upon dry solid surfaces. Nonetheless, they also performed impacts upon a preexisting liquid film as a result of the impingement of previous droplets. They reported that due to the liquid film the spreading of the droplet changed significantly.
Range and Feuillebois (1998) focused their work on the droplet impact upon dry rough plates but also with shallow pools for comparison, in both cases a crown was formed and broke-up into small droplets. The biggest difference between this two is that for thin liquid films the splashing happens for smaller Weber numbers. In both cases, there were perturbations in the crown and later the crown disintegrated.
The radius of the droplet can be calculated by the equilibrium between the gravity and the capillary forces that act in the droplet/needle interface (equation 1.9). Multiplying the equation 1.9 by two, the equation for the theoretical droplet diameter can be found (equation 1.10). 𝑅0= ( 3𝑅𝑖𝑛𝜎 2𝑔𝜌 ) 1 3⁄ (1.9) 𝐷0= ( 6𝐷𝑖𝑛𝜎 𝑔𝜌 ) 1 3⁄ (1.10)
They verified the accuracy of the formula by measuring 100 water diameters samples with a 𝑅𝑖𝑛= 0.535𝑚𝑚 needle. They let the droplet fall 1𝑚 because stroboscopic measurements shown
that after 1𝑚 of free fall the droplet is perfectly spherical. The oscillations in the separation between the droplet and the needle were damped out during the fall and do not affect the
9
precision of the measurements (precision of 1%). They also calculated the theoretical velocity through the equation of motion.
Using fixed radius of the droplets (𝑅𝑜= 1.94 ± 0.05𝑚𝑚), they verified that for their impact
conditions, in the impact with dry rought surfaces, the viscosity (has a weak influence) can be neglected in the description of the splashing limits. They also reported that the splashing mechanims of a droplet impinging upon a shallow film is quite similar to the droplet impact upon a dry rough surface. Both splashing and perturbations appearances are highly dependent on the surface tension and the solid surface material.
It is important to declare that they were really careful with the cleaning of the tip of the needle before every test while others authors did not have the same caution. Using a wet needle to produce a droplet causes liquid accumulation that separates in a non-uniform way. This behavior originates a hysteresis in the droplet diameter distribution. They covered the tip of the needle with wax to avoid wetting.
Coghe et al. (1999) measured the crown characteristics of a single droplet splashing upon thin liquid films. Their main conclusions were about the crown diameter which was found independent of the impact velocity and relative thickness of the liquid film. The crown maximum height is reached at a time after the impact and depends on the Weber number. The crown thickness grew in time and it was independent of the thickness of the liquid film and also on the impact velocity. Lastly, they spotted that the number of protruding jets from the crown rim decreases with time.
Cossali et al. (1999) used photographic techniques to measure some components of the droplet impact upon a liquid film: crown diameter, crown height, jets elongation, and secondary atomization diameter. They disclosed that the elongation of the protruding jets was independent on the thickness of the liquid film and impact velocity. Also, they noticed that the higher the Weber numbers the smaller the secondary droplets.
Lindgren and Denbratt (2000) found several numerical models in the literature and classified them as very distinct. Some of them were really simple while others were complex. The differences between them were due to the different impact conditions (temperature, the thickness of the liquid film, surface characteristics, etc).
Rioboo et al. (2000) focused their work on distinguishing the spreading behavior between the impact on dry and wetted surfaces. They showed that maintaining all the impact parameters constant except the surface conditions resulted in completely different morphologies on impact: the crown formation was typical for wetted walls, even with low impact velocities and high viscosities.
10
For droplet impacts upon dry surfaces, the crown formation only happened for liquids with low surface tensions, however, the most common outcome was a radially extended lamella. For a fluid with higher viscosity, the droplet seemed to deform, and neither crown or lamella was formed. The higher the impact velocity the faster the spreading, despite many physical mechanisms dominating the evolution of this process. The viscosity played an important role in the impact upon dry surfaces and also in delaying spread. For wetted surfaces, only tiny variations in the droplet evolution were spotted while the viscosity increased.
The Wang and Chen (2000) experiments were centered about the splashing impact of a single droplet upon very thin liquid films. For this reason, they proposed a new method to produce very thin liquid films with good accuracy (𝛿∗< 0.1). They also verified that the critical Weber
number (the Weber number necessary for splahsing to occur) was influenced by the thickness variation of the liquid film.
They also noticed that for 𝛿∗< 0.1 the critical Weber number gets close to the minimum value.
The minimum critical Weber number depends on the fluid viscosity and on the surface characteristics underneath the liquid film. They reported that the splashing dynamic is different between the thin liquid films and the thicker ones.
Moita and Moreira (2003) showed that the wettability depends strongly on the mean roughness of the surface. This suggests that a non-wetting system is composed of a surface with a very low mean roughness possibly combined with a fluid with low surface tension.
Vander Wal et al. (2006b) studied the droplets splashing upon liquid films of different depths. As mentioned by other authors, they reported that thin liquid films decreased the critical Weber number. They found that the splashed products size and number depended on the presence and thickness of the liquid film. For thicknesses between 0.1 ≤ 𝛿∗≤ 1 both prompt and crowm
splash were spotted. For 1 ≤ 𝛿∗≤ 10 the liquid film limited the prompt splash and inibited the
crown splash.
Both viscosity and surface tension affected the number and size of the splashed products. The number of ejected droplets during prompt and crown splash decreases while its mean size increases with the increase of the surface tension and viscosity.
They also reported that an increase in the viscosity leads to a delay of both prompt and crown splash, and correlated more significantly with the decrease of the number and size of the splashed products.
Their final conclusions were: in the impact with dry surfaces, viscosity promoted splashing, while in thin liquid films the role reverted. The surface tension role appeared to be consistent
11
between all the fluids used by them. Lastly, they reported that high surface tension inhibits splashing both in dry or wetted surfaces.
Vander Wal et al. (2006c) combined the influence of a rough surface and a thin liquid film upon the splashing limit and dynamics. Through their experiments, they recognized that both a thin liquid film and a rough surface changed the splashing limit and dynamic substantially. A rough surface decreased drastically the critical Weber number.
On the impact with a rough surface, the topography of the surface overlaps the importance of the others parameters that govern the outcomes, especially in the splashing regime. Considerable differences between the surface tensions and the viscosities became less significant in the splashing limit and dynamic, and made the outcomes very similar.
The splashing behavior of a rough surface covered by a thin liquid film was a combination of the impact upon a rough surface and upon smooth surface covered by a thin liquid film. In that way, the splashing limit was determined first by the surface characteristics and then by the impact conditions and fluid physical properties.
Zhao et al. (2011) focused their work around the droplet impingement on deep pools and analyzed the transition between spreading and jetting. They noticed that both low viscosity and surface tension fomented the formation of an unstable crown and also high central jet, however low viscosity and high surface tension enhanced the break-up of the jet. They presented two models for the spreading/jetting transition.
Zhang et al. (2017) centered their work on the numerical simulation of a droplet impacting upon films of varied liquid properties. They investigated the relative influence of the viscosity and surface tension on the droplet impact and on the prompt splashing regime.
They found that a decrease in the fluid viscosity and surface tension increased the crown heigh while the crown thickness decreased. They also reported that the Weber number plays an important role in the dynamic behavior of the droplet when the Weber number increased, the impact process quickened and the number of splashing products increased.
1.2.5 Splashing Thresholds
The occurrence of splash was always an important concern for the researchers. The desire to predict the droplet impact outcomes originated the development of empirical correlations. The authors realized essays and used that data, as well as, data presented in the literature to obtain equations which can establish a boundary between the splash and the deposition regime. Several correlations were presented in the literature. There were boundaries available for the impact with dry surfaces as well as with wetted surfaces. These boundaries were crucial for
12
the implementation of numerical models. Some splashing thresholds were presented above along with a few considerations related to their development.
Bai and Gosman (1995) derived three regime transition criteria in order to create a spray impinging model. First, they developed a criterium for the transition between spread and splash for dry walls using the data of Stow and Hadfield (1981) (equation 1.11). Then they developed an empirical correlation for the transition between rebound and spread, in this case for wetted walls (equation 1.12).
𝑊𝑒𝑐 = 𝐴 ∙ 𝐿𝑎−0.18 (1.11)
𝑊𝑒𝑐≈ 5 (1.12)
The coefficient A in the equation 1.11 depends on the surface roughness. They also provided a table with the values of the coefficient for some surface roughness. Lastly, they developed a threshold between spread and splash for wetted walls trough the equation created for the dry walls assuming that a wetted wall behaves as a very rough dry surface. This assumption was made based on some studies where the authors considered the behavior between rough surfaces and liquid films similar. The equation 1.13 shows the deposition/splashing boundary for wetted walls:
𝑊𝑒𝑐= 1320 ∙ 𝐿𝑎−0.18 (1.13)
Cossali et al. (1997) also proposed a splashing threshold for droplets impinging upon wetted solid surfaces. In their experiments, they varied the droplet diameter between 2.00𝑚𝑚 and 5.50𝑚𝑚, the impact height between 0.05𝑚 and 2.00𝑚 and the maximum terminal velocity was found to be 6.5𝑚/𝑠. They used a liquid film thickness superior to 250
𝜇𝑚
.
To achieve a wide range of Ohnesorge numbers, pure water and four mixtures of water-glycerine were used. Their empirical correlation is described by the equation 1.14. In the description, they said that this deposition/splashing threshold is appropriate for 0.1 < 𝛿 < 1 and 𝑂ℎ > 7 ∙ 10−3 and also for 𝑂ℎ = 2.2 ∙ 10−3 for pure water but only for 𝛿 < 0.2.
𝐾𝐿= (𝑂ℎ−0.4∙ 𝑊𝑒)𝐿= 2100 + 5880 ∙ 𝛿∗1.44 (1.14)
They also reported that a decrease in the Ohnesorge number decreases the splashing limit. According to Lindgren and Denbratt (2000), the impingement was divided into two cases by Senda et al. (1999). One for low impact energies and another for high impact energies. They established that the first case was for 𝑊𝑒 < 300 and the droplet-droplet interaction was studied. For the second case, 𝑊𝑒 > 300 and a deposition/splashing boundary was developed. The boundary was represented by the equation 1.15.
13
𝑊𝑒 = (2164 + 7560 ∙ 𝛿∗1.78)𝐿𝑎−0.2 (1.15)
As can be seen, this empirical correlation is quite similar to the Cossali et al. one.
Vander Wal et al. (2006a) also determined an empirical correlation for the splash/non-splash boundary for both dry surface and thin liquid films. The liquid thickness used was 0.2𝑚𝑚 and the droplet diameter was 2.0𝑚𝑚 since with that diameter, the liquid kept the spherical form during the free-fall, excluding concerns with uneven impacts. They used different fluids and impact velocities to expand their outcomes.
They noticed a dramatic change in the splashing limit by the introduction of the thin liquid film. Based on the obtained results they tested some combinations with Ohnesorge, Reynolds, Weber, and Laplace numbers, but only the power-low correlation between Oh and Re gave a clear boundary between the two regimes. This correlation is presented in equation 1.16.
𝑂ℎ ∙ 𝑅𝑒1.17= 63 (1.16)
They also reported that the presence of a liquid film controls the splashing limit, and the viscosity assumed a secondary role, in opposition to the dry impacts, where viscosity was determinant. Through their analysis, the dependency of the impact velocity for thin liquid films was stronger than for dry impacts, reflecting the assumption that splashing occurs for lower Weber numbers than for dry impacts.
Huang and Zhang (2008) realized several essays of a droplet impacting upon liquid films. They compared their results with transition criteria available in the literature, and since these correlations did not fit properly with their data, they also proposed three correlations to predict the transition between rebound, deposition, jetting and splashing. Their empirical correlation for the deposition/splashing limit is presented in equation 1.17:
(𝑊𝑒 ∙ 𝑅𝑒)0.25= 25 + 7 ∙ 𝛿∗1.44 (1.17)
They used different needles which provided a range of droplet diameters between 1.8𝑚𝑚 and 4𝑚𝑚. The fluids used were water and oil with moderate viscosity. To determine this correlation the relative thicknesses of the liquid films varied between 0.3 and 1.3.
Looking at these criteria, it is noticeable that there are several differences between them. That fact was also mentioned by Lindgren and Denbratt (2000). The models presented in the literature were mostly validated for the data which originated them and normally depend on the impact conditions of the essays considered to create them.
Table 1.1 shows in resume the splashing thresholds considered in this dissertation, presenting their experiments, comments and empirical correlations.
14 Table 1.1: Summary of the splashing thresholds presented in the literature and used in this study.
Reference Authors Experiments Conclusions Empirical Correlations
[6] C. X. Bai and A. D.
Gosman (1995) They derived three regime transition criteria in order to create a spray impinging model:
Spread/splash transition for dry walls using available data.
Rebound/Spread, in this case for wetted walls. Spread/Splash threshold for wetted walls assuming
that a wetted wall behaves as a very rough dry surface.
Their spray impingement model can recognize the different regimes using
the transition criteria developed.
Dry Walls: Spread/Splashing: 𝑊𝑒𝑐= 𝐴 ∙ 𝐿𝑎−0.18 Wetted Wall: Rebound/Spread: 𝑊𝑒𝑐≈ 5 Deposition/splashing: 𝑊𝑒𝑐= 1320 ∙ 𝐿𝑎−0.18 [8] G. E. Cossali, A. Coghe and M. Marengo (1997)
They performed several essays of a droplet impacting upon liquid films and with their results proposed an empirical correlation.
They used a range of droplet diameters between 2.00𝑚𝑚 and 5.50𝑚𝑚, impact heights between 0.05𝑚 and 2.00𝑚 and the maximum terminal velocity was found to be 6.5𝑚/𝑠. They used liquid film thicknesses superior to 250𝜇𝑚. The fluids used were water and four mixtures of water-glycerine.
They proposed an empirical correlation for the deposition/splashing boundary
which holds for 0.1 < 𝛿∗< 1 and
𝑂ℎ > 7 ∙ 10−3 and also for 𝑂ℎ = 2.2 ∙
10−3 for pure water but only for
𝛿∗< 0.2.
They also reported that a decrease in the Ohnesorge number decreases the
splashing limit.
Splashing threshold: 𝐾𝐿= (𝑂ℎ−0.4∙ 𝑊𝑒)𝐿=
2100 + 5880 ∙ 𝛿∗1.44
[15] R. Lingren and I.
Denbratt (2000) They reported that Senda et al. (1997) divided impingement into two cases. One for low impact energies (𝑊𝑒 < 300) and another for high impact energies (𝑊𝑒 > 300) where the deposition/splashing boundary was developed.
They noticed that the models presented in the literature for the
splashing threshold were quite different and these differences were originated by the impact conditions of
the data used to produce them.
Splashing threshold: 𝑊𝑒 = (2164 + 7560 ∙ 𝛿∗1.78)𝐿𝑎−0.2
15
Table 1.1: Summary of the splashing thresholds presented in the literature and used in this study. (continued)
Reference Authors Experiments Conclusions Empirical Correlations
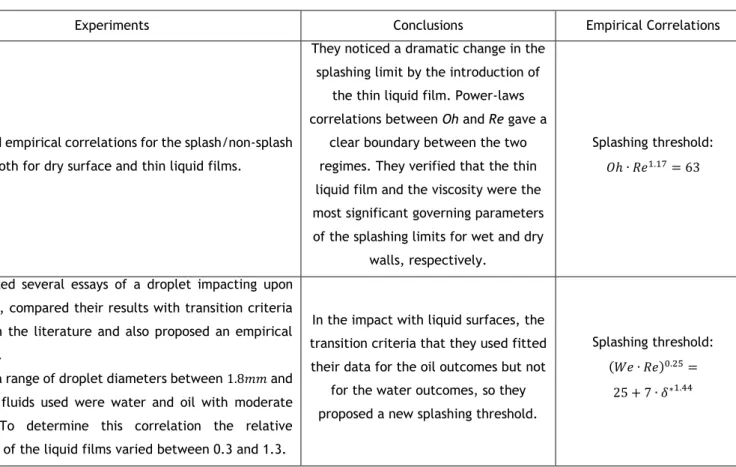
[21] R. L. Vander Wal, G. M. Berger and S.
D. Mozes (2006a)
Determined empirical correlations for the splash/non-splash boundary both for dry surface and thin liquid films.
They noticed a dramatic change in the splashing limit by the introduction of
the thin liquid film. Power-laws correlations between Oh and Re gave a
clear boundary between the two regimes. They verified that the thin liquid film and the viscosity were the most significant governing parameters of the splashing limits for wet and dry
walls, respectively.
Splashing threshold: 𝑂ℎ ∙ 𝑅𝑒1.17= 63
[26] Q. Huang and H. Zhang (2008)
They realized several essays of a droplet impacting upon liquid films, compared their results with transition criteria available in the literature and also proposed an empirical correlation.
They used a range of droplet diameters between 1.8𝑚𝑚 and 4𝑚𝑚. The fluids used were water and oil with moderate viscosity. To determine this correlation the relative thicknesses of the liquid films varied between 0.3 and 1.3.
In the impact with liquid surfaces, the transition criteria that they used fitted their data for the oil outcomes but not
for the water outcomes, so they proposed a new splashing threshold.
Splashing threshold: (𝑊𝑒 ∙ 𝑅𝑒)0.25=
16
1.3 Objectives
As can be seen, by the literature review, many studies were made about the droplet impact upon liquid films. However, none is known to use mixtures with Jet Fuel and Biofuel. Thus, the main objective of this study is to determine the influence of the physical properties of the fuels in their dynamic behavior. To achieve it, these objectives were established:
Design, build and validate an experimental facility to study these phenomena;
Measure the physical properties of the fluids used and report the main differences between them;
Visualize the outcomes obtained by the tests, divide them into splash or non-splash and describe all the phenomena observed;
Report the major differences and similarities between the outcomes of the fuels and relate them with the impact conditions, as well as, the fluids physical properties;
Compare the outcomes of the fuels with water, which will be utilized as a reference since its properties were well defined in the literature;
Compare the experimental data with some splashing thresholds available in the literature.
1.4 Organization
This dissertation is divided into four chapters: Introduction, Experimental Procedure, Results and Discussion, and Conclusions and Future Work.
In this first chapter, the motivation to develop this study was explained. A literature review was given to present the actual state of the knowledge about this theme and also to describe the most important studies made in the area. The objectives of this dissertation were listed and explained and lastly, the general outline of the document was summarized.
In the second chapter, the experimental procedure will be presented in detail. The experimental arrangement will be shown, as well as, their components and specifications. The fluid property characterization will be presented. The work methodology will be detailed, including the two phases presented in the experiments. Lastly, the measurements techniques and methodologies used to process the data will be explained.
In the third chapter, the results of this study will be presented. First, the impact characterization will be made, where the droplet diameters, the impact velocities, the dimensionless numbers and the thicknesses of the liquid films will be calculated. In the second section, all the phenomena visualized will be showed and described. Then, in the third section, a detailed study of the dynamic behavior of the droplet will be made. Lastly, in the last section, the data acquired in this study will be compared with splashing thresholds available in the literature.
17
The last chapter of this dissertation will be divided into two sections where the conclusions and suggestions for future work will be presented.
19
Chapter 2
Experimental Procedure
In this second chapter, all the important features related to the experimental procedure will be presented in detail. The experimental arrangement will be shown as well as all their components and their specifications. Then, the fluids and their properties characterization (density, surface tension and viscosity) will be presented. After that, the work methodology will be detailed, including the two phases of the experiments. Finally, the measurement techniques will be explained such as the methodologies used to process the data.
2.1 Experimental Arrangement
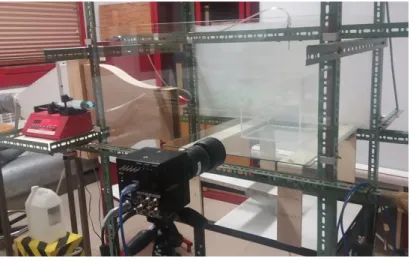
An experimental facility was designed and built for these experiments and can be seen in figure 2.1. The experimental arrangement was essentially composed of four important parts: the image acquisition, the impact surface, the droplet dispensing system and the impact site illumination. All these four parts will be described in detail in the following subsections. To assemble all the parts a structure was built, the iron beams hold all the components except the high-speed camera. There are also holes in the iron beams that permit to change the impact velocity through the height variation of the dispensing needle.
Figure 2.1: Experimental Facility.
The high-speed digital camera that made the image acquisition was manually triggered and it was positioned in front of the impact site that was illuminated by a led lamp through a diffusion glass to provide uniform backlighting. The droplet dispensing system is composed of a syringe pump connected to the needle and operated from the computer to release the droplets with a
20
specific pumping rate. The impact surface was a perspex container filled with fluid. Five needles with different inner diameters and three impact heights were employed to provide a variety of Weber and Reynolds’s numbers.
2.1.1 Image Acquisition
The image acquisition is essential in these studies. A high-speed digital camera was used to allow the droplet impact visualization. Since quality and precision were important features, the camera used was a Photron FASTCAM mini UX50 with 1.3 Megapixel image resolution at frame rates up to 2,000fps and frame rates up to 160,000fps at reduced image resolution. The lens used was a Macro Lens Tokina AT-X M100 AF PRO D with a minimum focus distance of 0.3m, a focal length of 100mm, a macro ratio of 1:1 and a filter size of 55mm. Figure 2.2 presents the camera and the lens.
Figure 2.2: Photron FASTCAM mini UX 50 and the Macro Lens Tokina AT-X M100 AF PRO D.
The high-speed digital camera was manually triggered. The image resolution was 1280x1024, the exposure time was set at 1/5120s and the frame rate at 2,000fps which means that there are 0.5ms between pictures. These features were established at the beginning of the experiments. When the second part of the tests began there was a need to change them to allow better visualization. The frame rate was switched to 2,500fps and the exposure time to 1/6125s, by doing this, the image resolution changed to 1280x800.
2.1.2 Impact Surface
The droplet impinges upon a liquid film, therefore to hold the liquid film a perspex container was used. The material, perspex, was chosen due to its transparency and its smooth surface. The container was dimensioned for these experiments. In order to define the dimensions, tests were made with the pixel size and the distance between the camera and the impact site, to assure the minimum required dimensions to observe the phenomena. Since these were quite low, the side of the container was defined as about 40 times larger than the largest droplet diameter. The dimensions of the topless perspex right-angled container are 200x200x200mm (figure 2.3).
21 Figure 2.3: Perspex container 200x200x200mm.
To create the liquid film, the volume of fluid was calculated to fill all the container with the required height. It was then deposited in the container with a syringe. Since the thickness of the liquid film was really small it was quite difficult to produce the thinner liquid films, especially for water. The perspex is a hydrophobic surface, so when the volume of water correspondent to the thinner thicknesses was placed into the container, the area was not completely covered. To solve this, the volume of water was stipulated, and all the five needles were tested for the same volume of fluid, originating different relative thicknesses for every droplet diameter. For the other relative thicknesses (shallow and thick), that problem did not exist. For the other fluids, it was possible to produce the film for all the relative thicknesses.
2.1.3 Droplet Dispensing System
Creating the droplets and releasing them was an important part of the experimental arrangement. To release the droplets a syringe pump NE-1000 was used (figure 2.4). This syringe pump has an operational capacity of 1.459µl/hour with a 1ml syringe and 127.2ml/min with a 60ml syringe. In this case, a 50ml syringe was employed and the pumping rate used was 0.5ml/min. The syringe pump with the 50ml syringe can be seen in figure 2.4. This syringe is connected to the needle through a cable. One of the advantages of using the syringe pump, beyond the precision enhancement due to the controlled pumping rate, is the fact that it can be operated from the computer, which is much more practical.
22
To produce the droplets with the different diameters, five stainless steel needles were used. Their inner diameters were: 1.50mm, 0.84mm, 0.51mm, 0.25mm and 0.10mm. These needles have straight tips which improve the droplet formation, as can be seen in figure 2.5. To avoid contamination there was a set of needles for each fluid.
Figure 2.5: Stainless steel needles. Left to right the correspondent inner diameters are: 1.50mm, 0.84mm, 0.51mm, 0.25mm and 0.10mm.
Due to the use of different needle inner diameters, it was possible to have a wide range of impact conditions. In the following table, the range of values used in these experiments will be presented, including the droplet diameter, the impact velocity, the thickness and the relative thickness of the liquid films and the dimensionless numbers. In this case, the dimensionless numbers considered were: Reynolds, Weber, Ohnesourge, and Laplace numbers. The values in table 2.1 correspond to the minimum and maximum value used or obtained in these experiments. These values will be specified for every case in Chapter 3.
Table 2.1: Impact conditions range of the experiments.
D0 [mm] 1.73 4.03 U0 [m/s] 1.78 4.21 𝛿 [mm] 0.17 4.03 𝛿* 0.1 1 Re 1411 16889 We 103 1622 Oh ∙ 103 1.863 9.593 La 27986 288100
2.1.4 Impact Site Illumination
The last part that composes the experimental arrangement is the illumination. To take the images, all the lights in the room were turned off and the windows were closed, providing a dark room. The only light source was a 20W led lamp positioned in front of the camera. A diffusion glass was used between the impact site and the led lamp to provide uniform lighting.
23
The led was parallel to the droplet falling plane and the distance to the impact site was 18cm. The distance between the camera and source of light were 58cm. Others sources of light were tested but the one used provided the best illumination.
2.2 Characterization of the Fluid Properties
In this work, four substances were used. First, water since its properties (density, surface tension and viscosity) are reported in the literature and are well defined. The other three substances were 100% Jet Fuel and two mixtures with 75% and 50% in volume of Jet Fuel and the remaining volume of a Biofuel. The Jet Fuel chosen was Jet A-1 and the Biofuel was HVO (Hydroprocessed Vegetable Oil). Since one of the goals was to determine the influence of the different parameters in the dynamic behavior of the droplet with the best accuracy it appeared to be important to work with the right properties.
Consulting the literature (Handbook of Aviation Fuel Properties, 1983) the properties of Jet A-1 and HVO were presented even for a range of temperatures. However, as expected there is no information about the specific mixtures and it wasn’t possible to stipulate them. It was then decided that the properties would be measured. Before presenting the tests and the results it is important to note that all the properties were measured in a controlled environment, under the following conditions: Temperature: 22ºC ± 1ºC; Humidity: 50%. To point out that although only the Jet A-1 and the two mixtures were used in this study, the properties of the HVO and the mixture of 25% in volume Jet A-1 and 75% HVO were also measured.
2.2.1 Density
The density (ρ) is defined as the ratio between the mass and the volume of a homogeneous object/solution at a specific temperature. The pycnometer method was used to determine the density (figure 2.6). This method can be applied both to solids or liquids and it is very precise.
Figure 2. 6: The pycnometers with the different substances. Left to right: 100% Jet A-1, 75% Jet A-1 – 25% HVO, 50% Jet A-1 – 50% HVO, 25% Jet A-1 – 75% HVO and 100% HVO.
The density can be calculated by the following equation:
𝜌 =(𝑚𝑠− 𝑚𝑝) 𝑉𝑝
24
where 𝑚𝑠 is the mass of the pycnometer full with the substance, 𝑚𝑝 is the mass of the empty
pycnometer and 𝑉𝑝 is the volume of the pycnometer. The instrument used to measure the
masses was a Mettler Toledo PB303 DeltaRange balance, the error is ±0.01𝑔. The results are presented in the next table:
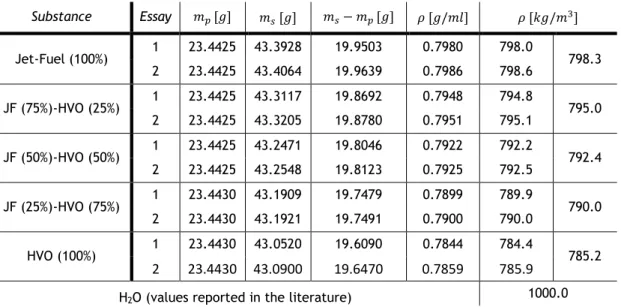
Table 2.2: Realized essays in order to obtain the density of every fluid.
Substance Essay 𝑚𝑝 [𝑔] 𝑚𝑠 [𝑔] 𝑚𝑠− 𝑚𝑝 [𝑔] 𝜌 [𝑔/𝑚𝑙] 𝜌 [𝑘𝑔/𝑚3] Jet-Fuel (100%) 1 23.4425 43.3928 19.9503 0.7980 798.0 798.3 2 23.4425 43.4064 19.9639 0.7986 798.6 JF (75%)-HVO (25%) 1 23.4425 43.3117 19.8692 0.7948 794.8 795.0 2 23.4425 43.3205 19.8780 0.7951 795.1 JF (50%)-HVO (50%) 1 23.4425 43.2471 19.8046 0.7922 792.2 792.4 2 23.4425 43.2548 19.8123 0.7925 792.5 JF (25%)-HVO (75%) 1 23.4430 43.1909 19.7479 0.7899 789.9 790.0 2 23.4430 43.1921 19.7491 0.7900 790.0 HVO (100%) 1 23.4430 43.0520 19.6090 0.7844 784.4 785.2 2 23.4430 43.0900 19.6470 0.7859 785.9
H2O (values reported in the literature) 1000.0
As can be seen, the density decreases while the percentage of Jet Fuel decreases. The Jet-Fuel exhibits the higher value but the difference between the different fluids are relatively small.
2.2.2 Surface Tension
The surface tension (σ) is defined as the specific free energy of a liquid surface at the interface with another fluid according to the Springer Handbook of Aviation Fuel Properties (1983). Usually, the surface tension values are given when the liquid is in contact with air and in this measurements too. The equipment used was the Data Physics – OCAH200 using the pendant droplet method (figure 2.7), recently calibrated and its accuracy is 0.6%.
Figure 2.7: Data Physics – OCAH200 used to measure the surface tension.
Three essays were performed for each substance and the mean value was calculated. The results are presented in the next table:
25 Table 2.3: Realized essays to obtain the surface tension of every fluid.
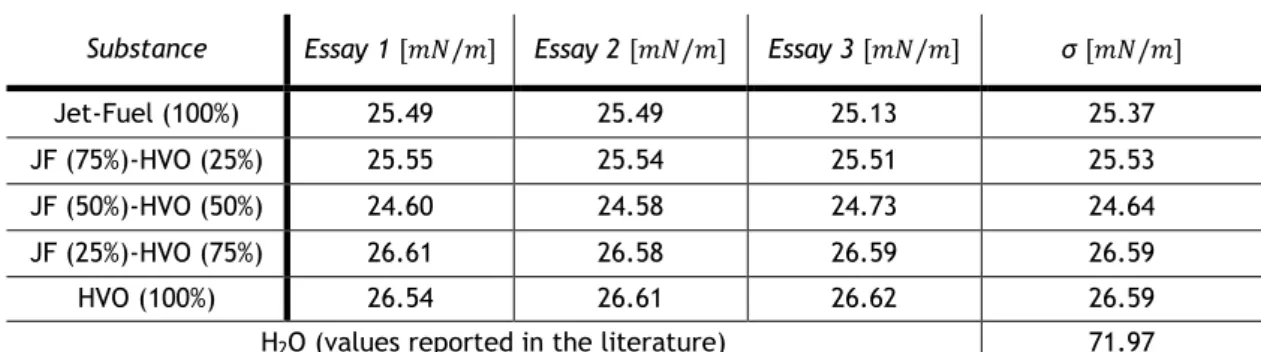
Substance Essay 1 [𝑚𝑁/𝑚] Essay 2 [𝑚𝑁/𝑚] Essay 3 [𝑚𝑁/𝑚] σ [𝑚𝑁/𝑚]
Jet-Fuel (100%) 25.49 25.49 25.13 25.37 JF (75%)-HVO (25%) 25.55 25.54 25.51 25.53 JF (50%)-HVO (50%) 24.60 24.58 24.73 24.64 JF (25%)-HVO (75%) 26.61 26.58 26.59 26.59 HVO (100%) 26.54 26.61 26.62 26.59 H2O (values reported in the literature) 71.97
As can be seen, the surface tension of the five fluids is really small, about one-third of the water and doesn’t follow a uniform variation with the quantity of the substances. However, considering the small variation of this physical property in the three fluids used in the experiments, the surface tension can be considered as almost constant. Therefore, it will be expected that the surface tension will not have a crucial role in the variation of the outcomes. This will be evaluated in the third chapter.
2.2.3 Viscosity
The viscosity (𝜇) is defined as a measure of the fluid internal resistance to motion caused by cohesive forces among the fluid molecules according to the Springer Handbook of Aviation Fuel Properties (1983). There are two types of viscosities: dynamic and kinematic. To measure the fluids viscosities it was used a Brookfield DV3TRVCP Rheometer with a cone and plate geometry for small samples as showed in figure 2.8. This instrument measures the dynamic viscosity and its accuracy is ±1.0% of the range.
Figure 2.8: Brookfield Rheometer with a cone and plate geometry for small samples.
From the values obtained the kinematic viscosity (𝜈) was calculated by the following equation:
𝐾𝑖𝑛𝑒𝑚𝑎𝑡𝑖𝑐 𝑉𝑖𝑠𝑐𝑜𝑠𝑖𝑡𝑦 =𝐷𝑦𝑛𝑎𝑚𝑖𝑐 𝑉𝑖𝑠𝑐𝑜𝑠𝑖𝑡𝑦
𝐷𝑒𝑛𝑠𝑖𝑡𝑦 (2.2)
Similarly to density and surface tension, all the five fluids were tested and the results of both viscosities are presented in the next table: