4 2019, XXII, 1 DOI: 10.15240/tul/001/2019-1-001
Introduction
The world’s population continues to increase rapidly, and, within the next 30 years, more than half of all people will choose to live in large urban centers (Faria et al., 2018). This has led to a number of problems, such as congested people and transportation traffi c and increased pollution that produces climate change. The concept of “smart” cities has emerged as a way to deal with these issues, in which these cities are defi ned as an ecosystem that seeks to improve citizens’ quality of life through a combination of technology, sustainability, and physical infrastructures (Estrada et al., 2018). Smart cities have to use new technologies ranging from the Internet of Things (IoT), which facilitates connections between everything, to home automation (i.e., the ease with which citizens can manage daily routines through their homes).
At a commercial level, these cities promote economic growth by developing smart solutions that make businesses more prosperous and effi cient. Smart cities also play an important role on a social level since their main objective is to improve residents’ quality of life – although citizens must be willing to accept these innovations (i.e., become “smart”). In addition, these cities are essential to the preservation of the environment as they focus on coping with the scarcity of natural resources by using tenable alternatives. Thus, through a combination of social and economic aspects and environmentally friendly practices, these cities should be able to fulfi ll their purpose as long as they make the best decisions.
To make more informed and effi cient decisions, smart cities need to be able to evaluate how well they are doing. Various studies have sought to understand which indicators should be considered in assessments of smart cities and how this process should be
conducted. Thus far, researchers have found that using “loose” indicators, which measure only some areas of these cities, is insuffi cient. The present study, therefore, developed an innovative, integrated cognitive structure that facilitates the evaluation of smart cities in multiple dimensions. More specifi cally, this research used cognitive mapping to provide a more holistic, expanded understanding of the concept of smart cities. No previous work has been found in the relevant literature that used the fuzzy cognitive mapping approach in this research context. Thus, the proposed methodology makes a signifi cant contribution to the extant literature on smart cities, strategic planning, and operational research and/or management science (OR/MS).
The process followed comprised several stages, including the development of a fuzzy cognitive map (FCM) based on the direct contributions of a group of specialists in this fi eld, as well as static and dynamic analyses of the map’s variables. The results show that the construction of an FCM in this research context not only reduces the number of omitted evaluation criteria but also produces a deeper understanding of the cause-and-effect relationships between the determinants identifi ed. The fi nal outcome is a well-informed framework validated by expert panel members, which allows for an objective analysis of the dynamics behind smart cities’ characteristics and/or components.
The rest of this paper is organized as follows. The fi rst section offers an overview of the literature on smart cities. Section two introduces the methodology. Section three describes the processes followed in the construction and testing of our FCM-based framework. Finally, the last section concludes the paper and indicates paths for further research.
AN EXPANDED CONCEPTUALIZATION
OF “SMART” CITIES: ADDING VALUE WITH
FUZZY COGNITIVE MAPS
Bárbara P. Miguel, Fernando A. F. Ferreira, Audrius Banaitis,
Nerija Banaitienė, Ieva Meidutė-Kavaliauskienė, Pedro F. Falcão
EM_1_2019.indd 4
5 1, XXII, 2019
1. Theoretical Overview and
Research Gap
Since the beginning of the twenty-fi rst century, the substantial growth of the world’s population has led to increased urbanization in more developed economies. According to Albino et al. (2015) and Hajduk (2016), about 70% of the world’s population will probably reside in large urban centers by 2050. Larger populations in cities can create less favorable demographic, social, economic, and environmental conditions for citizens, including congested people and transportation traffi c and increased pollution, which produces climate change. The combination of these undesirable conditions gave rise to the concept of smart cities.
Various authors have attempted to defi ne this concept. Bakici et al. (2013, p. 139), for instance, defi ne a “smart city as a high-tech
intensive and advanced city that connects people, information and city elements using new technologies in order to create a sustainable, greener city, competitive and innovative commerce, and a recuperating life quality”.
Popescu (2015), in turn, considers smart cities to be synergistic ecosystems that seek to improve their quality of life and economy, in which technology plays a predominant role. This defi nition was reinforced by Cauchon (2017), who states that this type of city uses technologies to automate municipal functions in order to make the societies involved more habitable, economically stable, and environmentally sustainable.
To make a city truly smart, real-time data need to be accessible in many situations in that municipality – a service that can be provided by the IoT. According to Sofronijević et al. (2014, p. 12), this technology “is a new vision of [an]
overarching communication paradigm involving purposeful communication and bidirectional transfer of data through […] Internet connectivity among different objects or things in our environment”. On a practical level, the IoT is
related to the existence of sensors incorporated into the environment, through which information is exchanged and transformed both vertically and horizontally on specifi c platforms in order to develop a common digital vision of the environment (Sofronijević et al., 2014).
According to Mallapuram et al. (2017) and Roman (2018), smart cities can have multiple dimensions: (1) smart economy; (2) smart governance; (3) smart mobility; (4) smart
environments; (5) smart people; and (6) smart lifestyles. As Khatoun and Zeadally (2016) point out, these cities have many advantages. They offer greater protection and safety through the use of, for example, street surveillance cameras and rapid response emergency services. Smart cities show greater concern for the environment and transportation networks, taking into account pollution levels and street lighting and promoting public transportation as an alternative to private cars. These cities also carefully manage domestic energy and take greater care with education facilities, including making new investments and offering opportunities for everyone. In addition, they pay greater attention to tourism to ensure it takes into account the preservation of natural resources. Finally, smart cities are more concerned about keeping their citizens healthy, using new technologies to implement more effi cient systems for better access to higher quality services.
Nevertheless, some challenges and/or problems need to be taken into account in the development of smart cities. They require large initial investments, which may lead municipalities to avoid them. These cities can have high levels of energy consumption due to already existing technologies. Furthermore, citizens may not be “smart” enough and refuse to accept the use of technologies to automate the functions of their daily life. Citizens’ privacy may also be endangered by cyberattacks (Khatoun & Zeadally, 2016).
Despite the initial investment required, making a city “smarter” has a positive impact on economic development. According to Chuan-Tao et al. (2015), the introduction of smart solutions enables businesses to become more prosperous, improve their effi ciency and quality of management, and increase the use of logistics platforms and more effi cient supply chains. Smart cities also allow advertising to be broader and more precise, thereby enabling networks of partners and customers to expand, facilitating entrepreneurship, launching new investments, and promoting innovation.
In addition to economic components, citizens’ social issues are also quite important in these cities. Šiurytė and Davidavičienė (2016) report that, to be smart citizens, individuals have to accept the application of new technologies in their daily activities in order to simplify the use of various services. Since residents are
EM_1_2019.indd 5
6 2019, XXII, 1
considered one of the main components of smart cities, their wellbeing must be promoted, which includes increasing home automation that enhances the ease with which citizens manage their daily activities throughout their home. Residences with these types of daily management tools are called “smart” homes because they have an automatic system that permits the control of different objects through commands or smartphones (Toschi et al., 2017).
Both economic elements and citizens are important in the development of these cities, but they can only achieve their goals by reconciling policies with environmental sustainability (i.e., becoming green). Smart cities need to make decisions that ensure economic development, citizens’ wellbeing, and a sustainable environment. These decisions can be facilitated through various methods of evaluating smart cities.
The need to measure how “smart” cities are has given rise to several studies and different evaluation procedures using indicators (Dall’O’ et al., 2017). The contributions made to date in this area have been quite important to improving evaluations of smart cities. However, the various assessment tools in existence are based on different types of indicators that only measure specifi c parameters of these cities, such as sustainability, energy effi ciency, or pollution. Ahvenniemi et al. (2017) report that these indicators generally seek to assess sustainability, but other indicators are also needed to assess social and economic aspects.
The cited authors argue that evaluations of smart cities’ performance should not be done using indicators that only measure the effi ciency of implementations of smart solutions. Assessments should also include indicators that measure these solutions’ contribution to smart cities’ fi nal objectives in terms of environmental, economic, and social sustainability. In other words, most of the indicators currently used are “loose” and non-integrated, which indicates that an integrated, robust, and coherent evaluation framework is still unavailable to facilitate a holistic assessment of smart cities (Huovila et al., 2017).
Given these fi ndings, new evaluation systems clearly need to be developed that incorporate different types of indicators that can ensure a reliable assessment of what truly is “smart” in cities. This is precisely what
the present study sought to do. By applying fuzzy cognitive mapping techniques in this research context, we obtained an expanded and integrated understanding of the cause-and-effect relationships between the determinants of smart cities’ success. These insights were the result of a well-informed framework that facilitated analyses of the dynamics behind smart city characteristics and/or components.
2. Methodology
2.1 Brief Background on Cognitive
Mapping
Cognitive mapping is defi ned by Wong (2010, p. 288) as the “process of a series of
psychological transformations by which [an] individual acquires, codes, stores, recalls, and decodes information about the relative locations and attributes of phenomena in [… his or her] everyday spatial environment”. The result of this
process is generally referred to as a “cognitive map”. Cognitive mapping can thus be viewed as a mental structuring process that leads to the creation of a cognitive map (Wong, 2010).
The term “cognitive map” was coined by Tolman (1948) to describe individuals’ internal mental changes and their representation of the relationships between concepts. Swan (1997, p. 188) reinforces this idea by defi ning cognitive maps as “internally representing schemas or
mental models for particular problem-solving domains that are learned and encoded as a result of an individual’s interaction with their environment”. Cognitive mapping is thus used
to structure complex situations because this method allows researchers to model cause-and-effect relationships between existing variables in complex phenomena. In addition, as visual tools, cognitive maps facilitate representations and communication of knowledge, support the identifi cation and interpretation of information, enable consultation and codifi cation, and stimulate mental associations (Gavrilova et al., 2013; Fernandes et al., 2018; Marques et al., 2018; Oliveira et al., 2018).
Ferreira et al. (2016a) and Ribeiro et al. (2017), along with many other researchers, report that cognitive maps have two main functions. The fi rst is a descriptive function, namely, to provide visual representations that help individuals to understand better the problem in question and thus facilitate its resolution. The second is a refl ection function, in which maps are a tool used to develop new ideas.
EM_1_2019.indd 6
7 1, XXII, 2019
2.2 Cognitive Maps and Fuzzy
Cognitive Maps
Cognitive maps are representations of individuals’ environment, providing pictures of reality and helping people to understand cause-and-effect relationships between concepts or
variables (Tegarden & Sheetz, 2003; Ribeiro et al., 2017). Usually, a simple cognitive map contains nodes, which stand for concepts, variables, and/or criteria, and arrows, which represent these components’ cause-and-effect relationships. Fig. 1 provides an example of a simple cognitive map.
The term fuzzy cognitive map (FCM) was introduced by Kosko (1986) to describe cognitive maps that follow a fuzzy logic. As Zadeh (2008), Keršulienė and Turskis (2011) and Pires et al. (2018) note, logic is important for decision making in complex environments, in which objectives and/or constraints are necessarily fuzzy (i.e., no clearly defi ned boundaries). As extension of traditional cognitive maps, FCMs are seen as “a well-established artifi cial intelligence
technique, incorporating ideas from artifi cial neural networks and fuzzy logic, which can be effectively applied in the domain of management science” (Carlucci et al., 2013, p. 208).
Because FCMs combine traditional cognitive maps with fuzzy logic, FCMs have two main characteristics. The fi rst is cause-and-effect relationships between concepts and/or criteria that follow a fuzzy logic. That is, the relationship between two different criteria
is simultaneously represented by a positive and/or negative causal signal and a number varying from -1 to 1 that represents the degree of intensity and/or infl uence of the relationship. The second characteristic is that the system is dynamic because it involves feedback links between the criteria, allowing temporal aspects to be considered in the decision structure (Khan & Quaddus, 2004; Ferreira et al., 2015; Santos et al., 2018). Fig. 2 exemplifi es an FCM, in which
Ci represents the criterion i and wij represents
the intensity of the connection between two criteria i and j.
Three possible types of cause-and-effect relationships exist between criteria or concepts: (1) positive causality (wij > 0); (2) negative
causality (wij < 0); and (3) null causality (wij = 0)
(for further discussion and theoretical details, see also Lee and Lee (2015) and Jorga et al. (2018)). In addition to a graphic representation,
Fig. 1: Example of a simple cognitive map
Source: Village et al. (2012, p. 2776)
EM_1_2019.indd 7
8 2019, XXII, 1
FCMs are also based on mathematical principals. According to Mazlack (2009), these maps include a state vector n × 1 (i.e., A), which comprises the value of n concepts, and a matrix of intensity degrees n × n (i.e., W) – also known as adjacent matrix – in which wij represents the
degree of intensity of the relationships between
n criteria (i.e., C). Ribeiro et al. (2017) specify
that the matrix W has n rows and n columns, in which n is equal to the total number of concepts in an FCM. Tab. 1 offers an example of an adjacent matrix.
Kok (2009) states that non-zero values may appear on the main diagonal of the adjacent matrix, although this diagonal usually presents values equal to zero, so no criterion is self-evident. Thus, the value of each concept is infl uenced by the values of the interconnected
concepts and by its own previous value (Ribeiro et al., 2017). As Albayrak and Albayrak (2016) point out, the state vector A is also updated by the value of the connections between concepts. Carvalho (2013) stipulates, therefore, that updating the value of each concept for the current iteration must occur only after all concepts have been calculated.
This can be represented by Equation (1), which summarizes the fundamentals of the FCM approach:
(1)
Mathematically, Ai(t+1) is the activation level
of the concept or criterion Ci at time t+1, while f Fig. 2: Conceptual structure of an FCM
Source: Chen and Chiu (2016, p. 699)
C1 C2 … Cn-1 Cn C1 0 w12 … w1n-1 w1n C2 w21 0 … w2n-1 w2n …
…
…
…
…
…
Cn-1 wn-11 wn-12 … 0 wn-1n Cn wn1 wn2 … wnn-1 0 Source: ownTab. 1: Example of an adjacent matrix
EM_1_2019.indd 8
9 1, XXII, 2019
is the activation function. In turn, Ai(t) represents
the activation level of the concept Ci at time t,
and Aj(t) is the activation level of the concept Cj
at time t. Finally, wij is the degree of intensity
defi ned for the relationship between both concepts (Stylios & Groumpos, 1998; Mazlack, 2009; Mls et al., 2017; Ribeiro et al., 2017).
According to Mazlack (2009, p. 6), “the new
state vector Anew is computed by multiplying the
previous state vector Aold by the weight matrix W”.
In addition, four types of activation functions exist. These are: (1) hyperbolic tangent (f (x) = tan (x)), which is used when criteria present values between -1 and 1; (2) sigmoid (f (x) = 1 / (1 + e-λx)),
which is used when criteria have values in the interval [0, 1]; (3) bivalent function (f (x) = 0 or 1); and (4) trivalent (f (x) = -1, 0 or 1) (Yaman & Polat, 2009; Papageorgiou et al., 2012; Salmeron, 2012; Glykas, 2013).
Carlucci et al. (2013, p. 213) state that “the
resulting transformed vector is then multiplied by the adjacency matrix and transformed until the system converges to a fi xed point. Typically it converges in less than 30 simulation time steps”. This means that, at the end of these
simulations, a ranking (i.e., “impact strength”) of the variables emerges, based on which decision makers can better understand the decision problem in question through the FCM’s logical structure (Ferreira & Jalali, 2015). In addition, decision makers can formulate “what if” questions and analyze the impact on the system of changing some variables, for example, adding or removing criteria.
Ferreira and Jalali (2015) underline that the greatest challenge in developing FCMs is the diffi culty of obtaining a panel of experts, as well as ensuring the necessary number and duration of group sessions. However, the advantages of this approach to analyzing the dynamics behind the components of smart cities can outweigh these diffi culties.
3. Application and Results
This section details the empirical component of the present study. That is, we describe how we developed an FCM to analyze the different components and/or characteristics of smart cities.
3.1 Participants
FCMs can be developed by a single decision maker or a group of decision makers. However, according to Yaman and Polat (2009, p. 387),
“using a group of experts has the benefi t of improving the reliability of the fi nal model”.
Ackermann and Eden (2001) and Ribeiro et al. (2017) advise recruiting between 3 and 10 specialists per decision group to ensure studies are coherent and valid. In the present research, the group sessions included six expert participants, thus respecting the guidelines presented in the literature.
The sessions had an average duration of 3.5 hours each, and the meetings were guided by 2 experienced facilitators (i.e., researchers). Notably, forming the panel was not an easy task due to the incompatibility of participants’ agendas. Multiple contacts were established for nearly 3 months to recruit the panel of 6 decision makers who participated in this study. These participants work in Lisbon, Portugal. Two of them were female, and the panel’s age ranged between 30 and 50 years old. Their interactions were important to ensure differing points of view were taken into account. The participants joined the panel voluntarily, and they were selected based on their professional experience in different areas of smart cities, such as urban planning, mobility, and citizen wellbeing and healthcare.
The constructivist nature of the proposed methodological approach needs to be highlighted here, given that the focus is on the process rather than the end result (Bell & Morse, 2013). This suggests that the procedures followed can work well with any group of decision makers. After the panel was formed, the fi rst session was conducted as presented in the following subsection.
3.2 Development of Cognitive Structure
Using “Post-its Technique”
The fi rst session with the group of experts began with a brief presentation of the main objective of the study, as well as a brief explanation of the methodology to be used. Next, the following trigger question was asked: “Based on your
personal values and professional experience, what should the characteristics of the best ‘smart city’ be?” This question was posed by
one of the facilitators to stimulate a debate among the participants, thus creating an environment in which all participants could share their knowledge and experiences.
A tool called the “post-its technique” (Ackermann & Eden, 2001) was used, which consists of writing the concepts that the panel
EM_1_2019.indd 9
10 2019, XXII, 1
considers most important on post-its – with each concept written on a separate post-it note. This process was continued throughout the group’s discussions and negotiations until the panel of decision makers expressed satisfaction with the results achieved (Ferreira et al., 2016b). In this process, the decision makers were always given the option of changing concepts and/or inserting new criteria into the map whenever they felt that the latter did not represent their ideas. This methodology also took into account criteria with a negative infl uence (i.e., negative causality) during the panel’s analysis of the smart city concept. These criteria were marked with a negative sign (–) on the corresponding post-it note (Ferreira & Jalali, 2015). Throughout the session, the post-its were placed on a whiteboard to make them visible to all participants.
Grouping concepts by areas of concern (i.e., clusters) took place in the next phase of the fi rst session and produced six clusters: (1) people, (2) planning and environments, (3) technology, (4) infrastructure and materials, (5) services, and (6) transportation and mobility. The decision makers were then asked to
organize the concepts within each cluster in order of greatest importance so that the variables the panel considered most signifi cant in each cluster were placed at the top of the cluster and those that were less signifi cant at the bottom (Ferreira et al., 2016c; Fonseca et al., 2018; Ferreira et al., 2017). Using the
Decision Explorer software (www.baxia.com),
a group cognitive map was developed based on these clusters, and the decision makers were given the opportunity to change the map’s shape and/or content if they did not completely agree with the fi nal result. Fig. 3 presents the fi nal version of this map, which contains more than 200 criteria related to smart cities.
The cognitive map above seeks to structure the panel members’ knowledge and experience revealed through their analysis of the smart city concept. As Ferreira et al. (2015) note, the high volume of information discussed and projected on the map arguably more than compensates for the subjective nature of the process. The latter obviously depends on the facilitators’ skill, and the results are deeply infl uenced by the panel members’ perceptions. Nonetheless, Ferreira et al. (2016b, p. 1474) contend that “the size of the
Fig. 3: Group cognitive map
Source: own
EM_1_2019.indd 10
11 1, XXII, 2019
map, the number of variables identifi ed, and the number of inter-relationships among them, are all important indicators of the capability of this type of tool to tap into often overlooked determinants, as well as the relationships between them”.
In the next session, we analyze the cause-and-effect relationships behind the cognitive structure developed in the fi rst group session.
3.3 Development of FCM
The second group meeting was attended by the same six decision makers. In this session, the panel was asked to look at the map and focus on the existing cause-and-effect relationships between criteria so that the concepts’ degree of intensity (i.e., infl uence) could be measured using the interval [-1; 1]. The session’s facilitators had the task of quietly reading concept by concept through the map while the decision makers distributed the values – within the defi ned range – that they collectively found as the most appropriate measures of the relationships between criteria.
Next, the FCMapper (http://www.fcmappers. net) and Panjek (http://pajek.imfm.si/doku.php)
software packages were used to include the degrees of intensity defi ned by the decision makers in the cognitive structure developed. The result was the FCM presented in Fig. 4, which is similar to a neural network. To simplify the fi gure for this paper, all labels were removed. However, the complete version of the structure, containing all the specifi cations, is available upon request.
As shown by the example in Fig. 5, the decimal number attributed to each arrow depicts the degree of intensity of the cause-and-effect relationship between the head and tail criteria. The cluster shown in Fig. 5 concerns transportation and mobility, and the degree of intensity of each link is measured within the range of [-1; 1]. The next step was an analysis of the main factors that noticeably infl uence the dynamics of key components of the ideal smart city.
3.4 Static and Dynamic Analysis
of Results
Carlucci et al. (2013, p. 216) note that, “through
a proper neural network computational model,
Fig. 4: Basic structure of FCM
Source: own
EM_1_2019.indd 11
12 2019, XXII, 1
[...] what we can get is an idea of the ranking of
the variables in relation to each other according to how the system is perceived in the FCM”.
The present study thus included static and dynamic analyses of the components in the FCM generated.
Static Analysis
All the criteria presented in the collective FCM have a degree of centrality. However, Tab. 2 presents only those that revealed higher indexes in terms of smart cities. The complete list is available upon request.
As shown in Tab. 2, the key components and/or determinants of smart cities are, fi rst, technology (37.80), followed by people (32.70), planning and environments (29.90), infrastructure and materials (22.00), transportation and mobility (21.40), and services (13.90). The least signifi cant factors for smart cities in this list are resilience (6.00) and collaboration (6.00).
According to Papageorgiou et al. (2012, p. 45), “FCMs are simple, yet powerful tools for
modeling and simulation of dynamic systems, based on domain-specifi c knowledge and experience”. Therefore, the present study’s
analysis of the concepts’ degrees of centrality was important not only because the results facilitated a deeper understanding of the system created but also because the primary determinants of the development of smart cities could be identifi ed.
Dynamic Analysis
To analyze the dynamics behind components of smart cities, we used the Mental Modeler software (http://www.mentalmodeler.org/). Gray et al. (2013, p. 967) report that this tool
“provides a way for users to develop a simple qualitative FCM which is then translated into the quantitative structure required to run dynamic FCM scenarios”. Following Azevedo
Fig. 5: Analysis of degrees of intensity for transportation and mobility cluster
Source: own
Factor/Criterion Outdegree Indegree Centrality
Technology 2.00 35.80 37.80
People 2.00 30.70 32.70
Planning and Environments 1.60 28.30 29.90
Infrastructure and Materials 1.20 20.80 22.00
Transportation and Mobility 1.80 19.60 21.40
Services 1.40 12.50 13.90
Resilience 1.00 5.00 6.00
Collaboration 1.00 5.00 6.00
Source: own
Tab. 2: Degrees of centrality of criteria
EM_1_2019.indd 12
13 1, XXII, 2019
and Ferreira’s (2017) example, we carried out dynamic analyses on three different levels: (1) clusters; (2) inter-cluster links; and (3) intra-cluster connections.
Dynamic Analysis at Cluster Level
The clusters’ behavior was analyzed in relation to the concepts recognized as transversal to all clusters (i.e., resilience and collaboration). More specifi cally, three scenarios (i.e., variations of -0.50, 0.75, and 1.00) were simulated in order to evaluate the impact of these cross-sectional concepts in the development of smart cities. Signifi cant changes appear in the six clusters when the degrees of intensity of these transversal criteria change.
For the people cluster, an increase in intensity of 0.75 or 1.00 produces an increase in its importance in relation to the concepts
collaboration and resilience in smart cities.
When this cluster decreases its intensity by -0.50, its importance in relation to smart cities also decreases. According to the expert panel, smart cities must be resilient and collaborative. The planning and environments cluster presents a degree of intensity of 0.80 in its connection to the concepts collaboration and resilience. Increasing this intensity by 0.75 or 1.00 also results in increases of these two cross-sectional concepts, although of a lesser magnitude. When the cluster’s intensity is decrease by -0.50, the two concepts’ importance in relation to smart cities also decreases.
Similar to the people cluster, the technology cluster has an intensity of 1.00, implying that variations in intensity of 0.75 or 1.00 result in an increase in the importance of the concepts of collaboration and resilience in relation to smart cities. A decrease in intensity of -0.50 in this cluster also diminishes the importance these two cross-sectional concepts in the development of smart cities.
The infrastructure and materials cluster has a slightly lower intensity than the other clusters do (i.e., 0.60). However, with an increase in intensity of 0.75 or 1.00, the concepts
collaboration and resilience also become more
important to smart cities. Since the services cluster has an intensity of 0.70, an increase in its intensity of 0.75 or 1.00 causes the concepts
collaboration and resilience to increase in
importance regarding the development of smart cities. When this cluster is subject to a negative variation of intensity of -0.50, cross-criteria tend
to become less important for a city to be “smart”. Finally, the last cluster identifi ed (i.e.,
transportation and mobility) shows an intensity
of 0.90, which makes this cluster one of the most important in the development of smart cities. Thus, when its intensity is increased by 0.75 or 1.00, the cross-sectional concepts under analysis become more important. In contrast, when it intensity is decreased by -0.50, these cross-sectional concepts become less important.
The dynamic analysis performed at the cluster level clearly shows the importance that collaboration and resilience have in the development of smart cities. Nonetheless, this study’s methodological framework required a further analysis of concepts that affect more than one cluster.
Dynamic Analysis at Inter-Cluster Level
Given the presence of criteria that connect to more than one cluster, an analysis needed to be conducted of the impacts of these concepts’ variations in intensity on the clusters to which they are connected. The specifi c criteria analyzed were chosen because they present higher and lower intensity degrees within the respective clusters. As in the previous analyses, three variations of -0.50, 0.75, and 1.00 were simulated.
The analysis started with the concept of
almost zero energy buildings, which is clearly
part of the technology cluster, although this concept is also connected to the infrastructure
and materials cluster. In the second group
session, the decision makers assigned the concept of almost zero energy buildings an intensity degree of 1.00 in relation to the
technology cluster, and 0.80 in connection
to the infrastructure and materials cluster. Variations in the intensity of almost zero energy
buildings impact these clusters.
Regarding the concept of presence of
start-up incubators in the technology cluster,
this concept has an intensity of 0.30. It also is connected to the planning and environments cluster, with an intensity of 0.40. Variations in the intensity of this concept affect these two clusters.
Regarding the optimization of waste
collection concept in the services cluster, which
was assigned an intensity of 0.80, this concept is also connected to the technology cluster, with an infl uence degree of 0.70. In addition,
EM_1_2019.indd 13
14 2019, XXII, 1
the concept of places of worship in the services cluster has a degree of intensity of 0.20. This concept’s connection to the planning and
environments cluster also presents the same
degree of intensity (i.e., 0.20).
The data privacy concept belongs to the
services cluster, with an intensity of -0.40, and
this concept is also connected to the people (i.e., -0.60) and technology clusters (i.e., -0.80). Variations in the intensity of the data privacy concept impact these clusters. With regard to the concept of effi cient construction (materials), this is integrated in the infrastructure and materials cluster, as well as having a connection to the
technology cluster with the same intensity value
(i.e., 0.80).
Finally, the criterion of waste of time is integrated in the transportation and mobility cluster
with an intensity of -0.80. This concept further has a connection to the planning and environments cluster, which has an intensity of -0.50.
After completing the dynamic analysis at the inter-cluster level, a further level of dynamic analysis was conducted. This focused on the intra-cluster level, as presented in the text below.
Dynamic Analysis at Intra-Cluster Level
The fi nal dynamic analysis at the intra-cluster level was carried out by simulating intensity variations in some of the criteria in the various clusters. The four criteria that present the highest and lowest intensities in each cluster were chosen. Tab. 3 presents the impacts of variations of -0.50, 0.75, and 1.00 in the degree of intensity of some criteria in the people cluster.
Criterion Value Assigned ∆ -0.5 ∆ 0.75 ∆ 1.00
Wellbeing and Quality of Life 1.00 -0.46 0.64 0.76
Cosmopolitanism 0.20 -0.10 0.15 0.20
Standardization (Qualifi cations) -0.30 0.15 -0.22 -0.29
Crime/Fear/Insecurity -0.90 0.42 -0.59 -0.72
Source: own
Criterion Value Assigned ∆ -0.5 ∆ 0.75 ∆ 1.00
Renewable Energy Resources 1.00 -0.46 0.64 0.76
Proposals Instead of Bans 0.10 -0.05 0.07 0.10
Symmetry -0.30 0.15 -0.22 -0.29
Heavy Pollution -0.90 0.42 -0.59 -0.72
Source: own
Criterion Value Assigned ∆ -0.5 ∆ 0.75 ∆ 1.00
Almost Zero Energy Buildings 1.00 -0.46 0.64 0.76
Presence of Start-up Incubators 0.30 -0.15 0.22 0.29
Telephone Booths -0.20 0.10 0.15 -0.20
Hackers -0.90 0.42 -0.59 -0.72
Source: own
Tab. 3: Dynamic analysis of people cluster
Tab. 4: Dynamic analysis of planning and environments cluster
Tab. 5: Dynamic analysis of technology cluster
EM_1_2019.indd 14
15 1, XXII, 2019
As shown in Tab. 3, the criterion of wellbeing
and quality of life presents the highest degree
of intensity, with a positive effect on this cluster. In addition, the criterion crime/fear/insecurity has the most negative impact on the cluster in question. Regarding the second cluster (i.e.,
planning and environments), Tab. 4 presents
the simulations carried out on the degree of intensity of some of this cluster’s criteria.
As Tab. 4 reveals, the criterion of renewable
energy resources is the most signifi cant in this
cluster, with a large discrepancy between this concept’s degree of intensity and that of the least important criterion (i.e., proposals instead
of bans). In contrast, the concept of heavy pollution has the most negative effect on this
cluster. This indicates that offi cials must reduce pollution when developing smart cities. Tab. 5 presents the impacts of variations of -0.5, 0.75, and 1.00 on the degree of intensity of some criteria in the technology cluster.
As shown in Tab. 5, the almost zero energy
buildings criterion presents high intensity,
supporting the conclusion that the existence of buildings that are technologically effi cient is essential to the development of smart cities. The results also verify that the concept of
hackers has greater intensity – but in a negative
way – so that combating this threat is extremely important to the sustainable development of
smart cities. Regarding the fourth cluster (i.e.,
infrastructure and materials), Tab. 6 presents
the simulations carried out on the degree of intensity of some of this cluster’s criteria.
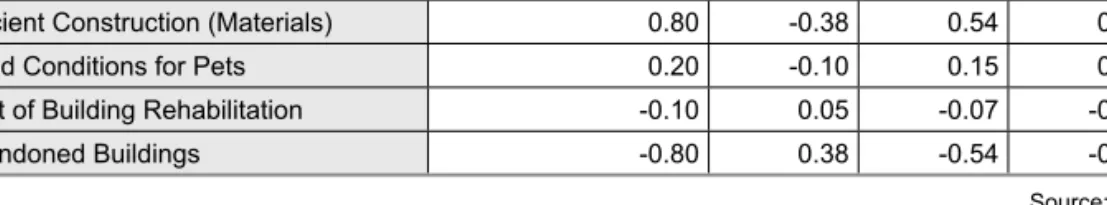
As shown in Tab. 6, the concept of effi cient
construction (materials) has a degree of
intensity of 0.80, revealing its importance in terms of physical infrastructures of cities that seek to be “smart”. Conversely, the concept of abandoned buildings is the criterion that most negatively affects smart cities as this is an adverse factor in terms of the technological effi ciency of buildings. Tab. 7 presents the impacts of variations in the degree of intensity for some criteria in the fi fth cluster (i.e.,
services).
Tab. 7 confi rms that the criterion with the greatest infl uence and/or intensity in the
services cluster is the optimization of waste collection. In contrast, the least important
concept to these cities is places of worship. Regarding negative infl uence, the criterion that most stands out is lack of hygiene. Tab. 8 shows the variations in intensity of the criteria corresponding to the sixth and last cluster (i.e.,
transportation and mobility).
As Tab. 8 reveals, the integration of public
transportation criterion presents the maximum
intensity as this component is needed as an alternative to the use of private cars.
Criterion Value Assigned ∆ -0.5 ∆ 0.75 ∆ 1.00
Effi cient Construction (Materials) 0.80 -0.38 0.54 0.66
Good Conditions for Pets 0.20 -0.10 0.15 0.20
Cost of Building Rehabilitation -0.10 0.05 -0.07 -0.10
Abandoned Buildings -0.80 0.38 -0.54 -0.66
Source: own
Criterion Value Assigned ∆ -0.5 ∆ 0.75 ∆ 1.00
Optimized Waste Collection 0.80 -0.38 0.54 0.66
Places of Worship 0.20 -0.10 0.15 0.20
Lack of Hygiene -0.70 0.34 -0.48 -0.60
Data Privacy -0.40 0.20 -0.29 -0.38
Source: own
Tab. 6: Dynamic analysis of infrastructure and materials cluster
Tab. 7: Dynamic analysis of services cluster
EM_1_2019.indd 15
16 2019, XXII, 1
The concept of creating cycling networks is of less importance. On the negative side,
diffi culty in mobility is highlighted, but this
can be resolved by the integration of public transportation networks. Regarding the concept of waste of time, it has an intensity similar to the previous criterion (i.e., -0.80).
After a dynamic analysis of each cluster, the conclusion was reached that several factors positively or negatively infl uence the development of smart cities. All of these determinants must be taken into account during the process of creating this type of city.
3.5 Validation,
Limitations,
and Recommendations
An FCM was constructed in this study based on the inputs provided by a panel of experts in smart cities. According to Salmeron (2012, p. 3706), “FCMs have [note]worthy
characteristics [such] as fl exibility, adaptability, fuzzy reasoning and the capacity of abstraction. FCMs have been widely used […] to model and analyze complex dynamical systems”. These
benefi ts justifi ed the use of this methodology to expand the conceptualization of smart cities. This methodological choice was reinforced by Papageorgiou et al.’s (2017, p. 16) fi ndings, as these authors portray FCMs as “an effi cient,
transparent and easy to use tool for modeling complex systems and decision support tasks”.
The construction of the present study’s FCM was only made possible by the direct participation of specialists, who guaranteed robust and objective results and proved to be extremely helpful throughout the entire structuring process. Nonetheless, as mentioned previously, the FCM approach has its limitations, especially its context-specifi city (cf. Ferreira & Jalali, 2015). This methodology’s contextual dependence means that the proposed model is idiosyncratic and that the present study’s
results could have been different with another expert panel, other facilitators, and/or longer work sessions.
Regardless of the limitations of this methodology, the process-oriented nature of the approach applied implies that this can be replicated in other contexts and with other decision makers if the procedures followed are carefully adjusted. This fl exibility is a refl ection of the constructivist stance assumed from the start in the present research (cf. Bell & Morse, 2013).
Conclusion
The current study sought to develop an integrated model to evaluate the various dimensions of smart cities. This was achieved by using cognitive mapping techniques to facilitate the development of an FCM. Stach et al. (2005, p. 372) note that “[FCM] development
methods are far from being complete and well-defi ned, mainly because of the well-defi ciencies that are present in the underlying theoretical framework [...T]he development of [… FCMs] almost always relies on human knowledge [...] strongly dependent on subjective beliefs of expert(s) from a given domain”.
Thus, the current research strove to overcome FCMs’ limitations by using the practical know-how and professional experience of a group of experts in different dimensions of smart cities, such as urban planning, mobility, and citizen wellbeing and healthcare. After an FCM was constructed based on the direct involvement of the expert participants, six main clusters were extracted as key components in the development of smart cities. These clusters were: people; planning and environments; technology; infrastructure and materials; services; and transportation and mobility.
In addition, the development of this FCM relied upon measuring the degree of intensity
Criterion Value Assigned ∆ -0.5 ∆ 0.75 ∆ 1.00
Integrated Public Transportation 1.00 -0.46 0.64 0.76
Creation of Cycling Networks 0.50 -0.24 0.36 0.46
Waste of Time -0.80 0.34 -0.48 -0.60
Diffi culty in Mobility -0.90 0.42 -0.59 -0.72
Source: own
Tab. 8: Dynamic analysis of transportation and mobility cluster
EM_1_2019.indd 16
17 1, XXII, 2019
of the cause-and-effect relationships between variables, which ensured greater transparency and versatility in the proposed conceptualization of smart cities. The methodology applied also included the possibility of adding new criteria to portray more accurately the dynamics underlying the model’s components. The results provide support for more informed decisions, which are of great interest to urban planners, city administrators, and society at large. No previous study in this fi eld of research was found to have used the FCM methodology, confi rming that the present study’s approach is innovative and that it makes a positive contribution to the extant literature on smart cities, strategic planning, and OR/MS.
While encouraging, the results of the proposed framework are context-dependent and subjective in nature, so extrapolations to other contexts can only be done with the proper adjustments. Thus, future research may want to consider using different methods and/ or replicating the processes followed in this study with a different group of decision makers in order to obtain other types of feedback. Although direct comparisons with other methods fell outside the scope of the present study, we recognize the importance of this and encourage other researchers to include comparisons. The methodological approach adopted in this study could also be extended to other contexts. Any additional progress will always be welcomed as a step closer to accurate evaluations of smart cities’ components.
Records of the expert panel meetings, including photographs, software output and non-confi dential information of the study, can be obtained from the corresponding author upon request. The authors thank the contribution and knowledge sharing of the expert panel members: Ana Cardoso, Bernardo Paiva, Francisco Manso, Francisco Pombas, Luís Carvalho, and Lea Lima. Facility support from the ISCTE Business School, University Institute of Lisbon, Portugal, is also acknowledged.
References
Ackermann, F., & Eden, C. (2001). SODA – Journey making and mapping in practice. In J. Rosenhead, & J. Mingers (Eds.), Rational
analysis for a problematic world revisited: problem structuring methods for complexity,
uncertainty and confl ict (pp. 43-60). Chichester:
John Wiley & Sons.
Ahvenniemi, H., Huovila, A., Pinto-Seppä, I., & Airaksinen, M. (2017). What are the differences between sustainable and smart cities? Cities, 60, 234-245. https://doi. org/10.1016/j.cities.2016.09.009.
Albayrak, A., & Albayrak, M. (2016). Performance evaluation of practice courses using fuzzy cognitive maps. In 2016 15th
International Conference on Information Technology Based Higher Education and Training (ITHET) (pp. 1-7). https://doi.
org/10.1109/ITHET.2016.7760730.
Albino, V., Berardi, U., & Dangelico, R. M. (2015). Smart Cities: Defi nitions, Dimensions, Performance, and Initiatives. Journal of Urban
Technology, 22(1), 3-21. https://doi.org/10.1080/
10630732.2014.942092.
Azevedo, A., & Ferreira, F. (2017). Analyzing the dynamics behind ethical banking practices using fuzzy cognitive mapping. Operational
Research.
https://doi.org/10.1007/s12351-017-0333-6.
Bakici, T., Almirall, E., & Wareham, J. (2013). A Smart City Initiative: the Case of Barcelona. Journal of the Knowledge Economy,
4(2), 135-148.
https://doi.org/10.1007/s13132-012-0084-9.
Bell, S., & Morse, S. (2013). Groups and facilitators within problem structuring processes.
Journal of the Operational Research Society, 64(7), 959-972. https://doi.org/10.1057/jors.2012.110.
Carlucci, D., Schiuma, G., Gavrilova, T., & Linzalone, R. (2013, June). A fuzzy cognitive map based approach to disclose value creation dynamics of ABIs. Proceedings
of the 8th International Forum on Knowledge
Asset Dynamics (IFKAD-2013) (pp. 207-219).
Zagreb, Croatia.
Carvalho, J. (2013). On the semantics and the use of fuzzy cognitive maps and dynamic cognitive maps in social sciences. Fuzzy
Sets and Systems, 214, 6-19. https://doi.
org/10.1016/j.fss.2011.12.009.
Cauchon, D. (2017). The promise of smart cities. Electric Perspectives, 42(1), 34-41.
Chen, C., & Chiu, Y. (2016). A study of fuzzy cognitive map model with dynamic adjustment method for the interaction weights. In 2016 International Conference
on Advanced Materials for Science and Engineering (ICAMSE) (pp. 699-702).
https://doi.org/10.1109/ICAMSE.2016.7840193.
EM_1_2019.indd 17
18 2019, XXII, 1
Dall’O’, G., Bruni, E., Panza, A., Sarto, L., & Khayatian, F. (2017). Evaluation of cities’ smartness by means of indicators for small and medium cities and communities: A methodology for Northern Italy. Sustainable Cities and
Society, 34, 193-202. https://doi.org/10.1016/j.
scs.2017.06.021.
Estrada, E., Maciel, R., Ortíz Zezzatti, C., Bernabe-Loranca, B., Oliva, D., & Larios, V. (2018). Smart City Visualization Tool for the Open Data Georeferenced Analysis Utilizing Machine Learning. International Journal of
Combinatorial Optimization Problems and Informatics, 9(2), 25-40.
Faria, P., Ferreira, F., Jalali, M., Bento, P., & António, N. (2018). Combining cognitive mapping and MCDA for improving quality of life in urban areas. Cities, 78, 116-127. https://doi. org/10.1016/j.cities.2018.02.006.
Fernandes, I., Ferreira, F., Bento, P., Jalali, M., & António, N. (2018). Assessing sustainable development in urban areas using cognitive mapping and MCDA. International Journal of
Sustainable Development & World Ecology, 25(3), 216-226. https://doi.org/10.1080/135045
09.2017.1358221.
Ferreira, F., & Jalali, M. (2015). Identifying key determinants of housing sales and time-on-the-market (TOM) using fuzzy cognitive mapping. International Journal of Strategic
Property Management, 19(3), 235-244. https://
doi.org/10.3846/1648715X.2015.1052587. Ferreira, F., Jalali, M., & Ferreira, J. (2016a). Experience-focused thinking and cognitive mapping in ethical banking practices: From practical intuition to theory. Journal of
Business Research, 69(11), 4953-4958. https://
doi.org/10.1016/j.jbusres.2016.04.058.
Ferreira, F., Jalali, M., & Ferreira, J. (2016b). Integrating qualitative comparative analysis (QCA) and fuzzy cognitive maps (FCM) to enhance the selection of independent variables. Journal of Business Research,
69(4), 1471-1478. https://doi.org/10.1016/j.
jbusres.2015.10.127.
Ferreira, F., Jalali, M., Ferreira, J., Stankevičienė, J., & Marques, C. (2016c). Understanding the dynamics behind bank branch service quality in Portugal: pursuing a holistic view using fuzzy cognitive mapping.
Service Business, 10(3), 469-487. https://doi.
org/10.1007/s11628-015-0278-x.
Ferreira, F., Jalali, M., Meidutė-Kavaliauskienė, I., & Viana, B. (2015).
A metacognitive decision making based-framework for bank customer loyalty measurement and management. Technological
and Economic Development of Economy, 21(2), 280-300. https://doi.org/10.3846/202949
13.2014.981764.
Ferreira, F., Spahr, R., Sunderman, M., Banaitis, A., & Ferreira, J. (2017). A learning-oriented decision-making process for real estate brokerage service evaluation. Service Business,
11(3), 453-474.
https://doi.org/10.1007/s11628-016-0315-4.
Fonseca, M., Ferreira, F., Fang, W., & Jalali, M. (2018). Classifi cation and selection of tenants in residential real estate: a constructivist approach. International Journal of Strategic
Property Management, 22(1), 1-11. https://doi.
org/10.3846/ijspm.2018.317.
Gavrilova, T., Carlucci, D., & Schiuma, G. (2013). Art of visual thinking for smart business education. In Proceedings of the
8th international forum on knowledge asset dynamics (IFKAD-2013). 12-14 June 2013, Zagreb, Croatia (pp. 1754-1761).
Glykas, M. (2013). Fuzzy cognitive strategic maps in business process performance measurement. Expert Systems
with Applications, 40(1), 1-14. https://doi.
org/10.1016/j.eswa.2012.01.078.
Gray, S., Gray, S., Cox, L., & Henly-Shepard, S. (2013). Mental Modeler: A Fuzzy-Logic Cognitive Mapping Modeling Tool for Adaptive Environmental Management. In
2013 46th Hawaii International Conference on System Sciences (pp. 965-973). https://doi.
org/10.1109/HICSS.2013.399.
Hajduk, S. (2016). The concept of a smart city in urban management. Business,
Management and Education, 14(1), 34-49.
https://doi.org/10.3846/bme.2016.319.
Huovila, A., Airaksinen, M., Pinto-Seppä, I., Piira, K., Bosch, P., Penttinen, T., Neumann, H.-M., & Kontinakis, N. (2017). CITYkeys smart city performance measurement system.
International Journal for Housing Science and Its Applications, 41(2), 113-125.
Jorga, I., Mastrappas, S., & Damigos, D. (2018). Identifying contributing factors to progress in karate-do using the fuzzy cognitive mapping approach. Ido Movement for Culture,
Journal of Martial Arts Anthropology, 18(1),
15-22. https://doi.org/10.14589/ido.18.1.3.
Keršulienė, V., & Turskis, Z. (2011). Integrated fuzzy multiple criteria decision
EM_1_2019.indd 18
19 1, XXII, 2019
making model for architect selection.
Technological and Economic Development of Economy, 17(4), 645-666. https://doi.org/10.38
46/20294913.2011.635718.
Khan, M., & Quaddus, M. (2004). Group Decision Support Using Fuzzy Cognitive Maps for Causal Reasoning. Group Decision
and Negotiation, 13(5), 463-480. https://doi.
org/10.1023/B:GRUP.0000045748.89201.f3. Khatoun, R., & Zeadally, S. (2016). Smart cities: Concepts, architectures, research, opportunities. Communications of the ACM,
59(8), 46-57. https://doi.org/10.1145/2858789.
Kok, K. (2009). The potential of Fuzzy Cognitive Maps for semi-quantitative scenario development, with an example from Brazil. Global Environmental Change,
19(1), 122-133. https://doi.org/10.1016/j.
gloenvcha.2008.08.003.
Kosko, B. (1986). Fuzzy cognitive maps.
International Journal of Man-Machine Studies, 24(1), 65-75.
https://doi.org/10.1016/S0020-7373(86)80040-2.
Lee, D., & Lee, H. (2015). Construction of holistic Fuzzy Cognitive Maps using ontology matching method. Expert Systems with
Applications, 42(14), 5954-5962. https://doi.
org/10.1016/j.eswa.2015.03.020.
Mallapuram, S., Ngwum, N., Yuan, F., Lu, C., & Yu, W. (2017). Smart city: The state of the art, datasets, and evaluation platforms. In
2017 IEEE/ACIS 16th International Conference on Computer and Information Science (ICIS) (pp. 447-452). https://doi.org/10.1109/
ICIS.2017.7960034.
Marques, S., Ferreira, F., Meidutė-Kavaliauskienė, I., & Banaitis, A. (2018). Classifying urban residential areas based on their exposure to crime: A constructivist approach. Sustainable Cities and Society,
39, 418-429. https://doi.org/10.1016/j.
scs.2018.03.005.
Mazlack, L. (2009). Representing Causality Using Fuzzy Cognitive Maps. In NAFIPS 2009
– 2009 Annual Meeting of the North American Fuzzy Information Processing Society (pp. 1-6).
https://doi.org/10.1109/NAFIPS.2009.5156434. Mls, K., Cimler, R., Vaščák, J., & Puheim, M. (2017). Interactive evolutionary optimization of fuzzy cognitive maps. Advances in Fuzzy
Cognitive Maps Theory, 232, 58-68. https://doi.
org/10.1016/j.neucom.2016.10.068.
Oliveira, I., Carayannis, E., Ferreira, F., Jalali, M., Carlucci, D., & Ferreira, J. (2018).
Constructing home safety indices for strategic planning in residential real estate: A socio-technical approach. Technological Forecasting
and Social Change, 131, 67-77. https://doi.
org/10.1016/j.techfore.2017.10.012.
Papageorgiou, E., Hatwágner, M., Buruzs, A., & Kóczy, L. (2017). A concept reduction approach for fuzzy cognitive map models in decision making and management.
Neurocomputing, 232, 16-33. https://doi.
org/10.1016/j.neucom.2016.11.060.
Papageorgiou, E., Roo, J., Huszka, C., & Colaert, D. (2012). Formalization of treatment guidelines using Fuzzy Cognitive Maps and semantic web tools. Journal of Biomedical
Informatics, 45(1), 45-60. https://doi.
org/10.1016/j.jbi.2011.08.018.
Pires, A., Ferreira, F., Jalali, M., & Chang, H. (2018). Barriers to real estate investments for residential rental purposes: mapping out the problem. International Journal of Strategic
Property Management, 22(3), 168-178. https://
doi.org/10.3846/ijspm.2018.1541.
Popescu, G. (2015). The economic value of smart city technology. Economics,
Management, and Financial Markets, 10(4),
76-82.
Ribeiro, M., Ferreira, F., Jalali, M., & Meidutė-Kavaliauskienė, I. (2017). A fuzzy knowledge-based framework for risk assessment of residential real estate investments.
Technological and Economic Development of Economy, 23(1), 140-156. https://doi.org/10.38
46/20294913.2016.1212742.
Roman, K. (2018). Analysis and evaluation of the implementation level of the smart city concept in selected polish cities. BRAIN –
Broad Research in Artifi cial Intelligence and Neuroscience, 9(1), 138-145.
Salmeron, J. (2012). Fuzzy cognitive maps for artifi cial emotions forecasting. Applied Soft
Computing, 12(12), 3704-3710. https://doi.
org/10.1016/j.asoc.2012.01.015.
Santos, F., Ferreira, F., & Meidutė-Kavaliauskienė, I. (2018). Perceived key determinants of payment instrument usage: A fuzzy cognitive mapping-based approach.
Technological and Economic Development of Economy, 24(3), 950-968. https://doi.org/10.38
46/20294913.2016.1261374.
Šiurytė, A., & Davidavičienė, V. (2016). An analysis of key factors in developing a smart city. Science – Future of Lithuania, 8(2), 254-262. https://doi.org/10.3846/mla.2016.900.
EM_1_2019.indd 19
20 2019, XXII, 1
Sofronijević, A., Milićević, V., & Ilić, B. (2014). Smart city as framework for creating competitive advantages in international business management. Management, 19(71), 5-15. https://doi.org/10.7595/management. fon.2014.0015.
Stach, W., Kurgan, L., Pedrycz, W., & Reformat, M. (2005). Genetic learning of fuzzy cognitive maps. Fuzzy Sets and Systems,
153(3), 371-401. https://doi.org/10.1016/j.
fss.2005.01.009.
Stylios, C., & Groumpos, P. (1998). The challenge of modelling supervisory systems using fuzzy cognitive maps. Journal of
Intelligent Manufacturing, 9(4), 339-345.
https://doi.org/10.1023/A:1008978809938. Swan, J. (1997). Using Cognitive Mapping in Management Research: Decisions about Technical Innovation. British
Journal of Management, 8(2), 183-198.
https://doi.org/10.1111/1467-8551.0050. Tegarden, D., & Sheetz, S. (2003). Group cognitive mapping: a methodology and system for capturing and evaluating managerial and organizational cognition. Omega, 31(2), 113-125. https://doi.org/10.1016/S0305-0483(03)00018-5.
Tolman, E. (1948). Cognitive maps in rats and men. Psychological Review, 55(4), 189-208. http://dx.doi.org/10.1037/h0061626.
Toschi, G., Campos, L., & Cugnasca, C. (2017). Home automation networks: A survey.
Computer Standards & Interfaces, 50, 42-54.
https://doi.org/10.1016/j.csi.2016.08.008. Village, J., Greig, M., Salustri, F., & Neumann, W. (2012). Linking human factors to corporate strategy with cognitive mapping techniques. International Ergonomics Association Conference, 41(1), 2776-2780.
Wong, C. (2010). Cognitive mapping on user interface design. In 2010 International
Conference on Computer Applications and Industrial Electronics (pp. 288-293). https://doi.
org/10.1109/ICCAIE.2010.5735091.
Yaman, D., & Polat, S. (2009). A fuzzy cognitive map approach for effect-based operations: An illustrative case. Information
Sciences, 179(4), 382-403. https://doi.
org/10.1016/j.ins.2008.10.013.
Zadeh, L. (2008). Is there a need for fuzzy logic? Information Sciences, 178(13), 2751-2779. https://doi.org/10.1016/j.ins.2008.02.012.
Bárbara P. Miguel
University Institute of Lisbon ISCTE Business School Portugal [email protected]
Prof. Fernando A. F. Ferreira, Ph.D.
BRU-IUL, University Institute of Lisbon ISCTE Business School Portugal and University of Memphis Fogelman College of Business and Economics USA [email protected] [email protected]
Prof. Audrius Banaitis, Ph.D.
Vilnius Gediminas Technical University Faculty of Civil Engineering Department of Construction Management
and Real Estate Lithuania [email protected]
Assoc. Prof. Nerija Banaitienė, Ph.D.
Vilnius Gediminas Technical University Faculty of Civil Engineering Department of Construction Management
and Real Estate Lithuania [email protected]
Assoc. Prof. Ieva Meidutė-Kavaliauskienė, Ph.D.
Research Centre, General Jonas Žemaitis Military Academy of Lithuania
Lithuania and BRU-IUL, University Institute of Lisbon Portugal [email protected]
Assist. Prof. Pedro F. Falcão, Ph.D.
BRU-IUL, University Institute of Lisbon ISCTE Business School Portugal [email protected]
EM_1_2019.indd 20
21 1, XXII, 2019
Abstract
AN EXPANDED CONCEPTUALIZATION OF “SMART” CITIES: ADDING VALUE
WITH FUZZY COGNITIVE MAPS
Bárbara P. Miguel, Fernando A. F. Ferreira, Audrius Banaitis,
Nerija Banaitienė, Ieva Meidutė-Kavaliauskienė, Pedro F. Falcão
The world’s rapidly growing population is an issue to be taken seriously. Its consequences could be dramatic if the required steps are not taken. Concerns about this problem have led to the creation of “smart” cities, which promote improvements in citizens’ quality of life through a combination of new technologies and environmentally sustainable practices. For these cities to be truly “smart”, they need to be evaluated in order to understand the areas in which interventions are necessary to make these cities economically stable and environmentally sustainable. In this regard, various studies have sought to understand which indicators should be considered in assessments of smart cities and how this process should be conducted. Thus far, however, researchers have found that using “loose” indicators, which measure only some areas of these cities, is insuffi cient. That said, this study proposes the use of fuzzy cognitive maps to analyze the dynamics behind smart cities’ components. Grounded in intensive group meetings with a panel of experts in different dimensions of these cities, the method applied produced a well-informed, process-oriented framework that contains the characteristics and components that should be assessed in this type of city. Specifi cally, after a fuzzy cognitive map was constructed based on the direct involvement of the expert participants, six main clusters were extracted as key components in the development of smart cities. These clusters were: people; planning and environments; technology; infrastructure and materials; services; and transportation and mobility. The results also facilitate an improved understanding of smart cities’ cause-and-effect relationships and better strategic planning by urban planners and city administrators. The implications, advantages, and limitations of the proposed framework are also presented.
Key Words: Smart, smart city, smart economy, smart environment, smart governance,
smart mobility, cause-and-effect dynamics, fuzzy cognitive mapping.
JEL Classifi cation: C44, C45, M10, R11. DOI: 10.15240/tul/001/2019-1-001
EM_1_2019.indd 21