Vol.61, no.spe: e18000170, 2018
http://dx.doi.org/10.1590/1678-4324-smart-2018000170 ISSN 1678-4324 Online Edition
BRAZILIAN ARCHIVES OF BIOLOGY AND TECHNOLOGY
A N I N T E R N A T I O N A L J O U R N A L
Simplified Methodology for Temperature Calculation of
Operation and Photovoltaic Modules Yield in
Non-Standardized Environmental Conditions
Muryllo Amalio de Souza
1; Jean Przybysz de Souza
1; Antonio Tadeu Pereima
11 Programa De Pós-Graduação em Sistemas de Energia, Universidade Tecnológica Federal do Paraná, Curitiba,
Paraná, Brasil.
ABSTRACT
This work proposes a simplified methodology to obtain the needed data to determine and investigate the variation of photovoltaic modules performance under non-standardized environmental conditions - Standard Test Conditions and Nominal Operating Cell Temperature. This methodology uses a previously developed mathematical model in association with environmental parameters as wind speed, air temperature and irradiance in different cities, located in different regions in Brazil. These data are obtained from both SWERA project and the National Institute of Meteorology of Brazil websites, both of them with free access on the internet. The result of this methodology is the operating temperature of a commercial polycrystalline module of 330 Wp and 1.95 m², and this methodology also results in the maximum power of the module and efficiency for each set of analyzed environmental parameters. As conclusion, from the the results, it is possible to suggest the investigated environmental parameters have a significant impact on the module performance and therefore cannot be neglected.
Key words:Solar Energy; photovoltaic module; efficiency; wind speed; air temperature
Author of correspondence: [email protected]
INTRODUCTION
The maximum power of a photovoltaic module depends directly on the operating conditions to which it is subjected, as mentioned by Pinho¹. Thus, in order to estimate the energy generated by the same module in different environmental conditions usually the voltage versus current curves manufacturers are available, representing the variations of the irradiance conditions and the operating temperature to which the module is subjected. However, as described by Pinho¹, the available curves refer to STC (Standard Test Conditions), i.e., controlled test conditions, obtained in the laboratory and considering irradiance of 1000W/m² and cell temperature of 25 °C as references and not considering wind speed. STC conditions are rarely attained in a real-life facility, and performance comparison between cells is most commonly used. In order to more accurately represent the conditions found in the field, the parameters of the module in NOCT (Nominal Operating Cell Temperature) condition, i.e., 800 W/m², air temperature of 20°C and wind speed of 1 m/s are informed. Its nominal temperature is reached when the module is exposed to the above conditions, open circuit, lying in a range between 40 and 50°C.
Although the aim of NOCT is to represent the actual condition in which the modules are subject to1, it is reasonable to consider there are variations on, for example, wind
speed and air temperature. These variations on the environmental parameters result in variation on the output power of the module and also, depending on the geographical region the modules are assembled on.
The estimation of operation temperature of photovoltaic modules calculated from environmental data has been studied in the last few years. Jones ans Underwood² show the results of the developing of a thermal model for photovoltaic systems. Its purpose is to estimate the module temperature from environmental data measured along one day, as shown also by Aller et al3. Souza et al4 show that it is possible to verify the
results of the investigation on the relationship between actual data and measured module temperature. However, in this case it is mentioned that the comparison is only possible among geographical regions with similar environmental conditions. Garci et al5 concluded that the temperature has different values along different cells. They used
thermal images to show the temperature distribution on a photovoltaic module.
There are many investigations that have the purpose of studying the behavior of the module temperature and the environmental conditions, especially those with data different from the parameters of STC. Those studies are focused on estimating the impact in the efficiency of the modules due to the environmental variations. In some studies6 the authors mention that the way the module is assembled affects its
temperature because it can promote more convection cooling. The authors assembled some modules in different heights and they find out the modules reach different temperatures, they concluded the higher the height, the lower the temperature. In some studies7 environmental data was measured and the authors found the output power in
polycrystalline modules can be decreased about 24% due to the location they are installed at (Cascavel-PR, Brazil). Whittaker8 showed that the temperature coefficients
can be considered constant over the normal operating temperature range of the modules. Sun et al9 used the finite element technique to demonstrate that irradiance
and wind speed are important parameters for determining the temperature of the module
Literature review shows one study10 which demonstrates the impact of water cooling
on the module efficiency due to the temperature decreasing. In other paper11 the author
a manner to exploit the module temperature to water warming is also proposed, getting lower module temperature and more output power due to better efficiency.
A mathematical model was presented by Mattei et al11 and it is based on the energy
balance principle which is similar to the model presented by Jones and Underwood². The authors concluded that not only the air temperature and irradiance are important but so is the wind speed to efficiency calculations. According to the authors the wind speed cannot be neglected in further investigations on photovoltaic module performance. The energy balance method is based on the principle of gain and loss of energy in any object which is exposed to an energy source - heat, in this case. There is a balance between heat gained by the convection and solar radiation and heat lost due to the wind speed and the generation of electricity by the module. The authors compared five mathematical models, one of these models was classified as an optimized model. The results were compared to data measured in actual installation. In the most accurate model the root mean square error was 2.24 °C and the relative error was 19.8 %. This error is not very low, according to the authors11, but it is necessary to
keep in mind that the model is a very simplified one.
According to the authors11, the results of efficiency obtained through the simplified
model were satisfactory. One of the objective of this paper is to propose a simplified and easy-to-implement methodology as well, so we consider that the model presented in that study is adequate to reach this objective and bring satisfactory results, certainly with a known and acceptable margin of error.
The goal of this article is to propose a simplified methodology based on the mathematical model developed and presented by Mattei11 to estimate the operation
temperature of photovoltaic modules from environmental parameters in which the module is exposed to. This methodology considers the simplifications mentioned by Mattei11 and the following considerations: the module is assembled in a way in which
cooling is possible by convection on both sides; the temperature is equally distributed on the module surface; there is neither cooling by water or rain, only by wind. It is considered that there are no variations on environmental parameters in short periods of time.
Even considering the mentioned simplifications, the methodology proposed in this paper aims to enable an initial qualitative analysis of the module conditions of operation in a certain locality, allowing a quick comparison. Obviously, further analysis would be needed for further detail, if necessary, as an additional step in the decision-making process.
MATERIALS AND METHODS
Mathematical Model
This work used the data of mean wind speed and the maximum air temperature of chosen cities which will be described in the next item of this article. These data were obtained in the last five years (from 2012 up to 2016) which were measured and compiled by INMET (National Institute of Meteorology of Brazil)13 through the
Meteorological Database for Teaching and Research (BDMEP). The irradiation data were obtained from the database of the project SWERA (Solar and Wind Energy Resource Assessment)12 from National Renewable Energy Laboratory (NREL), and
they were stratified through the computational program Radiasol14 considering the
optimal assembly condition, without azimuthal deviation and slope equal to latitude, also considering a typical day.
In equation (1), proposed by Mattei11, it is possible to calculate the module
Tc
=UPVT𝑎+ ∅[(ατ) − nU r− βnrTr]
PV− βnr∅
(1)
Where:
UPV: Thermal losses from the collector to the surroundings;
Ta: air temperature (°C); Φ: solar irradiance (W/m²);
α: absorption coefficient of the cells; τ: glass transmittance ;
nr: reference module efficiency at STC;
β: temperature coefficient; (% / °C) Tr: reference air temperature (25 °C);
The heat exchange coefficient (UPV) can be calculate by the following equation 211.
UPV= 24,1 + 2,9v (2)
Where v is the wind speed.
Mattei11 suggests ατ = 0.81 in his paper. Author also suggests the equation (3) which
is used to calculate the module efficiency from the module temperature.
n = nr[1 − β(Tc− Tr) + γLog∅] (3)
The parameter γ can be considered equal to zero, according to Mattei 11.
Chosen Localities
The module efficiency depends on the chosen photovoltaic module. Thus, for this study, it was chosen a polycrystalline module with efficiency of 16.9% as informed by
the manufacturer. The module is 1.95 m² in area and the temperature coefficient β is
0.31 % / °C. The maximum output power is 330 W at STC.
As mentioned before, the environmental parameter data were obtained from INMET and SWERA. The chosen localities for analysis were the cities: Maringá-PR (23.42°S; 51.93°W), São João do Piauí-PI (8.35° S; 42.25° W), Caicó-RN (6.45° S; 37.09° W) and Roncador-DF (15.93° S; 47.88°W). All of the chosen cities are located in different regions of Brazil and all of them have INMET measurement stations for wind speed and air temperature, which means it is not necessary to interpolate the data. In cases where there are no INMET measurements it would be necessary to proceed to an additional step in order to interpolate the available data.
Data from Database
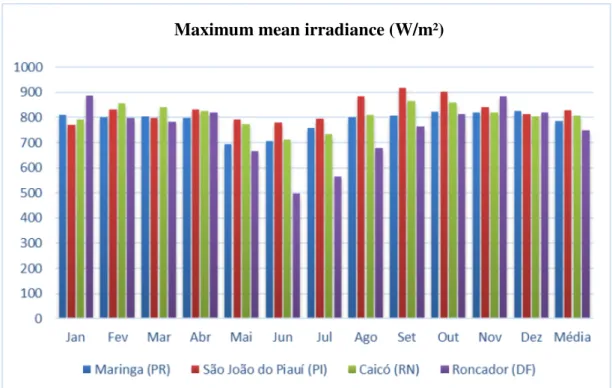
Figure 1 - Maximum mean irradiance month-by-month
Figure 2 - Air temperature month-by-month
Maximum mean irradiance (W/m²)
Figure 3 - AverageWind speed month-by-month
The collected information was compiled in order to be used in the mathematical model and the results of the analysis are as presented in the following section.
RESULTS AND DISCUSSION
Based on the environmental parameters mentioned in the previous item (Figures 1 to 3) of this work and the equations (1) and (2) described above, it was possible to calculate the operating temperature of the module in the selected locations.
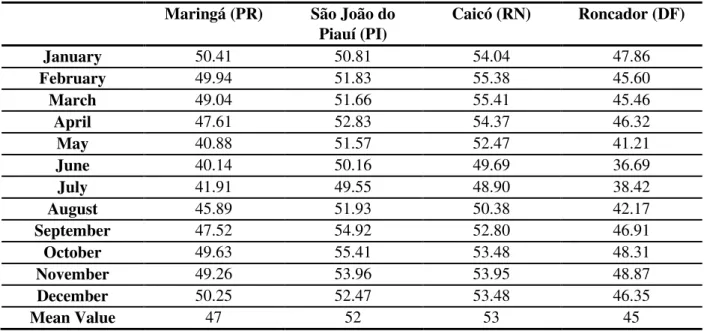
Table 1 below lists the results obtained for the operating temperature of the module. Monthly average results were chosen so that the comparison could be simplified.
Table 1 - Module Operation Temperature
Maringá (PR) São João do
Piauí (PI)
Caicó (RN) Roncador (DF)
January 50.41 50.81 54.04 47.86
February 49.94 51.83 55.38 45.60
March 49.04 51.66 55.41 45.46
April 47.61 52.83 54.37 46.32
May 40.88 51.57 52.47 41.21
June 40.14 50.16 49.69 36.69
July 41.91 49.55 48.90 38.42
August 45.89 51.93 50.38 42.17
September 47.52 54.92 52.80 46.91
October 49.63 55.41 53.48 48.31
November 49.26 53.96 53.95 48.87
December 50.25 52.47 53.48 46.35
Mean Value 47 52 53 45
Pinho1 shows the relationship between the photovoltaic module efficiency and the
maximum output power through the equation (4):
n =G. APMP
m
(4)
Where PMP is the output power, G is the irradiance and Am is the module area.
The efficiency used in Equation (4) is previously corrected by the module temperature through equation (3) and the irradiance depends on the monthly data to be considered, as shown in figure 1. Thus, the following results were reached:
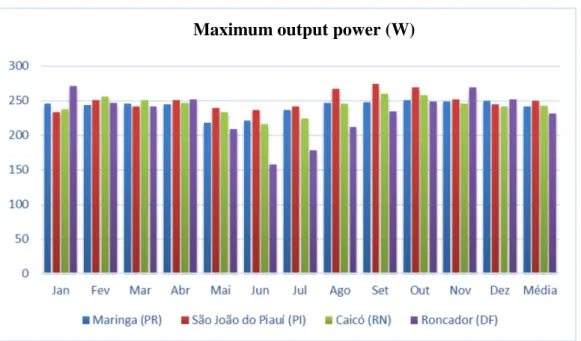
Figure 4 - Maximum output power
Even though the mean values of irradiance of the cities of São João do Piauí and Caicó are greater than the observed irradiance in Maringá, the maximum power is similar in both cases. It means the irradiance affects the performance of the module, once it contributes to the operating temperature increasing of the photovoltaic module. This behavior can be observed in figure 5, below:
Figure 5 - Power Output vs. maximum radiation
Maximum output power (W)
Power output vs. maximum radiation (v=1m/s
Ta=20°C)
Maximum radiation (W/m²) Ma
xi mu
m po we r out put (W
Through the use of the mathematical model proposed by Mattei11, it is possible to
observe that the 330 W photovoltaic module will produce 310 W if the parameters seen in figure 5 and under the STC conditions are considered. However, in the STC conditions, as previously mentioned, the irradiance is 1000 W/m² and de cell temperature is 25 °C 1 while the module temperature is about 50°C (figure 5). This
temperature difference can probably explain the maximum power output difference. The same photovoltaic module will give 252 W if the irradiance is 800 W/m². It is possible to conclude that the mathematical approach11 brings out reasonable results,
once the manufacturer claims the power output would be 242 W under the same parameter (800 W/m²). The error is about 4 %, which is a reasonable error once the mathematical model is a simplified and estimated model. However, the mathematical model applied in this analysis also considers that there is loss of heat due to the conversion of the radiation into electricity, i.e., part of the irradiance is converted into electricity, and therefore does not contribute to the increase of the temperature of the cell. This may explain the fact that the model results in power output is greater than the power output reported by the manufacturer.
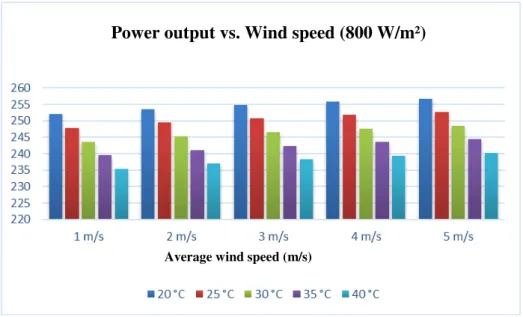
Wind speed also influences the module operation temperature, once it contributes to its cooling. Figure 6 shows the greater the wind speed, the greater the output power.
Figure 6 - Power Output vs. wind speed
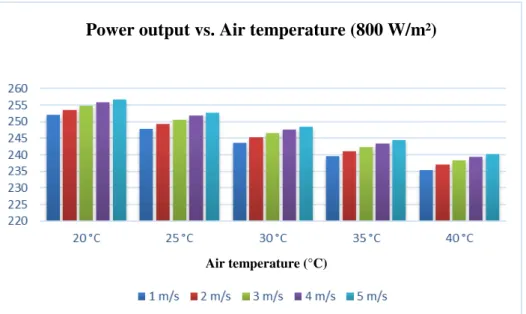
Ambient air temperature influences the power on an inverse way, i.e., the greater the air temperature, the lower the output power. Thus, it is possible to infer that in cities with lower air temperature, the photovoltaic modules will be more efficient, as seen in the figure 7 below.
Power output vs. Wind speed (800 W/m²)
Figure 7 - Power Output vs. air temperature
CONCLUSION
The mathematical model proposed by Mattei11 and the environmental data from
SWERA and INMET demonstrated the proposed methodology has reasonable results. The methodology was applied on NOCT parameters and the result was similar to the photovoltaic module characteristics informed by the manufacturer.
It is evidenced that the environmental parameters (i.e. air temperature, wind speed and irradiance) cannot be neglected when a performance evaluation of the photovoltaic module is required, even in preliminary analysis. These parameters have remarkable influence on the output power on actual conditions.
It is common to suppose that photovoltaic modules assembled in localities with lower mean temperature will be more efficient. However, this study has presented that the wind speed has a remarkable impact on the operation temperature of the module. Thus, this study shows that the behavior of modules installed in places with high wind speed and high irradiance have almost the same behavior of modules installed in places with lower wind speed and lower irradiance. Therefore, it is not possible to state that places with high irradiance will result in high output power without an analysis in combination with wind speed and air temperature once there is influence of irradiance on the module temperature, as well.
It is important to consider that the presented methodology is simplified and the objective is to enable a comparison of the photovoltaic modules installed in cities with different irradiance. This comparison is, for this reason, one of the aspects to be considered, but not the only one on the decision process. Other aspects must be analyzed in combination with location selection, such costs of the land where de modules will be assembled on.
REFERENCES
1. Pinho JT, Galdino MA. Manual de engenharia para sistemas fotovoltaicos [Engineering Manual for Photovoltaic Systems]. CEPEL-CRESESB. Rio de Janeiro, 2014.
2. Jones AD, Underwood CP. A thermal model for photovoltaic systems. Solar Energy. 2001;70(4):349-59.
Power output vs. Air temperature (800 W/m²)
3. Aller J, Viola J, Quizhpi F, Restrepo J, Ginart A, Salazar A. Explicit Model of PV Cells considering variations in temperature and solar irradiance. In: ANDESCON, 2016 IEEE, 2016. Arequipa, Peru.
4. Souza A, Aristone F, Ferrari, LF, Reis, RR. Modelagem de temperatura do módulo de células fotovoltaicas em função da temperatura ambiente, velocidade do vento e irradiância [Temperature modeling of the photovoltaic cell module as a function of air temperature, wind speed and irradiance]. Revista Brasileira de Energia Renováveis. 2016;5(4):504-18..
5. Garcia SB, Zanesco I, Moehlecke A, Febras FS. Análise por termografia de módulos fotovoltaicos com células solares com base N e diferentes malhas de metalização posterior [Thermal analysis of photovoltaic modules with N-based solar cells and different subsequent metallization meshes]. In: IV Congresso Brasileiro de Energia Solar e V Conferência Latino-Americana da ISES – São Paulo, 2012.
6. Araújo AJN, Rank NI, Bueno TBA. Análise dos fatores de perdas nos sistemas fotovoltaicos conectados à rede elétrica em Curitiba. [dissertation]. [Analysis of loss factors in grid-connected photovoltaic systems in Curitiba]. Universidade Tecnológica Federal do Paraná. Curitiba, 2016.
7. Gnoatto E, Dallacort R, Ricieri RP, Silva SL, Ferruzi Y. Determinação da curva característica de um painel fotovoltaico em condições reais de trabalho [Determination of the characteristic curve of a photovoltaic panel under real working conditions]. Acta Scientiarium. Technology. Maringá. 2005;27(2):191-96 8. Whitaker CM, Townsed TU, Wenger HJ, Iliceto A, Chimento G, Paletta F. Effects
of Irradiance and other factors on PV Temperature Coefficients. In: Photovoltaic Specialists Conference, 1991. Conference Record of the Twenty Second IEEE, 1991, Las Vegas.
9. Sun Y, Chen S, Chen S, Shen H. Study on attached PV roof’s temperature with FEM Simulation. In: Photovoltaic Specialist Conference (PVSC), 2015 IEEE 42nd, 2015, New Orleans.
10.Ozgoren M, Aksoy MH, Bakir C, Dogan S. [Internet] Experimental performance investigation of photovoltaic/thermal (PV-T) system. EPJ Web of Conferences.
2013; 45:6. [cited on 2017 june 9]. Available from:
https://doi.org/10.1051/epjconf/20134501106. .
11.Mattei M, Notton G, Cristofari C, Muselli M, Poggi P. Calculation of the polycrystalline PV module temperature using a simple method of energy balance. Renewable Energy. 2006; 31:553-67.
12.Project SWERA [Internet]. National Renewable Energy Laboratory. c2017 [cited on 2017 June 9] . Available from: https://maps.nrel.gov/swera/
13.Banco de Dados Meteorológicos Para Ensino e Pesquisa (BDMEP) [Meteorological Database for Teaching and Research] [Internet]. Instituto Nacional Pesquisas Espaciais.. c2017 [cited on 2017 June 9]. Available from: www.inmet.gov.br/projetos/rede/pesquisa/.
14.RADIASOL program [Internet]. Universidade Federal do Rio Grande do Sul.
C.2017 [cited on 2017 June 9].. Available from:
http://www.solar.ufrgs.br/#softwares .