ISSN 1517-7076 artigo e-12211, 2018
Corresponding Author : Ellen Denise Lopes Alves Received on: 22/03/2017 Accepted on: 08/02/2018
10.1590/S1517-707620180004.0545
Effect of hydroxyurea (HU) on gelatinization
mechanism of type I collagen suspensions
Ellen Denise Lopes Alves1, Antônio Valadão Cardoso2
1 REDEMAT – Rede Temática em Engenharia de Materiais UFOP/UEMG, Belo Horizonte, Minas Gerais, Brasil. 2 Escola de Design - Universidade do Estado de Minas Gerais-UEMG, Belo Horizonte, Minas Gerais, Brasil. e-mail: [email protected], [email protected]
ABSTRACT
Mutant hemoglobins thermodynamic phase transitions (HbS, HbC, etc.) have been the causes of serious hemoglobinopathies that have been affecting mankind since the dawn of human race. HbS polymerization is the best known of these transitions and the original cause of sickle cell anemia. Hydroxyurea (HU, NH2CONHOH) is widely used as the main drug administered for the treatment of Sickle Cell Anemia (SCA). Several hypotheses have been raised on the effects of HU on SCA. The most widespread and accepted one points to the production of fetal hemoglobin by the bone marrow, hindering the polymerization of deoxygen-ated HbS. Moreover, recent studies have reported that the short term in vivo effects of the HU have not been elucidated. By ordinary techniques of Materials Science (scanning electron microscopy, viscoelasticity, vis-cosity measurements, DSC and weight loss) we assessed the nucleating, depolymerizing, and anti-gelling direct effects of HU on suspensions and type I bovine collagen gels. Scanning electron microscopy (SEM) revealed that the addition of HU results in the disappearance of the percolating three-dimensional network typical of collagen gels. Vane Rheometry tests pointed to a reduction in the yield stress (σ0) by add-ing HU into collagen gels with a concentration of 2.2 % w/v. In the liquid phase (sol), suspensions increased viscosity over time but decreased with the addition of HU, highlighting the depolymerizing effect of this substance. The weight loss of the sols is also affect by the addition of HU probably related to the lowering of the interactions between collagen/water as HU is added. The DSC essays indicated changes in the Cp curves as HU is added to the gel, decreasing the structural relaxations commonly observed in those gels. As a result, HU showed an effect on the phase transition of the studied gel, strengthening the hypothesis of anti-nucleating and anti-gelling action thereof on physical, reversible gels, and possibly on physical, reversible gels of mutant hemoglobin (HbS).
Keywords: hydroxyurea, gelation, collagen, polymerization, sickle cell anemia.
1. INTRODUCTION
First synthesized in the XIXcentury [1] and still widely used hydroxyurea (HU, NH2CONHOH) is a sub-stance utilized in such diverse human activities ranging from the nuclear industry [2] to Medicine [3]. This remarkable compound [4] is the main drug administered for the treatment of sickle cell anemia since the beginning of the 21st century. Recently it has been reported that HU occurs naturally in invertebrates (mol-lusks and crustaceans), fishes, amphibians and mammals [5]. Various studies show it has antiviral, antibacte-rial, and antineoplastic properties [6].
thus causing serious damage to vital organs with long and painful episodes, which are amongof the most distressing aspects of the disease. According to data from "Neonatal heel prick" tests applied during the Na-tional Neonatal Screening Program - PNTN (Ministry of Health of Brazil, 2012), nearly 3,500 Brazilian children were born with sickle cell anemia per year, and about 200,000 infants had the "trait", i.e. carrying one mutated gene from one of the parents but without developing the symptoms [15].
Although it was the first genetic disorder described worldwide by Linus Pauling in 1947 [8], the major medical advance was the use of hydroxyurea [16,17, 18], which is today strongly recommended by the inter-national medical community. Previous studies reported the effect of HU as an increase in fetal hemoglobin (HbF) levels and, in turn, amelioration in symptoms [19,20,21]. HU may have a direct effect on the HbS polymer [22,23,24]. The hypothesis of HU anti-gelling effect [25,26] advocated in this paper was evaluated in type-I collagen gels. Collagen [27] is the most abundant protein in mammals, a fibrous protein found in skin, bones, cartilage, and connective tissues, and forms gels of the same nature as deoxygenated HbS gels, that is, physical reversible gels.
The long-term goal pursued in this study, and in ongoing studies, is to generate methods for the test-ing of HbS gels, aimtest-ing at new substances for the treatment of the disease.
2. MATERIALS AND METHODS
Collagen was solubilized in 0.02M acetic acid solution (at pH 2.0) to a final concentration of 6.7 ± 0.5%. After, the solution was heated in a thermostatic bath (TC-500, Brookfield) at 60oC for 60 minutes; then, a sample (C1: 660g) was centrifuged at 2500-rpm rotation for 15 minutes (Mikro 220R, Hettich Zentrifugen) at 40 ºC. The pH was adjusted to 7.4 with a 0.05M NaOH solution. The hydroxyurea (HU 98%, M/S Sigma-Aldrich) doses utilized in the samples were named according to Table 1. For the Vane Rheometry (see below item 2.2) the dose was based on the recommendation established by the Brazilian Ministry of Health, i.e., 35 mg per kg considering an adult weighing 70 kg with a blood volume of 5 liters [28]. Two gel types were prepared: one heterogeneous (6.7 ± 0.5% w/v) and another translucent and homogeneous (2.2% ± 0.5%).
Table 1: Identification of collagen gels
Sam-ple code
%(Collagen
Type I /Water)
HU
concentra-tion on water (mg/ml)
HU content compared to
the maximum human dose per day [28]
Gel characteristics
(Heterogeneous/opaque or homogeneous/ translucent) C1
6.7
0 0 opaque
C2 20 40x opaque
C3 40 80x opaque
Cs1
2.2
0 0 translucent
Cs2 0.49 1x translucent
Cs3 0.98 2x translucent
Cs4 20 40x translucent
Cs5 40 80x translucent
2.1 Scanning electron microscopy (SEM)
After mounting, the slides were sputtered with a 3-nm thick gold layer, using a sputter coater (Quorum SC7620). Lastly, the stubs were placed on the SEM sample holder (Vega 3, Tescan) for analyses.
Typical operating conditions for micrographies are with the detector of secondary electrons (SE), in high vacuum, an accelerating voltage (Acc V) of 10 for 20 kV, a working distance (WD) of 12–20 mm and a beam current of 7.0 nA.
2.2 Vane rheometry and the Yield Stress (σ0) of gels
The gels used for yield stress () testing were Cs1, Cs2, and Cs3, which are characterized in Table 1. The measurements were performed in a Rotational Vane Rheometer with model R/S CC (Brookfield Engineering Laboratories, Inc., Massachusetts, USA) with thermostatic bath (TC 500, Brookfield). Rotation, time, and temperature were selected, being the shearing force and rates provided by RHEO3000 software. A vane shear sensor (V-80-40 model) was used for measurements. A 200-ml aliquot was placed into the sample cup, and the temperature was raised to 40 °C for 15 minutes, with a shear rate of 0.7 RPM (shear rate of 0.23 s-1). Shortly after, the temperature was reduced to 19 °C, with no shearing force over the sample (0 RPM) for 10 minutes. Finally, the temperature of 19 °C was kept but applying a shearing force of 0.7 RPM for 90 minutes. All the essays were performed in a closed environment under exhaust hood and controlled temperature. At 40 ºC, gels are at the sol stage and, when decreased to 19 °C, they pass to a gel stage. The Yield Stress (σ0) can be determined by the maximum value of the curve in the stress deformation graph [30].
2.3 Viscometry essays
The viscosity of 500-μl-gel samples was measured at 37 °C in a Searle-type viscometer (Brookfield, model DV-II) coupled to a thermostatic bath circulator (TC 500, Brookfield). For this, the CPE-40 spindle was set to rotate at the shearing rates of 5.25, 7.50, 56.25, 90.00, 112.50, 150.00, 375, 750, 1,350, and 1,500 s-1. Only results with torque higher than 10% were considered. First, the samples were left to stand in the equipment for 3 minutes for thermal balance. After 30-second rotation, the measurements were performed. The arithme-tic mean of the measurements was used for each shearing rate analysis.
2.4 Total loss testing
Triplicate 30-ml aliquots of collagen Cs1, Cs2, and Cs3 gel samples were weighed on an analytical scale (Shimadzu, model AUW220D, Japan) before and after trials, for a period of 12 days. The test was performed to estimate the amount of volatilized solvent during rheometric trials for gel outflow threshold (Sigma zero).
2.5 Differential scanning calorimetry
3. RESULTS AND DISCUSSION
SEM images of collagen gels showed differences in microstructures between gels with and without HU. In Figure 1 (A), C1 gel displays a random fiber network structure. Such constitution has fiber agglomerates at some points identified by clearerareas. Solvent retention for gel formation depends on the network formed. Conversely, in Figure 1 (B), C2 gel presents a lack of fiber networks in the collagen gel with 20mg/mL of HU; this gel also has a reduced porosity - expressed in the more compact and dense structure. Figure 1 (C) demonstrates that a rise in HU concentration from 40mg/mL HU causes a compaction in C3 gel structure; this sample undergoes strong shrinkage as can be seen by thecracks on the surface. This impairs water reten-tion and consequently provides an increase in free water within the structure, resulting in a compact structure.
Figure 1: Micrographies obtained by SEM of collagen gel 6.7%, where letter A shows gel C1 without HU, letter B gel C2 with HU concentration of 20mg/ml, and letter C shows gel C3 with HU concentration of 40mg/ml. Magnification: see scale bar in the micrograph.
As shown in Figure 2 (A), the Cs1 gel without HU presents a three-dimensional fiber network matrix, which allows the trapping of solvent. In contrast, Cs4 gel sample with 20mg/ml HU (Figure 2 – B) reveals less porosity wherein its structure compresses itself (shrinkage), cracking all over the surface. Through Fig-ure 2 (C) it was possible to observe the Cs5 gel with 40mg/ml HU has characteristics similar to Cs4 (FigFig-ure 2 - B), with cracks due to shrinkage but in a smaller number.
Figure 2: Micrograph obtained by SEM of collagen gel 2.2%, where letter A shows gel Cs1 without HU, letter B gel Cs4 with HU concentration of 20mg/ml, and letter C shows gel Cs5 with HU concentration of 40mg/ml.
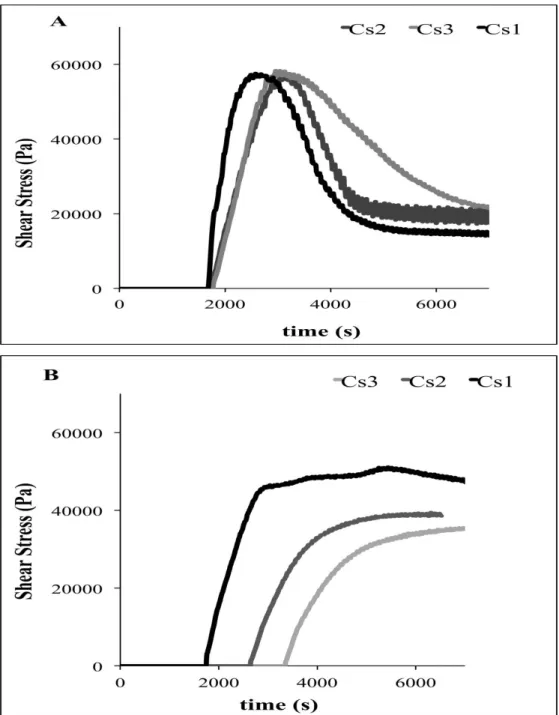
without HU (GCS1~ 400 Pa), close to the values obtained by V. Normand, et al. [34]. It also should be noted that the gel without HU reaches the yield stress (0) threshold with less time, which confirms the previously made statement.
The prepared gels were left at rest in a refrigerator at 10 °C. After 5 days, the same assay was repeat-ed in the same samples, as shown by the graph in Figure 3(B). A change in sample rheology was then evi-denced [34]. In addition to a reduction in the yield stress (0) threshold of all samples, those without HU showed higher values. With this, we can emphasize a decrease in stiffness of the samples as a function of time, due to the disruption of the 3D network, imposed by the application of shear stress after the gelation time (around 1 hour at temperatures below Tgel). The gel does not heal after gelation has occurred so G will decrease continuously as time goes by.
Figure 3: (A) Shear stress (Pa) versus gel deformation (arbitrary units) graph for Cs1 (without HU), Cs2 (0.49 mg/ml HU), and Cs3 (0.98 mg/ml HU). (B) Shear stress (Pa) versus deformation of gels Cs1 (without HU), Cs2 (0.49 mg/ml HU), and Cs3 (0.98 mg/ml HU) after 5 days.
shear-ing rates ( ) for samples without and with HU. The higher viscosity values are observed in the sample with-out HU, and the samples with HU have similar values among each other, as shown in the graph.
After 40 hours, another series of tests were made; the results were plotted on the graph shown in Figure 4(B). Interestingly, the viscosity increased for all samples, sample Cs1 without HU continues to have the highest values. The gel Cs3 with 40mg/ml HU had a viscosity lower than that of Cs2 with 20mg/ml HU.
Figure 4: (A) Viscosity versus shear rate graph of samples Cs1 (without HU), Cs2 (0.49 mg/ml HU), and Cs3 (0.98 mg/ml HU). (B) Viscosity versus shear rate graph of samples Cs1 (without HU), Cs2 (0.49 mg/ml HU), and Cs3 (0.98 mg/ml HU) after 40 hours.
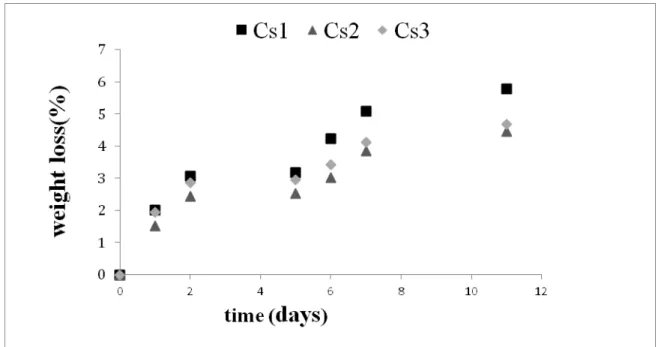
Figure 5: Weight loss graph by samples Cs1 (without HU), Cs2 (0.49mg/ml HU), and Cs3 (0.98mg / ml) during trials.
Figure 6(A) shows the curves obtained by the DSC plotting for the 6.7% collagen gels (C1 without HU, C2, and C3). They reveal a slight specific heat Cp difference among the gels. C1 stand out showing subtle transitions in the specific heat (Cp) value in the temperature interval 10- 40 oC. Some of these transi-tions resemble glassy-state structural relaxatransi-tions [35] and should be further investigated. Gels with HU do not present clearly such transitions.
On the other hand Figure 6(B) shows the thermal behavior of the 2.2% collagen gels Cs1 (without HU), Cs4 (20mg/ml HU), and Cs5 (40mg/ml), three DSC runs for each composition. Here in Figure 6(B) gels with HU have Cp values superior to that of the sample without HU. As the ratio (collagen/water) con-centration is the same in each series (C and Cs), the differences in the Cp values are solely due to the physi-cal interactions between collagen and water in the gel, whose fiber network/water structure is dynamic and mechanically time-dependent as shown in the other experiments of this article.This might shed some light to explain the differences between individual runs in each series.
But in both Figures 6.A and 6.B the distinction between the Cp curves of gels with and without HU are clearly seen indicating that HU alters as expected the interaction collagen/water. It also affects transitions in the collagen gel. In the case of Cs1 (no HU added) we can observe endothermic transitions around 20-25 oC and 30-35 oC. In the samples with hydroxyurea Cs2 (20mg/ml) and Cs3 (40mg/ml) these transitions are absent or not very noticeable.
Collagen gels without HU are amorphous disordered elastic networks and suitable for viewing the role of slow relaxation processes on Cp at a temperature interval well below collagen denaturation. Apparently as the collagen concentration decreases the relaxations became more visible on the modulated (StepScan) DSC experiment. This assumption can also justify the comparison observed in Figure 6 (C), which shows the dif-ference between the Cp curves of the gels C1 and Cs1 both without HU.
4. CONCLUSIONS
The depolymerizing effect of hydroxyurea (HU) on bovine type I collagen gels was evidenced by several experimental techniques. Scanning electron microscopy revealed that the addition of HU results in deteriora-tion of the three-dimensional network, typical of this gel. As is already known for quite sometime [35] the gel samples have an intense internal dynamics modifying their microstructure with time. Rheological testing pointed to a reduction in yield stress (σ0) by adding HU into collagen gels with a concentration of 2.2% w/v. In addition to a reduction in the yield stress (0) of all samples, those without HU showed higher values. In the liquid phase, gels increased viscosity over time but decreased with the addition of HU, high-lighting the depolymerizing effect of this substance. There was a slight weight loss in the 2.2% collagen gels Cs1 (without HU), Cs2 (0.49mg/mL), and Cs3 (0.98mg/mL), among which the gel without HU presented the highest loss. These results corroborate those obtained by SEM, where it was elucidated that most organized three-dimensional networks facilitate solvent volatilization, as in the gel without HU (Cs1).
The differential scanning calorimetry (DSC) experiments have indicated differences in the specific heat curves specially as far as the gel structural relaxations is concerned being more visible in the 2.2% w/v samples. Apparently as the collagen concentration decreases the relaxations have became more visible on the MTDSC (StepScan) experiments. Conversely, gels with HU addition showed lower solvent retention capaci-ty, less pronounced relaxations and higher Cp values (at least for the 2.2% w/v concentration). As it is well known, as collagen in the gel increases, Cp decreases [36].
Gelatin is a physical gel, namely, its gelation is thermally reversible. The sol state (T > Tgel) is a solu-tion of single chains of denatured collagen in water. Below Tgel (~27oC) for type I collagen, renaturation becomes thermodynamically favorable and chains form a network of segments cross-linked.
Indeed, the HU has an effect on type I collagen gelatinization probably lowering Tgel value by sever-al degrees and so avoiding the 3-D network formation and gelation, being possible to consider the hypothesis that such anti-gelling effect of hydroxyurea also occurs in the polymerization of hemoglobin HbS and its reversible gelation.
From this investigative work it is suggested the extension of the study through the use of solutions containing mutant hemoglobins (sickle) to evaluate the depolymerizing effect of hydroxyurea.
5. ACKNOWLEDGMENTS
We would like to thanks CAPES/MEC, Brazil, for the Master Degree scholarship to E.D.L.A and CEMIG S/A for the financial support (research project ANEEL GT343).
6. BIBLIOGRAPHY
[1]TIMSON, J. ―Hydroxyurea‖, Mutation Research, v.32, n.2 pp. 115-131,1975.
[2] KUMAR, S., SINHA, P.K., KAMACHI MUDALI, U., et al. ―Thermal decomposition studies of aqueous and nitric solutions of hydroxyurea‖, J Radioanal Nucl Chem., v. 292, n. 3, pp.1131-1135, 2012.
[3] MADAAN, K., KAUSHIK, D., VERMA, T., ―Hydroxyurea: a key player in cancer chemotherapy‖, Ex-pert Rev. Anticancer Ther., v.12, n.1, pp.19–29, 2012.
[4]LUNGHI,A.,ALONI,C.,GIGANTE,L.,et al., ―Hydroxyurea explosion: a thermoanalytical and calor i-metric study”, Journal of Loss Prevention in the Process Industries, v.15, pp. 489–495, October 2002. [5]FRASER,D.I.,LIU,K.T.,REID,B.J., et al., ―Wide spread natural occurrence of hydroxyurea in ani-mals‖,PLOS ONE,v.10,n. 11, pp. 1-11,E0142890,2015.
[6]SINGH,A,XU,Y-J.The cell killing mechanisms of hydroxyurea.NOGUCHI E, ED.,GENES(BASEL),2016; v. 7, n. 11-99,pp. 1-15,2016.
[7] HERRICK, J.B., ―Peculiar elongated and sickle-shaped red blood corpuscles in a case of severe anemia‖,
[8] PAULING, L., ITANO, H.A., et al., ―Sickle cell anemia, a molecular disease‖, Science, v.110, n. 2865, pp. 543-548, 1949.
[9] WHO. Haemoglobin concentrations for the diagnosis of anaemia and assessment of severity. Vitamin and Mineral Nutrition Information System, Geneva, World Health Organization, 2011
(WHO/NMH/NHD/MNM/11.1). http://www.who.int/vmnis/indicators/haemoglobin , accessed 21st August 2017.
[10] EATON, W.A., BUNN, H.F. ―Treating sickle cell disease by targeting HbS polymerization‖, Blood, v.129, n. 20, pp. 2719-2726, 2017.
[11]KIM,Y.,KIM,K.,PARK,Y.,et al. Measurement Techniques for Red Blood Cell Deformability: Recent
Advances. Blood Cell – An Overview of Studies in Hematology, London, Intech, 2012.
[12] REES, D. C.,―The Rationale for Using Hydroxycarbamide in the Treatment of Sickle Cell
Dis-ease‖,Haematologica, v. 96, n. 4, pp. 488–491, Apr. 2011.
[13] PAULING, L., ―Molecular disease and evolution‖, Bulletin of the New York Academic Medicine, v. 40, pp. 334-342, May 1964.
[14] ZAKHAROV, M. N., APRELEV, A., TURNER, M.S., et al., ―The microrheology of sickle hemoglobin gels‖, Biophysical Journal, v. 99, pp. 1149-1156, 2010.
[15] BRAZIL health authority news site (in portuguese) : Launch of campaign to demystify sickle cell ane-mia2012.http://www.brasil.gov.br/saude/2012/11/lançada-campanha-para-desmistificar-a-anemia-falciforme. Accessed 16th January 2014.
[16] CHARACHE, S., et al., ―Effect of hydroxyurea on the frequency of painful crises in sickle cell anemia‖,
New England Journal of Medicine, v. 332, pp. 1317-1322, May 1995.
[17] CHARACHE, S. ―Mechanism of action of hydroxyurea in the management of sickle cell anemia in adults‖, Seminars in Hematology, v. 34, n. 3, suppl. 3, pp. 15-21, Jul.1997.
[18] AGRAWAL, R. K., PATEL, R. K., SHAH, V. et al. Hydroxyurea in Sickle Cell Disease: Drug Review, Indian Journal of Hematology & Blood Transfusion v. 30, n. 2, pp.91-96, 2014.
[19] GREEN, N.S., BARRAL, S. Emerging science of hydroxyurea therapy for pediatric Sickle Cell Disease. Pediatric Research, v. 75, n. 0, pp. 196-204, 2014.
[20] Mc GANN, P.T., WARE, R.E., Hydroxyurea therapy for Sickle Cell anemia, Expert Opin. Drug Saf., v. 14, n. 11., pp. 1749-58, 2015.
[21]BERNAUDIN,F,VERLHAC,S.,ARNAUD,C.,et al., ―Long-term treatment follow-up of children with sickle cell disease monitored with abnormal transcranial Doppler velocities‖, Blood, v.127, n. 14, pp. 1814-1822, 2016.
[22] NAKAMURA, A; CARDOSO, A. V. ―New technique to investigate the action of hydroxyurea on sickle cell anemia (SS) blood rheology (in Portuguese)‖, In: V Simpósio Brasileiro de Doença Falciforme e outras Hemoglobinopatias, Belo Horizonte, Brasil, 4-7 october 2009.
[23]CARDOSO,A.V.,SOUSA,G.L.Q.―Erythrocyte aggregation (ea) measured using a microplate reader reveals differences in aggregation of SCD blood treated with hidroxyurea (HU)‖, Oral Communication, In: 9th Annual Sickle Cell Disease Research and Educational Symposium and 38th Sickle Cell Disease Scientific Meeting, Hollywood, Florida, USA, 10-13 april 2015.
[24] SOUSA, G. L. Q., CARDOSO, A. V. ―Correlation between erythrocyte aggregation (EA) and TCD (transcranial Doppler) measurements indicate that hydroxyurea (HU) increases EA‖, In: VIII Simpósio Bra-sileiro de Anemia Falciforme, Vitória, Brasil , 5-7 november, 2015.
[25] ALVES, E. D. L., CARDOSO, A. V. ―Gelatinization of hemoglobin suspensions in the presence of hydroxyurea (HU)‖, In: VII Simpósio Brasileiro de Doença Falciforme, Salvador, Brasil, 20-23 november 2013.
[26] ALVES, E. D. L., Study of the effect of hydroxyurea on the mechanism of gelatinization of collagen and hemoglobin suspensions , Degree M.Sc., Redemat/Ufop/Uemg, Ouro Preto-MG, Brasil, 2014.
[27] FRATZL, P. ―Collagen: Structure and Mechanics, an Introduction‖, In: FRATZL, P.(ed), Collagen: Structure and Mechanics , 1 ed., chapter 1, pp. 1-13, New York, USA, Springer, 2008.
ed., Rio de Janeiro, Brasil, SBMM-Sociedade Brasileira de Microscopia e Microanálise, 2010.
[30] BARNES, H. A., NGUYEN, Q. D. ―Rotating vane rheometry — a review‖, J. Non-Newtonian Fluid Mech., v. 98, n. 1, pp. 1-14, 2001.
[31] HOLUBOVÁ, J., ČERNOŠEK, Z., ČERNOŠKOVÁA, E. ―The study of the glass transition by the StepScan DSC‖, Journal of Optoelectronics and Advanced Materials, v. 7, n. 5, pp. 2671-2676, 2005. [32] HOLUBOVÁ, J., ČERNOŠKOVÁ, E., ČERNOŠEK, Z. ―StepScan DSC‖, Journal of Thermal Analysis and Calorimetry, v. 111, n. 2, pp. 1633-1638, 2013.
[33] BARNES, H. A., HUTTON, J. F., WALTERS, K., An introduction to rheology, Amsterdam, Elsevier, reimp. 2005.
[34] NORMAND, V., MULLER, S., RAVEY, J.C., et al. ―Gelation Kinetics of Gelatin: A Master Curve and Network Modeling‖, Macromolecules, v. 33, n. 3, pp. 1063-71, 2000.
[35] RONSIN, O., CAROLI, C., BAUMBERGER, T., et al. ―Interplay between Shear Loading and
Structur-al Aging in a PhysicStructur-al Gelatin Gel‖, Phys. Review Lett. v.103, n.13, pp. 138302/1-138302/4, 2009.