Production, 28, e20180050, 2018 DOI: 10.1590/0103-6513.20180050 ISSN 1980-5411 (On-line version)
Thematic Section - Knowledge Management and Learning Organization: Academic Contributions
This is an Open Access article distributed under the terms of the Creative Commons Attribution License, which
1. Introduction
Absorptive Capacity (AC) is one of the most influential concepts in management literature. First introduced by Cohen & Levinthal (1989) and then developed by Zahra & George (2002) when it comes to learning and innovation on a company, and currently is a key word for a variety of strategies, routines and learning processes that influence the company’s ability to exploit the external knowledge needed to build other organizational capacities (Todorova & Durisin, 2007; Zahra & George, 2002).
The diffusion and acquisition of knowledge determine companies’ potential for innovation (Griliches, 1998). However, Absorptive Capacity is necessary to understand and transform external knowledge flows, essential to achieve innovation and growth of companies (Cohen & Levinthal, 1990). It is noteworthy that the focus of many studies is about organizational factors that facilitate or inhibit the transfer process, including the organization’s Absorptive Capacity (Gonzales & Martins, 2015).
Analysis of absorptive capacity and foreign direct
investment in the productivity of
Brazilian municipalities
Diogo Ferraza,b*, Naijela Janaina da Costac, Bruno Fernandesc, Eduardo Polloni Silvac,
Pedro Henrique Mendonça Marquesc, Herick Fernando Morallesc, Daisy Rebelattoa
aUniversidade de São Paulo Escola de Engenharia de São Carlos, São Carlos, SP, Brasil
bUniversität Hohenheim, Guest Researcher at the Institut für Volkswirtschaftslehre, Innovationsökonomik, Germany cUniversidade Federal de São Carlos, Departamento de Engenharia de Produção, São Carlos, SP, Brasil
Abstract
Paper aims: to measure the impact of Foreign Direct Investment (FDI) and Absorptive Capacity (AC) on productivity in Brazil.
Originality: no articles were found using the AC as moderator of FDI in Brazil.
Research method: the Malmquist Index was employed and the Feasible Generalized Least Squares (FGLS) model was chosen, which has greater robustness for correcting the heterocedasticity and autocorrelation.
Main findings: productivity is more impacted by FDI than Economic Complexity. There is a two-year time lag to the impact of the FDI on productivity. The interaction between FDI and AC becomes positive only when experience and schooling are controlled. The number of PhD employees was better as proxy for AC than R&D workers.
Implications for theory and practice: there was no positive relationship between productivity and the number of higher education professionals.
Keywords
Malmquist index. Economic complexity. Higher education. Panel Data.
How to cite this article: Ferraz, D., Costa, N.J., Fernandes, B., Silva, E. P, Marques, P. H. M., Moralles, H. F. & Rebelatto, D. (2018). Analysis of absorptive capacity and foreign direct investment in the productivity of Brazilian municipalities. Production, 28, e20180050. https://doi.org/10.1590/0103-6513.20180050
Lapan & Bardhan (1973) argue that companies need a certain level of Absorptive Capacity before they can benefit from technologies developed by other companies. Cohen & Levinthal (1989) argue that increasing Research and Development (R&D) activity increases efficiency indirectly, making it faster to assimilate technologies developed elsewhere.
The ability to attract FDI, according to Sari et al. (2016), can bring great benefits to a receiving country, since incoming multinational corporations provide direct and indirect benefits to the host country’s economy.
The direct benefits of foreign subsidiaries can take form as new investments, productive capacity, demand for labor, demand for intermediate goods and, sometimes, exports that stimulate national income or economic growth, providing new opportunities and increasing tributary revenue (Takii, 2005).
In organizations, knowledge is already taken for granted as a strategic asset, as well as an explanatory variable for its performance and growth (Grant, 1996). Given this context, Foreign Direct Investment (FDI) generates effects on the productivity of sectors that receive FDI directly, thus, it is believed that FDI is a determining factor for increasing productivity and efficiency.
Therefore, in an increasingly globalized and dynamic world, it is necessary to analyze the impact of FDI on receiving economies, especially the effects related to economic growth. Many papers such as Ubeda & Pérez (2017), Li-Ming et al. (2016), Kim (2015), Girma (2005) investigated whether the effects of FDI on productivity growth depends on Absorptive Capacity.
Miguelez & Moreno (2015) affirm that Absorptive Capacity is an essential element for the regions to make the most out of the knowledge and information flows that arrive, allowing them to obtain productivity gains and competitive advantages.
In addition to the effects of Foreign Direct Investment and Absorptive Capacity, several studies have demonstrated the importance of productive diversification on the countries’ economies (Hidalgo & Hausmann, 2009; Hartmann, 2014). Economic Complexity is an explanatory factor of productivity because it considers that the goods produced are generated from the knowledge available in a region. Therefore, for a region to be more complex, there must be knowledge, more skilled workers and technology, factors that increase productivity and generate economic growth.
Given this context, the aim of this article is to measure the impact of Foreign Direct Investment and Absorptive Capacity on Productivity of 106 Brazilian cities between 2010 and 2014. In this context, the problem to be investigated is: How much is the impact of the FDI on municipal level productivity in Brazil? Is there a time lag to FDI affects productivity? Is there an interaction effect between FDI and Absorptive Capacity on productivity? Does the FDI impact productivity more than the region’s complexity?
This article analyzes the causality between FDI, absorptive capacity and economic complexity over productivity. The FDI and absorptive capacity contribute to increase productivity because greater external investment helps in the emergence of new businesses and products, as absorptive capacity assists in the introduction of new practices or techniques in companies. However, we argue that there is an interaction between FDI and AC, because productivity increase would require more investment and also available knowledge. This is the phenomenon that this article seeks to analyze in order to investigate the importance of both practices on the economy.
Foreign Direct Investment (FDI) has increased significantly over the past two decades. This significant increase has received special attention in discovering the relation between the inflow of FDI and economic growth in the receiving country. Thus, it is important to find out not only the factors that impact the incoming volume of FDI in a given economy, but also the effects of such capital on economic growth of the receiving region, since these impacts may be conditioned to the host AC that may directly affect regional productivity.
Thus, the article presents an econometric model for FDI and productivity moderated by AC, as well as comparing models and AC proxies through Information Criteria. Likwise, the investigation is able to detected which is the best model that explains the productivity, and further analyzing the best proxy for AC. This paper also contributes to verify if there is an interaction between FDI and AC and to compare the impact of FDI for Economic Complexity, which directly influences policy recommendations for the problem investigated.
The present paper is organized in five sections besides this introduction. The second and third sections present the theoretical reference on FDI and its relation with productivity, respectively. In the fourth section there is the research method and in the fifth section the results and discussions. Finally, the main considerations are found in the sixth section of this paper.
2. Foreign direct investment and absorptive capacity
The Foreign Direct Investment, according to Anyanwu (2017), can be a catalyst for economic diversification, helping to overcome countries in relation to excessive dependence on natural resources. In addition, the FDI is an important form of long-term capital, which aids investment in infrastructure and other initiatives for economic development.
International investments can be classified as direct investments and portfolio investments. External investments in portfolio correspond to capital flows that are not oriented towards the operational control of the company that receives external capital. On the other hand, FDI refers to an investment that seeks to acquire a lasting interest in a company whose exploration takes place in another country (International Monetary Fund, 1998). In addition, the OECD considers a foreign investment to be a direct investment when it holds a capital holding of at least 10% and may influence the management of the receiving enterprise (Organisation for Economic Co-operation and Development, 1987).
The ability to attract FDI can bring great benefits to the receiving country as incoming multinational corporations provide direct and indirect benefits to the host economy. The direct benefits of foreign affiliates can take the form of new investments, productive capacity, demand for labor, demand for intermediate goods and sometimes exports that stimulate national income or economic growth, provide new opportunities and increase tax revenue (Takii, 2005).
The determinants of the FDI are evaluated based on the microeconomic variables which are directly related to the firm’s performance, in addition to the macroeconomic and institutional variables, which show the specific factors of the receiving country of foreign investments. Thus, the theory of industrial organization represents a change in the definition of determinants of FDI (Santos et al., 2015).
The main determinants of external investments in productive activity are characterized by the sources of raw materials, transport structure or costs, by the factorial endowment of countries or, ultimately, by comparative advantages as Krugman & Obstfeld (2010) report. There are also other factors that encourage the attraction of FDI, which are the employed technological level, vertical production processes, market size, institutional and macroeconomic stability.
The paper of Economou et al. (2017) examined the determinants of FDI flow in 24 OECD countries and 22 developing (non-OECD) countries using standard fixed effects panel as well as a dynamic panel approach. The first set of empirical results indicates market size, trade openness, unit labor cost, schooling, taxation, gross capital formation and institutional variables as important determinants of FDI for OECD countries. The relevant results for the sample of developing countries indicate the size of the FDI market, labor cost, gross capital formation and institutional variables as significant determinants of FDI.
Kumari & Sharma (2017) analyzed the main determinants affecting the flow of FDI in developing countries using an unbalanced panel data set (1990-2012). The findings reveal that market size, trade openness and human capital have a positive association with FDI inflows. This study has significant implications for policy makers, managers and investors. Policy makers will be able to understand the importance of the key determinants of FDI mentioned in the document and take steps to formulate policies that encourage FDI.
According to Kim (2015), the AC may act as a role to alleviate the negative effects of the FDI on a company’s productivity. In fact, studies have suggested the existence of positive knowledge spillovers linked especially to technology and its impacts on other related variables, as well as negative effects of spillover (Lewison, 1991; Howells, 2005).
3. Productivity and FDI
Productivity measures the degree of efficiency with which a given economy uses its resources to produce consumer goods and services (Messa, 2013). Increasing productivity is the fastest way to achieve economic growth and social welfare, since such production gains reflect the full effectiveness of the productive sector as well as a society’s degree of development (Felema et al., 2013).
Thus, a greater the Economic Complexity Index (ECI) of the countries means that the economy is more diversified, products with higher technology emerge and more skilled workers are hired. This directly affects productivity (Hidalgo & Hausmann, 2009; Hartmann, 2014). In this context, the first hypothesis follows:
H1: ECI positively impacts Brazil’s municipal level productivity.
Thus, Total Factor Productivity (TFP) is intended to indicate how efficiently the economy combines all its resources to generate output. From this conceptualization, the dynamics of the indicator is a result of local technological progress (Messa, 2013).This means getting more output with the same amount of resources employed or using fewer resources to achieve the same production level.
The concept of TFP is also applied to explain why one country develops more than the other, as the development and average income of people can be credited to the efficient use of inputs.
According to Porcile et al. (2005), TFP stands out among productivity indicators because it is a multifactor indicator. The TFP allows us to identify and dissociate the share of output change that can be attributed to efficiency gains and the share that can be attributed to the accumulation of inputs (capital, labor, and human capital).
TFP can be calculated using the Malmquist Index (MI). Several papers have employed the Malmquist Index as a proxy for TFP, such as Cao et al. (2017), Mu et al. (2017), Fu & Ji (2017) and Chen et al. (2016).
MI was initially suggested for analyzes of input use (Malmquist, 1953), and was subsequently applied in a productivity context by Caves et al. (1982) and, in addition to Farrell’s (1957) ideas on efficiency measures, led to the Malmquist productivity index developed by Färe et al. (1994). The first paper written by Aigner & Chu (1968) applied linear programming methods to the analysis of panel data of the social area and then measures of growth of the TFP as the sum of the component of change of efficiency and technical change (Coelli et al., 1998).
Caves et al. (1982) emphasize MI’s ability to measure temporal changes in total productivity of production factors in terms of efficiency changes and technological changes, relative to the units considered. As described by Färe et al. (2004), total productivity is defined by the changes of the factors of production as changes in the total product generated from the various inputs used, and define the technological changes as movements of the efficiency frontier in a given period.
Thus, it can be said that the advantage of using this variable as a proxy for TFP is that it evaluates the productivity indexes over time, decomposing them into indexes that capture variation of technical efficiency and technological changes.
The authors Dupasquier & Osakwe (2003), Anyanwu (2006), Abor et al. (2008) and Inekwe (2013) argued that FDI can play an important role in development of countries efforts including the transfer of modern technologies and the enhancement of local workforce skills, resulting in increased productivity.
Girma (2005) reports that negative impacts on TFP are due to the allocation of FDI in AC. Lucas (1988) shows that FDI flows contribute to economic growth in recipient countries, increasing capital stock and repercussions. The repercussions of FDI can increase the stock of knowledge in investor countries (Li & Liu, 2005). However, there is a maturation period to allow the inflow of foreign financial resources to positively impact productivity. From this evidence, one can elaborate the hypotheses:
H2: FDI and productivity are directly proportional for Brazilian municipalities.
H2a: The FDI time lag is statistically significant and makes the model more robust to explain productivity. The H2 and H2a hypotheses are important for future policy recommendations because if this relationship is proven for Brazil and depending on the size of the impact of complexity and the FDI on productivity, public policy makers can develop mechanisms to increase complexity or to bring foreign investment into the country.
Coming from that concept, literature has argued that productivity gains will be tied to AC and innovative classes’ learning. In this way, innovative producers are more receptive to new technologies and thus are able to maximize gains and reduce costs (Felema et al., 2013). In this way, another hypothesis is corroborated:
H3: FDI moderated by AC has a more significant effect than FDI without being moderate.
In this sense, Hypothesis 3 can demonstrate that it is not enough to develop mechanisms to increase complexity and receive more external resources. This is because the AC is necessary to raise productivity. In this sense, in addition to the financial capital needed to generate more productivity, it would also be necessary to guarantee the existence of human capital (education, workers with doctorates, or R&D workers).
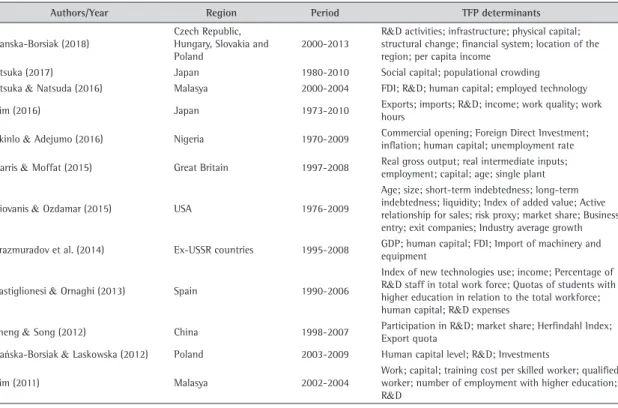
Table 1 shows some determinants of the TFP selected in the literature in order to help choosing the control variables of the model of this paper.
According to the determinants of productivity raised by the literature, some hypotheses can still be proposed according to the availability of data:
In this sense, hypotheses 4 and 5 may show the need to control some characteristics of workers in order to obtain better econometric estimates.
4. Method
This section presents the research method applied in the development of the research, the study population, definition of the variables, as well as the description of the Malmquist Index and econometric models.
4.1. Data
This article used macroeconomic variables from 106 Brazilian cities (see the Annex 1), randomly selected and which had exporting companies between 2010 and 2014. This unique database differentiates this article from other studies previously developed, since few studies on this topic have been developed in the cities of Brazil and other emerging economies.
The selected cities that are representative of all Brazilian regions are described in Annex 1. It is worth noting that, of the whole sample, 48.11% (51 cities) belong to the Southeast region, 29.25% (31 cities) to the South region, 13.21% (14 cities) to the Northeast, 6.60% (7 cities) to the Central-West region, and 2.83% (3 cities) to the North.
To achieve the proposed goal, two steps are required: Calculating the Malmquist Index; and the estimation of econometric models. The data were collected from the Instituto Brasileiro de Geografia e Estatística (IBGE), Instituto de Pesquisa Econômica Aplicada (IPEA), Fundação SEADE, and Relação Anual de Informações Sociais (RAIS/MTE).
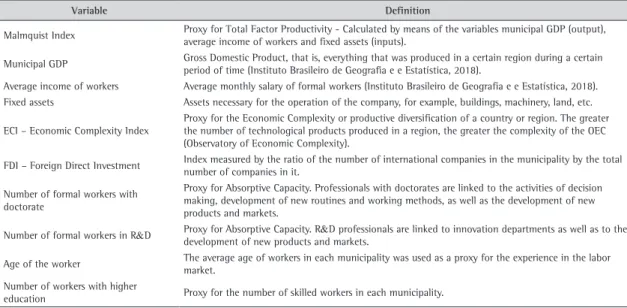
The definitions of the variables used in each step are given in Table 2.
4.2. The malmquist index
This paper had as its first step the calculation of the Malmquist Index, used as a proxy for Total Factor Productivity (TFP).
Table 1. TFP determinants according to literature.
Authors/Year Region Period TFP determinants
Danska-Borsiak (2018)
Czech Republic, Hungary, Slovakia and Poland
2000-2013
R&D activities; infrastructure; physical capital; structural change; financial system; location of the region; per capita income
Otsuka (2017) Japan 1980-2010 Social capital; populational crowding Otsuka & Natsuda (2016) Malasya 2000-2004 FDI; R&D; human capital; employed technology
Kim (2016) Japan 1973-2010 Exports; imports; R&D; income; work quality; work hours
Akinlo & Adejumo (2016) Nigeria 1970-2009 Commercial opening; Foreign Direct Investment; inflation; human capital; unemployment rate
Harris & Moffat (2015) Great Britain 1997-2008 Real gross output; real intermediate inputs; employment; capital; age; single plant
Giovanis & Ozdamar (2015) USA 1976-2009
Age; size; short-term indebtedness; long-term indebtedness; liquidity; Index of added value; Active relationship for sales; risk proxy; market share; Business entry; exit companies; Industry average growth
Arazmuradov et al. (2014) Ex-USSR countries 1995-2008 GDP; human capital; FDI; Import of machinery and equipment
Castiglionesi & Ornaghi (2013) Spain 1990-2006
Index of new technologies use; income; Percentage of R&D staff in total work force; Quotas of students with higher education in relation to the total workforce; human capital; R&D expenses
Sheng & Song (2012) China 1998-2007 Participation in R&D; market share; Herfindahl Index; Export quota
Dańska-Borsiak & Laskowska (2012) Poland 2003-2009 Human capital level; R&D; Investments
Kim (2011) Malasya 2002-2004
The Malmquist Index, originally proposed by Malmquist (1953) and Caves et al. (1982), has the purpose of comparative analysis of the relative performance of a set of Decision Making Units (DMUs) - namely, the municipalities, in adjacent periods of time, when appropriating the respective data of inputs and products of a base period - is therefore the elaboration of an index number applied to the performance analysis (Färe et al., 2004).
As described by Färe et al. (2004), we define the changes of Total Factor Productivity as changes in the total product generated from the various inputs used, and define the technological changes as efficiency frontier movements in a given period of time. In this way, the modification of the first one is decomposed by the changes computed in efficiency and in technology, as described in Equation 1:
TA EA
ATFP = X (1)
Given that the Malmquist Index (MI) - representing the Alteration in the Total Factor Productivity, ATFP, of a DMU, over a certain period of time - TA, Technological Alteration - measured from the change of the efficiency frontier in the same time interval - and EA, the Efficiency Alteration - measured from the change in the relative performance of a DMU, in the same time horizon considered for the other components.
In a complementary manner, Färe et al. (2004) demonstrate that it is possible to specify the calculation of Total Factor Productivity changes from an integrated perspective between the Malmquist Index and the Data Envelopment Analysis (DEA) models. The DEA, in turn, is a non-parametric approach with a mathematical programming model, which is often used to evaluate the relative efficiency of units with multiple inputs and outputs (Ferreira & Gomes, 2009).
In this way, the index can be calculated by Equation 2:
(
)
(
)
(( )) ((
)
), , , ,
MI= ( ).( ) TA*EA
, ,
, ,
, ,
t t t t t
T
t t t
D x v y v D x v y v D x v y v
D x v y v
D x v y v
D x v y v
° ° ° °
=
° ° °
° ° (2)
On what:
MI = Malmquist Index;
D° = Distance function relative to the period 0 border; Dt = Distance function relative to the boundary of period t; y°v = Quantity of DMU virtual output under analysis in period 0; x°v = DMU virtual input quantity under analysis in period 0; ytv = Quantity of DMU virtual output under analysis in period t; xtv = Quantity of virtual input of the DMU under analysis in period t;
Table 2. Variables used in the two steps.
Variable Definition
Malmquist Index Proxy for Total Factor Productivity - Calculated by means of the variables municipal GDP (output), average income of workers and fixed assets (inputs).
Municipal GDP Gross Domestic Product, that is, everything that was produced in a certain region during a certain period of time (Instituto Brasileiro de Geografia e e Estatística, 2018).
Average income of workers Average monthly salary of formal workers (Instituto Brasileiro de Geografia e e Estatística, 2018). Fixed assets Assets necessary for the operation of the company, for example, buildings, machinery, land, etc.
ECI – Economic Complexity Index
Proxy for the Economic Complexity or productive diversification of a country or region. The greater the number of technological products produced in a region, the greater the complexity of the OEC (Observatory of Economic Complexity).
FDI – Foreign Direct Investment Index measured by the ratio of the number of international companies in the municipality by the total number of companies in it.
Number of formal workers with doctorate
Proxy for Absorptive Capacity. Professionals with doctorates are linked to the activities of decision making, development of new routines and working methods, as well as the development of new products and markets.
Number of formal workers in R&D Proxy for Absorptive Capacity. R&D professionals are linked to innovation departments as well as to the development of new products and markets.
Age of the worker The average age of workers in each municipality was used as a proxy for the experience in the labor market.
Number of workers with higher
D0(x0v,y0v) = Distance from the DMU in period 0 relative to the border of period 0; D0(xtv,ytv) = Distance from the DMU in period t relative to the border of period 0; Dt(x0v,y0v) = Distance from the DMU in period 0 relative to the border of period t; Dt(xtv,ytv) = Distance from the DMU in period t relative to the border of period t; TA = Technological Alterations of a DMU between periods 0 and t; and, EA = Efficiency Alterations of a DMU between periods 0 and t.
The results offer subsidies for the productivity analysis, since they allow to identify if there was increase in technological progress, improvement in the total efficiency of the DMU, or both. Thus, this procedure becomes appropriate to identify if the changes in the development of an environment were related to the technological changes or the total productivity of the factors of production of the DMUs, which in this case are the municipalities. One can say that technological change is a set of possible combinations that expand or contract, determined by the technology environment.
In order to calculate IM, two inputs (Average income of workers and capital assets) and one output (municipal GDP) will be used, with orientation to the output CRS (Constant Returns to Scale), since it is possible to establish proportionality between inputs and outputs, that is, to increase GDP with the increase of Income and Capital (Cao et al., 2017; Mu et al., 2017; Fu & Ji, 2017; Chen et al., 2016).
4.3. Econometric models
The multiple regression analysis, according to Gujarati & Porter (2011), concerns the prediction of the dependent variable based on two or more independent variables. In this way, the form of the multiple linear equation is an extension of simple linear regression, in which other variables (X1, X2, ...) are inserted. Equation (3) of the multiple regression is defined by:
0 1 1 ... n n
Y=β +βX + β X + ∈ (3)
In which Y represents the dependent variable and X1 ... Xn represent the explanatory variables, ε represents the experimental error (independent random errors), and β0, β1 and β2 are the regression coefficients.
It is worth mentioning that the dependence of a variable Y (the dependent variable) on other X variables (the explanatory variable) is rarely immediate. Too often, Y responds to X with time lapses. This lapse is called time lag (Gujarati & Porter, 2011). Thus, some variables were lagged to analyze the maturation time for impact on the productivity of the municipalities.
In order to test the hypotheses elaborated in the previous section, the following panel data econometric models were formulated using log-linear regressions, since it is possible to interpret parameters as elasticities.
Model 1: ECI positively impacts Brazil’s municipal level productivity (H1) and FDI and productivity are directly proportional for Brazilian municipalities (H2)
0 1 2
MI
it it it it
lny = β +βlnECI +βlnFDI +ε (4)
Model 2: The FDI time lag is statistically significant and makes the model more robust to explain productivity (H2a)
0 1 2 3 1 4 2
MI
it it it it it it
lny = β +βlnECI +βlnFDI +βlnFDI − +βlnFDI − +ε (5)
Model 3 and 4: FDI moderated by AC has a more significant effect than FDI without being moderate (H3)
0 1 2 *3
MI
it it it it it
lny =β +βlnECI +βlnFDI +βlnFDI AC +ε (6)
0 1 2 *3
MI
it it it it it
lny =β +βlnECI +βlnFDI +βlnFDI AC +ε (7)
For model 3, the number of professionals with a PhD is considered to be the CA proxy, and for model 4, the number of R&D professionals in the municipality.
Model 5: The average age of workers has a significant impact on productivity (H4) and the number of workers with higher education has an impact on productivity (H5)
0 1 2 3 * 4 5 .
MI
it it it it it it it
In what: The lnMI is Malmquist Index; lnECI represents the municipality’s Economic Complexity Index; lnFDI is the natural logarithm of Foreign Direct Investment; lnFDI*CA represents the Direct Foreign Investment moderated by Absorptive Capacity (as proxy for Absorptive Capacity, the number of professionals with a PhD and the number of R&D professionals available in the municipality were used: directors, managers and technicians); lnAGE represents the average age of workers in the municipality; lnSCHOOL represents the level of schooling (number of workers with higher education).
4.3.1. Panel data technique
In panel data, the same cross-sectional unit is monitored over time. In summary, panel data have a spatial and a temporal dimension (Gujarati & Porter, 2011). In this way, as this paper includes the time limit from 2010 to 2014 for several municipalities, it is therefore a balanced panel analysis.
Panel analysis can be performed through two basic models: Fixed and Random Effects models. The Fixed-Effect model removes time invariant characteristics of the explanatory variables so that the liquid effect can be analyzed, while the Random Effects model has the same assumptions as the fixed effects model, that is, the intercept varies from one individual to another, but not over time, and the response parameters are constant for all individuals and for all periods of time (Gujarati & Porter, 2011).
In the fixed-effects model, the Least Square Dummy Variable (LSDV) estimator will be consistent and efficient (Holland & Xavier, 2005). Each individual in the sample has its own characteristics that may or may not influence the explanatory variables. Thus, it is assumed that some information may provide bias or impair the explicability of the variables (Greene, 2011). On the other hand, the RE model assumes that there is no correlation between the individual effects and the other random variables, and its estimation is carried out through Generalized Least Squares (GLS) (Holland & Xavier, 2005).
According to the assumptions of the econometric models, the error term (εit) must have a constant variance and the error terms should not be correlated with each other. Accordingley, the violation of these hypotheses may induce autocorrection and heteroscedasticity (Greene, 2011).
Thus, this paper applies more advanced econometric techniques to correct these problems for panel data, since the hypothesis of time lags for the FDI can induce to severe autocorrelation. Thus, Feasible Generalized Least Squares (FGLS) method is chosen, which incorporates an AR (1) structure at the stochastic disturbance (Greene, 2011).
Another problem of econometric models is multicollinearity. Multicollinearity is defined as the presence of a high degree of correlation between the independent variables (Freund et al., 2006). To verify the presence of multicollinearity, the VIF (Variance Inflation Factors) test was calculated. The FIV can be calculated by the following equation:
2
1 1 J VIF
Rj =
− j = 1,2, ...,p (9)
Where: p is the number of predictor variables; 2
j
R is the multiple correlation coefficient, resulting from the regression of Xj in the other p-1 regressors.
The choice of the appropriate model from the statistical point of view is an extremely important topic in data analysis (Bozdogan, 1987). In order to compare the robustness of each model, Akaike Information Criterion (AIC) and the Bayesian Information Criterion (BIC) (Akaike, 1973, 1974; Schwarz’s, 1978; Judge et al., 1985) was employed. The model with lower value of AIC and BIC is considered the best fit model.
Finally, we emphasized that all the estimates and statistics present in the aforementioned method were calculated through Matlab® and Stata® softwares.
5. Results and discussion
Through the Variance Inflation Factor (VIF) test, there was no evidence of multicollinearity. Besides that, we performed the White Test before measuring the regressions to verify the presence of heteroscedasticity (Greene, 2011). We found autocorrelation and heteroscedasticity in our estimations. For this reason, we estimate our models through the Feasible Generalized Least Squares (FGLS) procedure that incorporates an AR (1) structure at the stochastic disturbance.
for FE estimation, the FGLS model has greater robustness by correcting heterocedasticity and autocorrelation in the model.
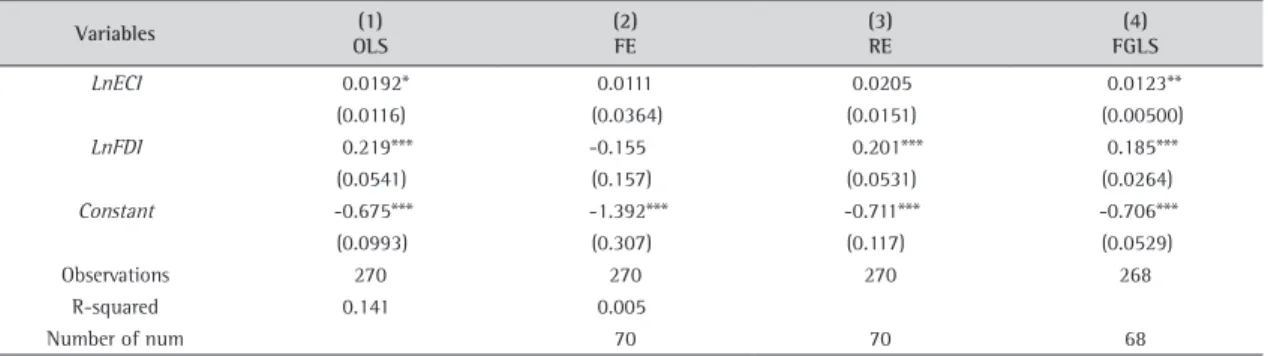
Model 1 measured the effect of Economic Complexity and Foreign Direct Investment on productivity. The estimates show that the Economic Complexity positively impacts (1.23%) the productivity of the Brazilian municipalities, presenting statistical significance of 5%. This result confirms the Hypothesis 1 proposed in this study and agrees with previous results found by Felema et al. (2013).
Economic Complexity is related to greater capacity of production of goods, and in a diversified environment workers are more engaged and willing to deliver than expected by people, and conflicts that can hinder productivity are less recurrent.
Another result for Model 1 is the FDI analysis, which has a positive impact (18.5%) on productivity, and a statistical significance of 1%, which confirms the Hypothesis 2: FDI and the Malmquist index are directly proportional. Note that FDI has a greater impact on productivity than the complexity of municipalities. This is an important result, since it demonstrates that Foreign Direct Investment in the Brazilian regions is an important determinant for the increase of productivity.
This result also shows that there is a greater effect of FDI on productivity than Economic Complexity. For this reason, estimates show that it is more important to develop public policies that encourage the entry of foreign capital, as a way of generating new businesses, markets and products. The indirect effect of this policy would also be to increase the Economic Complexity and its impact on productivity, in view of the productive diversification and the spillover effect in the regions.
Our results corroborate with the studies by Girma (2005), Sari et al. (2016), Liu (2008), Pessoa (2008), Baldwin et al. (2005), Takii (2005) and Javorcik (2004), which indicate that Foreign Direct Investment generates improvements in the use of technologies, management methods, new product and process development, knowledge transfer and corporate productivity.
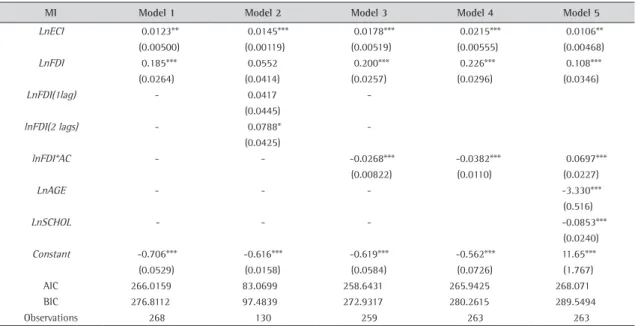
The results of the other models are shown in Table 4. Model 2 analyzed the time lags effect for FDI in relation to productivity. Estimates show that by controlling the dissipation of the FDI effect on productivity, the FDI of year zero maintains the expected signal but loses statistical significance. In the analysis of the 1 year lag time, the effect is not statistically significant. Only after two years of the entry of Foreign Direct Investment, that is, the lag team of 2 years, there is statistical significance of 10% and positive impact (0.0788).
This result confirms Hypothesis 2a of this study, since when comparing the information criteria of Model 1 (AIC = 266.0159 and BIC = 276.8112) with model 2 (AIC = 83.0699 and BIC = 97.4839), it is verified that the Model 2 further explains the phenomenon between FDI and the Malmquist Index, showing greater robustness.
Thus, it is possible to say that there is a maturation period so that the inflow of financial resources from abroad has a significant impact on the productivity of municipalities. It is also possible to argue that two types of public policies can be developed in Brazil. First, a short-term policy, focused on raising Economic Complexity and productive diversification, which has an immediate effect on the economy. Second, a medium-term policy (two-year time lag), so that the inflow of foreign capital would generate more productivity. Combined, these policies would raise productivity by 9.33%.
According to the results of models 3 and 4, FDI moderated by Absorptive Capacity (proxies of number of professionals with doctorates and number of R&D professionals, respectively) although presented high statistical significance (1%) for both models, the obtained signal was not what expected, which refutes the Hypothesis 3
Table 3. Estimates for MI and FDI (Model 1).
Variables (1)
OLS
(2) FE
(3) RE
(4) FGLS
LnECI 0.0192* 0.0111 0.0205 0.0123**
(0.0116) (0.0364) (0.0151) (0.00500)
LnFDI 0.219*** -0.155 0.201*** 0.185***
(0.0541) (0.157) (0.0531) (0.0264)
Constant -0.675*** -1.392*** -0.711*** -0.706***
(0.0993) (0.307) (0.117) (0.0529)
Observations 270 270 270 268
R-squared 0.141 0.005
Number of num 70 70 68
of this study, which proposes that FDI moderated by AC has a more significant effect than FDI without being moderate. However, note that in both models the isolated FDI impact was higher than in the previous models, respectively, 20% and 22.6%.
However, in the analysis of the Information Criteria of models 3 and 4, model 3 (AIC = 258.6431 and BIC = 272.9317), when compared to model 4 (AIC = 265.5425 and BIC = 280.2615), explains the relationship between the FDI moderated by AC with the Malmquist Index. Thus, it is possible to infer that the variable number of workers with doctorates presents themselves as CA’s best proxy. In companies, the doctoral professional can help entrepreneurs gain insights from data, assisting in better business decisions and predicting trends, since they position themselves strategically among competitors.
It is worth mentioning that AC measurement is very complex because it deals with stored knowledge and, therefore, other variables may be interesting to measure it, given the lack of availability of data for the analyzed years.
The negative and statistically significant sign of the interaction between FDI and AC shows that the greater the number of professionals with doctorates or R&D workers combined with the inflow of foreign capital generates lower productivity. Some possible explanations for this result are: 1 - due to the labor costs of this type of professionals, which does not justify the productivity generated; 2 - the innovation generated by R&D professionals have not justified the productivity found in Brazilian municipalities; and, 3 - professionals with higher education have not generated the expected productivity in the economy.
To solve this problem, Model 5 isolated some characteristics of the workers. The experiment was used as an explanatory variable of productivity. The proxy used for the experiment was the age of the workers. We also isolate the effect of education on productivity by using the number of R&D workers as proxy for Absorptive Capacity.
For model 5, it can be stated that both the mean age and the number of professionals with higher education presented with high statistical significance (1%), but with an opposite sign than expected, which does not prove the hypotheses H4 and H5.
The average age of workers, used as a proxy for the workers’ experience, showed a negative correlation, that is, an increase in the work experience does not positively affect productivity. Thus, other worker factors can be analyzed such as employee satisfaction, organizational commitment and management skill. It may also be due to the fact that workers with a higher average age have greater difficulties in absorbing new technologies, which negatively affects the productivity of municipalities.
Regarding the educational level, the estimates showed that the number of workers with higher education has no significant effect on the increase of the Malmquist index. This can be explained by the fact that there are few professionals in the area of Exact Sciences in the country, which results in the market demand for the
Table 4. Estimates for the FGLS models.
MI Model 1 Model 2 Model 3 Model 4 Model 5
LnECI 0.0123** 0.0145*** 0.0178*** 0.0215*** 0.0106**
(0.00500) (0.00119) (0.00519) (0.00555) (0.00468)
LnFDI 0.185*** 0.0552 0.200*** 0.226*** 0.108***
(0.0264) (0.0414) (0.0257) (0.0296) (0.0346)
LnFDI(1lag) - 0.0417
-(0.0445)
lnFDI(2 lags) - 0.0788*
-(0.0425)
lnFDI*AC - - -0.0268*** -0.0382*** 0.0697***
(0.00822) (0.0110) (0.0227)
LnAGE - - - -3.330***
(0.516)
LnSCHOL - - - -0.0853***
(0.0240)
Constant -0.706*** -0.616*** -0.619*** -0.562*** 11.65***
(0.0529) (0.0158) (0.0584) (0.0726) (1.767)
AIC 266.0159 83.0699 258.6431 265.9425 268.071
BIC 276.8112 97.4839 272.9317 280.2615 289.5494
Observations 268 130 259 263 263
training of professionals with qualification fundamentally in the areas of Engineering, Physics, Statistics, among others related.
It is emphasized that the inadequacy of the workforce in relation to the functions is among the causes of a structural problem of the country whose solution is essential for the resumption of growth: low labor productivity. The indicator that measures the efficiency of a country’s labor force is influenced by factors such as the business environment and the investment in the improvement of productive processes, aspects in which Brazil does not present good results.
In Model 5 it was possible to confirm Hypothesis 3. The interaction between FDI and AC is positive and statistically significant at the 1% level. In addition to the direct effect of FDI (10.8%) and Economic Complexity (1.06%), there is an interaction effect between FDI and AC (6.97%). This means that the greater the number of workers in R&D and Foreign Direct Investment, the higher the productivity of the municipality.
As a policy recommendation, the interaction effect shows that external capital inflows remain the most important variable to increase productivity. However, it is necessary to ensure that there is AC in place in order to increase the productivity of the region. Economic Complexity, FDI and AC together tend to raise productivity by approximately 19%.
6. Final considerations
This article aimed to analyze the impact of FDI and AC on Productivity of 106 Brazilian municipalities between 2010 and 2014, whose productivity was measured by the Malmquist Index, which is characterized by the ability to measure change, in terms of Total Productivity of Factors, between different periods and to decompose this index into technical efficiency and change of technology.
Initially, the positive effect of Economic Complexity and Foreign Direct Investment on productivity was discussed. Understanding that Foreign Direct Investment affects the economy is of great importance for public policy planning and for the efficient allocation of government efforts and resources. Thus, the importance of adopting FDI policies to ensure the continuity of productivity growth and the diffusion of new practices and technologies is highlighted.
However, it is worth mentioning that the FDI lag model points to a maturation period so that the inflow of financial resources from abroad has a significant impact on the productivity of the municipalities. This is because certain investments, such as high technology research projects, require more time to get returns.
Finally, by the analysis, it was verified that the experience of the workers (proxy of the average age of workers) does not positively affect productivity. Thus, it is suggested for future work the inquiry of other factors of the worker that can impact productivity, such as employee satisfaction, organizational commitment and management skills.
As for the level of schooling, estimates have shown that the number of workers with higher education has no significant effect on the increase in the Malmquist index. This can be explained by the fact that there are few professionals in the area of Exact Sciences in the country, which results in the market demand for the training of professionals with qualification fundamentally in this area.
Therefore, FDI moderated by AC proxies was analyzed, although they presented high statistical relevance and did not provide the expected signal (Models 3 and 4). Nevertheless, by the Information Criterion the variable number of professionals with a doctoral degree presented itself as the best proxy of the AC, highlighting the importance of testing other variables as a proxy to the AC.
However, Model 5 showed that after controlling for characteristics of the workers (experience and education) it was possible to find a positive and statistically significant effect for the interaction between FDI and AC. Thus, one of the limitations of this paper was the lack of data availability for AC, such as investments in R&D, a variable that is more commonly used in the literature. It is suggested as future studies the use of other variables for AC in order to compare the results and also to test endogeneity problems.
From the results found, we conclude that the Economic Complexity had a smaller effect on productivity compared to the FDI, which always shown a positive and statistically significant impact on productivity, especially when combined with Absorptive Capacity.
Acknowledgement
The first author acknowledges Coordenação de Aperfeiçoamento de Pessoal de Nível Superior (CAPES) for his funding from Program 6492 – PhD Student CAPES/DAAD/CNPQ / Process nº. 88887.161388/2017-00.
References
Abor, J., Adjasi, C. K. D., & Hayford, M. C. (2008). How does foreign direct investment affect the export decisions of firms in Ghana? African Development Review, 20(03), 446-465. http://dx.doi.org/10.1111/j.1467-8268.2008.00193.x.
Aigner, D. J., & Chu, S. F. (1968). Estimating the Industry Production Function. The American Economic Review, 58, 826-839. Akaike, H. (1973). Information theory and an extension of the maximum likelihood principle. In B. N. Petrov & F. Csaki (Ed.), Second
International Symposium on Information Theory (pp. 267-281). Budapest: Akailseoniai–Kiudo.
Akaike, H. (1974). A new look at the statistical model identification. IEEE Transactions on Automatic Control, 19(6), 716-723. http:// dx.doi.org/10.1109/TAC.1974.1100705.
Akinlo, A. E., & Adejumo, O. O. (2016). Determinants of total factor productivity growth in Nigeria, 1970–2009. Global Business Review, 17(2), 257-270. http://dx.doi.org/10.1177/0972150915619801.
Amal, M., & Seabra, F. (2007). Determinantes do Investimento Direto Externo (IDE) na América Latina: uma perspectiva institucional. Revista Economia, 08(2), 231-247.
Anyanwu, J. C. (2006). Promoting of investment in Africa. African Development Review, 18(01), 42-71. http://dx.doi.org/10.1111/j.1467-8268.2006.00132.x.
Anyanwu, J. C. (2017). Foreign direct investment. In K. A. Reinert (Ed.), Handbook of globalisation and development (Vol. 8, 131-152). Northampton: Edward Elgar Publishing. http://dx.doi.org/10.4337/9781783478651.00015.
Arazmuradov, A., Martini, G., & Scotti, D. (2014). Determinants of total factor productivity in former Soviet Union economies: A stochastic frontier approach. Economic Systems, 38(1), 115-135. http://dx.doi.org/10.1016/j.ecosys.2013.07.007.
Baldwin, R., Braconier, H., & Forslid, R. (2005). Multinationals, Endogenous Growth and Technological Spillovers: Theory and Evidence. Review of International Economics, 13(5), 945-963. http://dx.doi.org/10.1111/j.1467-9396.2005.00546.x.
Basi, R. S. (1963) Determinants of United States private direct investments in foreign countries. Kent State University Press, Kent, Ohio. Bozdogan, H. (1987). Model selection and Akaike’s Information Criterion (AIC): The general theory and its analytical extensions.
Psychometrika, 52(3), 345-370. http://dx.doi.org/10.1007/BF02294361.
Cao, L., Qi, Z., & Ren, J. (2017). China’s industrial total-factor energy productivity growth at sub-industry level: A two-step stochastic metafrontier Malmquist index approach. Sustainability, 9(1384), 1-22. http://dx.doi.org/10.3390/su9081384.
Castiglionesi, F., & Ornaghi, C. (2013). On the determinants of total factor productivity growth: Evidence from Spanish manufacturing firms. Macroeconomic Dynamics, 17(3), 501-530. http://dx.doi.org/10.1017/S1365100511000332.
Caves, D. W., Christensen, L. R., & Diewert, W. E. (1982). The Economic Theory of Index Numbers and the Measurement of Input, Output, and Productivity. Econometrica, 50(06), 1393-1414. http://dx.doi.org/10.2307/1913388.
Chen, L. H., Tang, L., & Ni, W. J. (2016). Analysis of total factor productivity between 2003 and 2014 in tertiary hospitals in Shanghai based on Malmquist index. Journal of Shanghai Jiaotong University, 36(6), 912-916. [Medical Science]
Coelli, T. J., Rao, D. S. P., & Battese, G. E. (1998). An introduction to efficiency and productivity analysis. Boston: Kluwer Academic, 275. http://dx.doi.org/10.1007/978-1-4615-5493-6.
Cohen, W. M., & Levinthal, D. A. (1989). Innovation and Learning: The Two Faces of R & D. Economic Journal, 99(397), 569-596. http://dx.doi.org/10.2307/2233763.
Cohen, W. M., & Levinthal, D. A. (1990). Absorptive Capacity : A New Perspective on and Innovation Learning. Administrattive Science Quarterly, 35(1), 128-152.
Danska-Borsiak, B. (2018). Determinants of total factor productivity in Visegrad Group nuts-2 regions. Acta Oeconomica, 68(01), 31-50. http://dx.doi.org/10.1556/032.2018.68.1.2.
Danska-Borsiak, B., & Laskowska, I. (2012). The Determinants of Total Factor Productivity in Polish Subregions. Panel Data Analysis. Comparative Economic Research, 15(04), 17-29. http://dx.doi.org/10.2478/v10103-012-0023-9.
Dupasquier, C., & Osakwe, P. N. (2003). Performance, promotion, and prospects for foreign investment in Africa: national, regional, and international responsibilities. Paper prepared for the ‘Eminent Persons’ Meeting on ‘Promotion of Investment in Africa, Tokyo. Economou, F., Hassapis, C., Philippas, N., & Tsionas, M. (2017). Foreign Direct Investment Determinants in OECD and Developing
Countries. Review of Development Economics, 21(03), 527-542. http://dx.doi.org/10.1111/rode.12269.
Färe, R., Grosskopf, S., & Lovell, C. A. K. (2004). Production Frontiers (1st ed.). New York: Cambridge University Press.
Färe, R. S., Grosskopf, M. N., & Zhang, Z. (1994). Productivity Growth, Technical Progress and Efficiency Changes in Industrialized Countries. The American Economic Review, 84, 66-83.
Farrell, M. J. (1957). The measurement of productive efficiency. Journal of the Royal Statistical Society, 120(3), 253-290.
Felema, J., Raiher, A. P., & Ferreira, C. R. (2013). Agropecuária brasileira: desempenho regional e determinantes de produtividade. Revista de Economia e Sociologia Rural, 51(3), 555-574. http://dx.doi.org/10.1590/S0103-20032013000300008.
Ferreira, C. M. C., & Gomes, A. P. (2009). Introdução à análise envoltória de dados: teoria, modelos e aplicações. Viçosa: Editora UFV. Freund, R. J., Wilson, W. J., & Sa, P. (2006). Regression analysis – Statistical Modeling of a response variable. San Diego: Elsevier, Inc., 459. Fu, Q., & Ji, F. (2017). Total factor productivity of food manufacturing industry in China: A DEA-Malmquist index measurement. Revista
Giovanis, E., & Ozdamar, O. (2015). Determinants of total factor productivity: Evidence from US Compustat firms and Triadic Patent Families. International Journal of Economics and Business Research, 10(03), 258-272. http://dx.doi.org/10.1504/IJEBR.2015.071845. Girma, S. (2005). Absorptive Capacity and Productivity Spillovers from FDI: A Threshold Regression Analysis. Oxford Bulletin of Economics
and Statistics, 67(03), 281-306. http://dx.doi.org/10.1111/j.1468-0084.2005.00120.x.
Gonzales, R. V. D., & Martins, M. F. (2015). Knowledge Management: an analysis based on organization contextual factors. Production, 25(04), 834-850.
Grant, R. M. (1996). Prospering in dynamically competitive environments: organizational capability as knowledge integrations. Organization Science, 07(04), 375-387. http://dx.doi.org/10.1287/orsc.7.4.375.
Greene, W. H. (2011). Econometric analysis. New York: Prentice Hall.
Griliches, Z. (1998). R&D and Productivity: The Econometric Evidence. The American Economic Review, 84(01), 9-21. Gujarati, D. N., & Porter, D. C. (2011). Econometria básica. (5. ed.). Porto Alegre: AMCG.
Harris, R., & Moffat, J. (2015). Plant-level determinants of total factor productivity in Great Britain, 1997–2008. Journal of Productivity Analysis, 44(01), 1-20. http://dx.doi.org/10.1007/s11123-015-0442-2.
Hartmann, D. (2014). Economic complexity and human development: how economic diversification and social networks affect human agency and welfare. New York: Routledge.
Hidalgo, C. A., & Hausmann, R. (2009). The building blocks of economic complexity. Proceedings of the National Academy of Sciences of the United States of America, 106(26), 10570-10575. http://dx.doi.org/10.1073/pnas.0900943106. PMid:19549871.
Holland, M., & Xavier, C. L. (2005). Dinâmica e competitividade setorial das exportações brasileiras: uma análise de painel para o período recente. Economia e Sociedade (Campinas), 14(1), 85-108.
Howells, J. (2005). Innovation and regional economic development: A matter of perspective? Research Policy, 34(08), 1220-1234. http:// dx.doi.org/10.1016/j.respol.2005.03.014.
Instituto Brasileiro de Geografia e e Estatística. Banco de Tabelas Estatísticas – SIDRA. (2018). Sistema IBGE de Recuperação Automática. Brasília: IBGE. Retrieved in 2018 March 06, from http://https://sidra.ibge.gov.br/home/pms/brasil
International Monetary Fund. (1998). Report on the survey of implementation of methodological standards for direct investment. DAFFE, Statistic Department, 99(14).
Inekwe, J. N. (2013). FDI, employment and economic growth in Nigeria. African Development Review, 25(04), 421-433. http://dx.doi. org/10.1111/1467-8268.12039.
Javorcik, B. S. (2004). Does foreign direct investment increase the productivity of domestic firms? In search of spillovers through backward linkages. The American Economic Review, 94(3), 605-627. http://dx.doi.org/10.1257/0002828041464605.
Judge, G. G., Griffiths, W. E., Hill, R. C., Lutkepohl, H., & Lee, T.-C. (1985). The theory and practice of econometrics. 2nd ed. New York: Wiley.
Kim, M. (2015). Productivity spillovers from FDI and the role of domestic firm’s absorptive capacity in South Korean manufacturing industries. Empirical Economics, 50(04), 807-827. http://dx.doi.org/10.1007/s00181-014-0804-z.
Kim, S. (2011). Factor determinants of total factor productivity growth in the malaysian hotel industry: A stochastic frontier approach. Cornell Hospitality Quarterly, 52(01), 35-47. http://dx.doi.org/10.1177/1938965509341286.
Kim, S. (2016). Factor determinants of total factor productivity growth for the japanese manufacturing industry. Contemporary Economic Policy, 34(03), 572-586. http://dx.doi.org/10.1111/coep.12152.
Krugman, P. R., & Obstfeld, M. (2010). Economia internacional: teoria e política (5. ed.). São Paulo: Makron Books.
Kumari, R., & Sharma, A. K. (2017). Determinants of foreign direct investment in developing countries: a panel data study. International Journal of Emerging Markets, 12(04), 658-682. http://dx.doi.org/10.1108/IJoEM-10-2014-0169.
Lapan, H., & Bardhan, P. (1973). Localized technical progress and transfer of technology and economic development. Journal of Economic Theory, 6(6), 585-595. http://dx.doi.org/10.1016/0022-0531(73)90079-3.
Lewison, G. (1991). The scientific output of the EC’s less favoured regions. Scientometrics, 21(03), 383-402. http://dx.doi.org/10.1007/ BF02093977.
Li, X., & Liu, X. (2005). Foreign direct investment and economic growth: an increasingly endogenous relationship. World Development, 33(03), 393-408. http://dx.doi.org/10.1016/j.worlddev.2004.11.001.
Li-Ming, X., Rui, J., & Rui, J. (2016). Productivity Spillovers from FDI, absorptive capacity and self-innovation capabilities of resource area: Evidence from 1992–2013 in Shanxi, China. Science, Technology & Society, 21(02), 149-180. http://dx.doi.org/10.1177/0971721816640616. Liu, Z. (2008). Foreign direct investment and technology spillovers: Theory and evidence. Journal of Development Economics, 85(1-2),
176-193. http://dx.doi.org/10.1016/j.jdeveco.2006.07.001.
Lucas, R. E. (1988). On the mechanics of economic development. Journal of Monetary Economics, 22(1), 03-42.
Malmquist, S. (1953). Index numbers and indifference surfaces. Trabajos de Estatistica, 4(2), 209-242. http://dx.doi.org/10.1007/ BF03006863.
Messa, A. (2013). Indicadores de produtividade: uma breve revisão dos principais métodos de cálculo. Radar: Tecnologia, Produção e Comércio Exterior, 28, 17-26.
Miguelez, E., & Moreno, E. (2015). Knowledge flows and the absorptive capacity of regions. Research Policy, 44(04), 833-848. http:// dx.doi.org/10.1016/j.respol.2015.01.016.
Mu, M., Tian, Y., & Duan, J. (2017). Impact of overseas listing on total factor productivity: A DEA-malmquist index measurement. Boletin Tecnico/Technical Bulletin, 55(4), 525-530.
Otsuka, A. (2017). Regional determinants of total factor productivity in Japan: stochastic frontier analysis. The Annals of Regional Science, 58(03), 579-596. http://dx.doi.org/10.1007/s00168-017-0808-7.
Otsuka, K., & Natsuda, K. (2016). The determinants of total factor productivity in the malaysian automotive industry: are government policies upgrading technological capacity? The Singapore Economic Review, 61(04), 1550046. http://dx.doi.org/10.1142/S0217590815500460. Pessoa, A. (2008). Multinational corporations, foreign investment, and royalties and license fees: effects on Host-Country Total Factor
Productivity. Notas Económicas, 28, 6-31.
Porcile, G., Vaz Sampaio, A., & Curado, M. (2005). Produtividade total dos fatores: aspectos teóricos e evidências brasileiras. Economia e Tecnologia, 3, 91-100.
Santos, J., Triches, D., & Godoy, M. R. (2015). O desempenho do fluxo de investimento direto externo internacional e nos BRICs. Política Externa, 24(01-02), 1-14.
Sari, D. W., Khalifah, N. A., & Suyanto, S. (2016). The spillover effects of foreign direct investment on the firms’ productivity performances. Journal of Productivity Analysis, 46(02-03), 199-233.
Schwarz, G. (1978). Estimating the dimension of a model. Annals of Statistics, 6(2), 461-464. http://dx.doi.org/10.1214/aos/1176344136. Sheng, Y., & Song, L. (2012). China’s iron and steel industry performance: Total factor productivity and its determinants. The Chinese
Steel Industry’s Transformation: Structural Change, Performance and Demand on Resources, 69-88.
Takii, S. (2005). Productivity spillovers and characteristic of foreign multinational plants in Indonesian manufactuiring. Journal of Development Economics, 76(02), 521-542. http://dx.doi.org/10.1016/j.jdeveco.2004.01.006.
Todorova, G., & Durisin, B. (2007). Note absorptive capacity. Valuing A, 32(03), 774-786.
Ubeda, F., & Pérez, H. F. (2017). Absorptive capacity and geographical distance two mediating factors of FDI spillovers: a threshold regression analysis for spanish firms. Journal of Industry, Competition and Trade, 17(01), 1-28. http://dx.doi.org/10.1007/s10842-016-0226-z.
Annex 1
ALVORADA MAGE
APARECIDA DE GOIANIA MANAUS
ARACAJU MARACANAU
ARARAS MATA DE SAO JOAO
BARRETOS MIRACEMA DO TOCANTINS
BARUERI MOGI DAS CRUZES
BAURU MOGI MIRIM
BELO HORIZONTE MOGI-GUACU
BLUMENAU MONTE CARMELO
BRASILIA MONTES CLAROS
BRUSQUE NATAL
CAMACARI NITEROI
CAMPINAS NOVA FRIBURGO
CAMPO GRANDE NOVA LIMA
CANOAS NOVA ODESSA
CASCAVEL OSASCO
CATAGUASES PALMAS
CAXIAS DO SUL PASSO FUNDO
CONTAGEM POJUCA
CORNELIO PROCOPIO PONTA GROSSA
COTIA PORTO ALEGRE
CRAVINHOS PRADOPOLIS
CRUZEIRO QUATRO BARRAS
CUIABA RECIFE
CURITIBA REGISTRO
DIADEMA RIBEIRAO PRETO
DUQUE DE CAXIAS RIO DE JANEIRO
ELDORADO DO SUL RIO DO SUL
EMBU DAS ARTES RIO NEGRO
EUSEBIO RONDONOPOLIS
FLORIANOPOLIS SALTO
FORTALEZA SALVADOR
FRAIBURGO SANTA BARBARA D’OESTE
FRANCA SANTA CRUZ DO SUL
GOIANIA SANTA ISABEL
GRAVATAI SANTO ANDRE
GUARULHOS SAO BERNARDO DO CAMPO
IGARASSU SAO CAETANO DO SUL
IMBITUBA SAO JOSE DO RIO PRETO
INDAIATUBA SAO JOSE DOS CAMPOS
ITAJAI SAO JOSE DOS PINHAIS
ITAQUAQUECETUBA SAO LEOPOLDO
ITATIBA SAO LUIS
ITIRAPINA SAO SEBASTIAO DO CAI
ITU SAPUCAIA DO SUL
ITUPEVA SERRA
JARAGUA DO SUL SERTAOZINHO
JOAO PESSOA SOBRAL
JOINVILLE TIJUCAS
JUNDIAI TIMBO
LAJEADO TRES LAGOAS
LINS UBERABA