---Dear Author,
Please correct your galley proofs carefully
and return them no more than four days
after the page proofs have been received.
Please limit corrections to errors already
in the text; cost incurred for any further
changes or additions will be charged to
the author, unless such changes have
been agreed upon by the editor.
The editors reserve the right to publish
your article without your corrections if the
proofs do not arrive in time.
Note that the author is liable for damages
arising
from
incorrect
statements,
including misprints.
Please note any queries that require your
attention. These are indicated with a Q in
the PDF and a question at the end of the
document.
Reprints may be ordered by filling out the
accompanying form.
Return the reprint order form by fax or by
e-mail with the corrected proofs, to
Wiley-VCH :
advsustainsys@wiley.com
To avoid commonly occurring errors,
please
ensure
that the following
important items are correct in your proofs
(please note that once your article is
published online, no further corrections
can be made):
Names of all authors present and
spelled correctly
Titles of authors correct (Prof. or Dr.
only: please note, Prof. Dr. is not used
in the journals)
Addresses and postcodes correct
E-mail address of corresponding author
correct (current email address)
Funding bodies included and grant
numbers accurate
Title of article OK
All figures included
Equations correct (symbols and
sub/superscripts)
Corrections should be made directly in the PDF file using the PDF annotation tools. If you
have questions about this, please contact the editorial office. The corrected PDF and any
accompanying files should be uploaded to the journal’s Editorial Manager site.
Postfach 10 11 61 69451 Weinheim Germany Courier services: Boschstraße 12 69469 Weinheim Germany Tel.: (+49) 6201 606 531 Fax: (+49) 6201 606 500 E-mail: advsustainsys@wiley.com
UNCORRECTED PROOF
1 2 3 4 5 6 7 8 9 10 11 12 13 14 15 16 17 18 19 20 21 22 23 24 25 26 27 28 29 30 31 32 33 34 35 36 37 38 39 40 41 42 43 44 45 46 47 48 49 50 51 52 53 54 55 56 57 58 59 1 2 3 4 5 6 7 8 9 10 11 12 13 14 15 16 17 18 19 20 21 22 23 24 25 26 27 28 29 30 31 32 33 34 35 36 37 38 39 40 41 42 43 44 45 46 47 48 49 50 51 52 53 54 55 56 57 58 59Cooking oven produced carbon is
in-corporated into polyaniline without any further purification or chemical modifica-tion. The product shows excitation-inde-pendent triple-band photoluminescence, as well as sensitive and selective ion de-tection (Fe+3) ability. Clearly, it would add up to the green nanotechnology area, beneficiary to the society.
S. Goswami, S. Nandy,* J. Deuermeier, A. C. Marques, D. Nunes, S. P. Patole, P. M. F. J. Costa, R. Martins,
E. Fortunato* ... 1700137
Green Nanotechnology from Waste Carbon–Polyaniline Composite: Generation of Wavelength-Independent Multiband Photoluminescence for Sensitive Ion Detection
xxxx
UNCORRECTED PROOF
1 2 3 4 5 6 7 8 9 10 11 12 13 14 15 16 17 18 19 20 21 22 23 24 25 26 27 28 29 30 31 32 33 34 35 36 37 38 39 40 41 42 43 44 45 46 47 48 49 50 51 52 53 54 55 56 57 58 59 1 2 3 4 5 6 7 8 9 10 11 12 13 14 15 16 17 18 19 20 21 22 23 24 25 26 27 28 29 30 31 32 33 34 35 36 37 38 39 40 41 42 43 44 45 46 47 48 49 50 51 52 53 54 55 56 57 58 59FULL PAPER
www.advsustainsys.comGreen Nanotechnology from Waste Carbon–Polyaniline
Composite: Generation of Wavelength-Independent
Multiband Photoluminescence for Sensitive Ion Detection
Sumita Goswami, Suman Nandy,* Jonas Deuermeier, Ana C. Marques, Daniela Nunes,
Shashikant P. Patole, Pedro M. F. J. Costa, Rodrigo Martins, and Elvira Fortunato*
DOI: 10.1002/adsu.201700137
1. Introduction
With global interest, carbon-based nanomaterials having sig-nificant implications for the development of optoelectronic
This study reports on the qualitative analysis of photoluminescence effect generated from waste carbon of cooking oven by facile cost-effective mate-rial engineering. The waste carbon product as a form of carbon nanoparti-cles (CNPs) is incorporated within a conjugate polymer, namely, polyaniline (PANI) to produce CNP-PANI composites that have shown excitation-wavelength-independent triple-band photoluminescence emission effect and highly sensitive Fe+3 ion detection ability. Herein the waste carbon material, while functionalized within the conjugated polymer, needs no further acid treatment or surface modification thus making the process cheaper, envi-ronmentally benign, and useful for green nanotechnology. The excitation-wavelength-independent unique triple-band photoluminescence spectrum is the direct consequence of carbon–polyaniline synergy in π–π transition and the surface passivation of CNPs by the NH2 group rich aniline during in
situ polymerization. The current scenario has been studied for the samples prepared with different CNP concentrations for different reaction times and discussed in details with supportive physico-chemical characterizations. Moreover, the present study has demonstrated that the current material can be used as a fluorescent sensing platform for Fe+3 ions with high sensitivity and selectivity criteria where the detection limit of the sensing probe has a value as low as 12 × 10−9m.
xxxx
S. Goswami, S. Nandy, J. Deuermeier, A. C. Marques, D. Nunes, R. Martins, E. Fortunato
i3N/CENIMAT
Department of Materials Science Faculty of Science and Technology
Universidade NOVA de Lisboa and CEMOP/UNINOVA Campus de Caparica 2829-516 Caparica, Portugal
E-mail: snandy_ju@yahoo.co.in, s.nandy@fct.unl.pt; emf@fct.unl.pt S. P. Patole, P. M. F. J. Costa
Physical Science and Engineering Division King Abdullah University of Science and Technology Thuwal 23955-6900, Saudi Arabia
The ORCID identification number(s) for the author(s) of this article can be found under https://doi.org/10.1002/adsu.201700137.
Q2
devices,[1–3] energy conversion,[4]
photo-catalysis,[5] biomedical imaging,[6–8]
sensing probe,[9–14] and many more,[15,16]
are receiving great attention from both experimentalists and theorists. They have become the new-generation lumi-nescent materials being superior to conventional organic dyes and semicon-ductor quantum dots, while compared in terms of chemical inertness, large two-photon excitation cross sections, lack of blinking, low cytotoxicity, and biocompat-ibility.[17] However, proper understanding
of the photoluminescence (PL) origins in carbon nanoparticles is still inadequate, which is actually lowering the speed of major development and abundant use of carbon-based materials with desired PL characteristics. Different mechanisms have been proposed so far, respectable ones are, for example, quantum confine-ment effect or conjugated π-domains determined by carbon core, surface state determined by hybridization of carbon backbone and connected chemical groups, molecule state determined by solely fluorescent molecules connected on surface or inside the carbon particles as well as the cross-link enhanced emission effect. Though the mechanisms based on particle size distribution, surface traps and quantum effects, charge transfer, intramolecular H-bonds, electronic conjugate structure, defects, etc., are more popular in this case, till now, the actual PL mechanism is still an open debate for related researchers.[18–22] On the other side, conjugate
polymers are also of great interest because of their ability to control the energy gap and electronegativity through molec-ular design that has made possible the synthesis of con-ducting polymers with a range of ionization potentials and electron affinities.[23,24] More interestingly, most of the
con-jugated polymer shows PL quenching upon oxidation, while developing oxidation-resistance can lead to an increment of PL emission. The excellent properties of π-electron delocali-zation at the backbone of conjugate polymer can be an initi-ator of charge transfer mechanism with carbon nanoparticles (CNPs) resulting oxidation-resistance. This unique combina-tion of two types of materials has the ability to expand the
UNCORRECTED PROOF
1 2 3 4 5 6 7 8 9 10 11 12 13 14 15 16 17 18 19 20 21 22 23 24 25 26 27 28 29 30 31 32 33 34 35 36 37 38 39 40 41 42 43 44 45 46 47 48 49 50 51 52 53 54 55 56 57 58 59 1 2 3 4 5 6 7 8 9 10 11 12 13 14 15 16 17 18 19 20 21 22 23 24 25 26 27 28 29 30 31 32 33 34 35 36 37 38 39 40 41 42 43 44 45 46 47 48 49 50 51 52 53 54 55 56 57 58 59 class of novel composite materials with controlling theirprop-erties through rational chemical synthesis.[25,26]
In this work, we have used the idea of surface passivation indirectly by the incorporation of CNPs within polyaniline (PANI) during in situ polymerization. CNPs that were collected from normal cooking oven produced waste carbon, feature sig-nificantly simpler acquisition and low cost, but have rarely been studied as photoluminescence material. A simple and feasible wet chemical route has been followed using ethanol-water as the reaction and dispersion medium. Aniline monomer acted as the key factor for polymerization and in a late run also pro-viding the surface amino groups for passivating surface traps. As-synthesized product has shown highly intense triple-band photoluminescent peaks, interestingly with excitation-wave-length-independent behavior. Different concentrations of CNPs have been incorporated into the conjugated polymer, driving to the development of oxidation-resistant polymers that show a significant outcome on PL emission. On the other hand, a progressive study on the PL emission with functionalization time of CNPs within PANI was carried out to understand the influence of interaction between them. Our findings can be considered among the few reports, which have achieved the excitation-independent luminescence in carbon-based materials. Though both excitation-dependent and excitation-independent emissions have been observed, the excitation wavelength dependent emission behavior is most common and it may arise from the wide distributions of differently sized dots and surface chemistry, different emissive traps, or some other cur-rently unresolved source.[27] But, the excitation-independent
PL behavior has been seldom achieved and the reason behind it is still unclear. Researchers are mostly doing their part for improving quantum yield of CNPs,[28,29] though widening the
area of comprehensive understanding of emission origins and finding out the controlling factors or criteria are also very much significant for more successful applications in future. Even after all these yet to be clear concepts about the PL of CNPs, several research groups have accepted the idea of explaining their radiative transition through the effective role of surface traps. In most of the situations, the excitation dependence of CNPs could be controlled through managing the emissive trap-ping states introduced by surface groups such as CO, CO, OCOH, etc., with various energy levels. But, if all the sur-face states of CNPs are passivated, the emission is supposed to occur only through radiative transition of sp2 carbon (most
probably π to π* transition), finally resulting in an excitation-independent photoluminescence. Many authors have often used nitrogen-containing organic compounds specially those having short chains, as effective passivating agents in this case.[30,31] Hence, amino group could be an effective means to
achieve the excitation-independent behavior of CNPs by surface passivation.
Most importantly, we have further demonstrated that such new CNP-PANI composites can be applicable as a selective PL sensing probe, through the quenching of emission in presence of Fe+3 ions in the dispersion, with a detection limit as low as
12 × 10−9m. Moreover, we have embedded CNPs into a
con-ducting polymer which can be proved further as an appropriate solid-state architecture to be applied as phosphors for white light-emitting devices. Also, here we have used cooking oven
produced waste carbon as the source of CNPs which can be a great replacement for the expensive and unsustainable source materials thus stepping toward the green nanotechnology.
2. Results and Discussions
2.1. Surface and Chemical Structure Analyses
Detailed information about the chemical composition of as-syn-thesized CNP-incorporated PANI samples has been explored using tapping mode phase imaging atomic force microscopy (AFM) (PI-AFM) technique by applying sample bias voltage. PI-AFM is a sensitive nanoscale probing method to detect the phase shift of cantilever oscillation and its proximal interaction with sample surface, associated with stiffness, viscoelasticity, and chemical composition of the material.[32] Here, we have
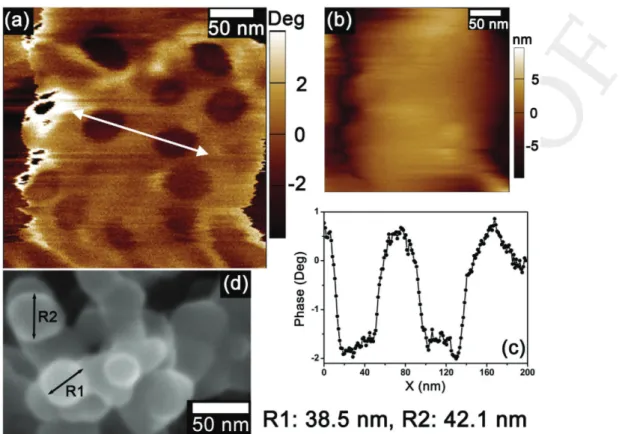
applied surface voltage during phase imaging of sample so that it can impart enhancement of the image contrast with effect of localized electrostatic field. Figure 1a shows the PI of hetero-geneous regions in phase-separated CNP-incorporated PANI composite. Circular spots with average size of 40 nm can be ascribed to CNPs within polymer matrix. Observed topograph-ical features of the corresponding area (Figure 1b) do not show any kind of structural effects, which corroborates that PI-AFM is the result of a localized variation of different chemical com-positional effects. Such PI is quite effective to determine the surface modification of polymer materials containing nanopar-ticles. Figure S1a,b (Supporting Information) is representative field emission scanning electron microscopy (FESEM) images of carbon nanoparticles (as directly obtained from the waste carbon product of cooking oven) and the typical CNP-incorpo-rated PANI samples, respectively.
The X-ray photoelectron spectroscopy (XPS) results indicate that a typical CNP-PANI sample is mainly composed of carbon, nitrogen, and oxygen (see Figure S3, Supporting Information). In order to speculate on the influence of incorporated CNPs on PANI, C1s and N1s core levels are further quantitatively deconvoluted which is shown in Figure 2a. The high-resolution spectrum of C1s exhibits four main peaks, centered at about 284.3 (CC or CH), 285.0 (CN), 286.7 (CN+ or CO), and
288.6 (>CO) eV.[33–35] The typical XPS N1s core-level spectra
for CNP-PANI sample are shown in Figure 2a. The relatively broad peak suggests the existence of different component peaks. Thus, the high-resolution peak of N1s is deconvoluted and rea-sonably fitted with four Gaussian–Lorentzian peaks having binding energy values of ≈398.1, 399.2, 400.7, and 402.2 eV. The peak with the lowest binding energy (398.1 eV) is due to imine-like (N) structure, and the peak centered at 399.2 eV is attributed to amine-like nitrogen atoms (NH).[33,36] The
peak centered at 400.7 is attributed to cationic nitrogen atoms on the polymer backbone and the highest binding energy peak (402.2 eV) is due to the protonated amine units.[33,36] The
XPS data were compared to a pure PANI sample as well as to samples of varying amount of CNPs (not shown here). No systematic changes in C1s and N1s could be detected, which is an indication that CNPs are embedded in PANI and do not reside on the surface, confirming the AFM measurement. Fourier transformed infrared (FTIR) and Raman spectroscopy
UNCORRECTED PROOF
1 2 3 4 5 6 7 8 9 10 11 12 13 14 15 16 17 18 19 20 21 22 23 24 25 26 27 28 29 30 31 32 33 34 35 36 37 38 39 40 41 42 43 44 45 46 47 48 49 50 51 52 53 54 55 56 57 58 59 1 2 3 4 5 6 7 8 9 10 11 12 13 14 15 16 17 18 19 20 21 22 23 24 25 26 27 28 29 30 31 32 33 34 35 36 37 38 39 40 41 42 43 44 45 46 47 48 49 50 51 52 53 54 55 56 57 58 59 www.advancedsciencenews.com www.advsustainsys.comwere used to analyze the chemical structure of as-prepared samples. A FTIR spectrum of typical CNP-PANI sample with different synthesis time duration is depicted in Figure 2b. As expected, some typical characteristic absorption bands of PANI were observed in the spectra. For instance, 1560–1558 and 1488–1456 cm−1 (due to stretching vibration of CC in quinoid (Q) and benzenoid (B) rings, respectively), 1305–1285 cm−1
(attributed to π-electron delocalization induced in polymer by protonation of doping process), 1251–1233 cm−1 (associated
with CN stretching of the secondary aromatic amine), 1152–1110 cm−1 (due to aromatic CH in-plane bending), as
well as 820–814 cm−1 (related to out-of-plane deformation of CH in the 1,4-disubstitued benzene ring) were observed.[37]
Thus, FTIR spectra display essentially the same absorptive charac -teristics as that of pristine PANI.[38,39] But, there is slight red
shifting in peak positions with different reaction time durations which may be attributed to the incorporation of CNPs. The qui-noid/benzenoid (Q/B) ratio when calculated from FTIR spectra for a particular sample is observed to decrease with increasing time duration of polymerization, that is, with preceding func-tionalization of CNPs within the polymer. Also, the Q/B ratio as determined by FTIR has smaller values for the sample pre-pared using higher CNP concentrations (Figure S4, Supporting Information) signifying the presence of more reduced emeral-dine segments in these functionalized materials. This can be
attributed to strong interactions existing between CNPs and PANI in which the functionalized CNPs reduce PANI through charge transfer.
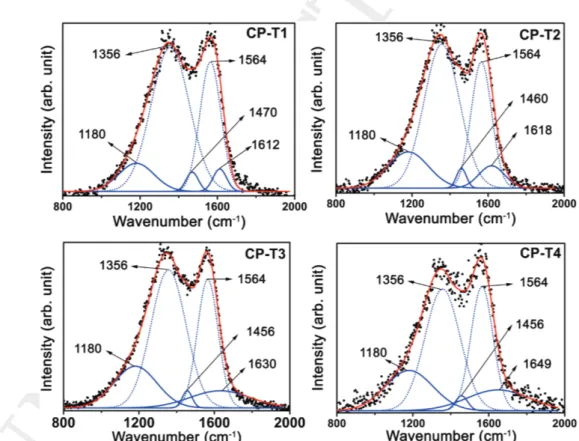
Figure 3 shows the Raman spectra of a typical CNP-PANI
sample (CP, for time T1–T4) excited by 532 nm laser line in air ambient environment. In the spectra, two very intense but broad and diffused peaks can be seen as main characteris-tics. So, they are deconvoluted into the fitted ones to obtain a relevant idea about constituent elements, that is, CNPs and PANI. The vibrational bands at ≈1356 and 1564 cm−1
are the so-called D and G bands of carbon for disorder-induced feature (usually due to the presence of amorphous disordered carbon structure of CNPs) and stretching mode of CC bonds, respectively.[40] Here, the intensity ratio of D
and G-band (ID/IG) is found to have decreasing value due to
decrease in the relative intensity of D-band with increasing polymerization and CNP incorporation. It indicates that the effective defects are decreasing which is also further supported by PL results showing narrow-sharp peak with increasing time for a particular sample. On the other hand, the con-ventional Raman spectra of PANI have bands situated at the regions: 1165–1520 cm−1 (different CN stretching modes— amines, imines, polarons, bipolarons) and 1570–1650 cm−1
(quinoid or benzenoid rings CC stretching modes).[41,42] In
the present spectral decomposition, the contributory peaks
Figure 1. Localized phase imaging map of CNP-PANI. a) Localized phase imaging map of a heterogeneous region of polyaniline surface containing
carbon nanoparticles with the bias voltage of 2 V. Image contrast with dark balls indicates the presence of CNPs. b) The topographical features of the same area which shows nothing informative on chemical compositional effects. c) Corresponding profile (white arrow in PI) has been displayed which indicates an average of 38–40 nm carbon particle in size. d) A SEM image of carbon particles with average size of 40 nm has been shown which is well matched with PI profile.
UNCORRECTED PROOF
1 2 3 4 5 6 7 8 9 10 11 12 13 14 15 16 17 18 19 20 21 22 23 24 25 26 27 28 29 30 31 32 33 34 35 36 37 38 39 40 41 42 43 44 45 46 47 48 49 50 51 52 53 54 55 56 57 58 59 1 2 3 4 5 6 7 8 9 10 11 12 13 14 15 16 17 18 19 20 21 22 23 24 25 26 27 28 29 30 31 32 33 34 35 36 37 38 39 40 41 42 43 44 45 46 47 48 49 50 51 52 53 54 55 56 57 58 59 from PANI are at around 1180, 1456–1470, and 1612–1649 cm−1(some peaks cannot be even decomposed for PANI due to the immense effect of CNPs in D and G-band positions, there-fore neglected for analysis). Relative intensity of the band at around 1180 cm−1 has been increased with increasing
polymerization time (T1–T4), verifying the predominance of polaronic carriers from benzenoid rings. The band at 1470 cm−1 has decreasing intensity with time and shifts toward lower wavenumber region down to 1456 cm−1. This can be
attributed to CN stretching of the quinoid and the shifting is due to incorporation and attachment of CNPs within PANI. The peak around 1612–1649 cm−1 is due to CC stretching effects from quinoid and benzenoid rings but difficult to sepa-rate for verifying their individual contribution. This subpeak (as shown in Figure 3a–d) becomes very broad (FWHM value increases from 83.0 to 387.0) with increasing polymerization time and subsequently has also its center shifted from 1612 to 1649 cm−1 for corresponding samples CP-T1 to CP-T4. Such kind of increase in FWHM is already reported by Salvatierra et al.[42] and is in the benzenoid part of the peak. Hence in
this work here, the particular Raman peak broadening with increasing time from T1 to T4 indicates the formation of PANI enriched with more benzenoid units, when the amount of CNPs in the nanocomposites is higher. It also further gives the reason behind enhanced PL performance. Therefore, both Raman and FTIR indicate the functionalization of CNPs by PANI to form CNP-PANI where the amino group has played a key role for surface passivation, thus generating enhanced
Q3
Figure 3. Raman spectra of CNP-PANI. Fitted Raman bands of sample series of CP for different reaction times T1, T2, T3, and T4. The red line indicates the
fitted total profile adjustment where black dots have displayed the experimental data. Dotted blue lines are fitted for D and G bands of amorphous CNPs incorporated in PANI. The peak ration of ID/IG decreases with the polymerization time (T1 to T4). Solid blue lines are fitted for three peak regions from PANI.
Figure 2. Analytical spectra of XPS and FTIR. a) Selective high-resolution
XPS spectra of C1s and N1s. b) Analytical FTIR spectra of sample series of CP for different reaction time T1, T2, T3, and T4 (1.5, 2, 2.5, and 3 h, respectively). The dotted lines in the figure indicate the blue shift of some peaks which can be associated with reaction time of CNP-PANI.
UNCORRECTED PROOF
1 2 3 4 5 6 7 8 9 10 11 12 13 14 15 16 17 18 19 20 21 22 23 24 25 26 27 28 29 30 31 32 33 34 35 36 37 38 39 40 41 42 43 44 45 46 47 48 49 50 51 52 53 54 55 56 57 58 59 1 2 3 4 5 6 7 8 9 10 11 12 13 14 15 16 17 18 19 20 21 22 23 24 25 26 27 28 29 30 31 32 33 34 35 36 37 38 39 40 41 42 43 44 45 46 47 48 49 50 51 52 53 54 55 56 57 58 59 www.advancedsciencenews.com www.advsustainsys.comphotoluminescence properties of CNPs and PANI qualitatively and quantitatively.
2.2. Optical Behavior of CNP-PANI
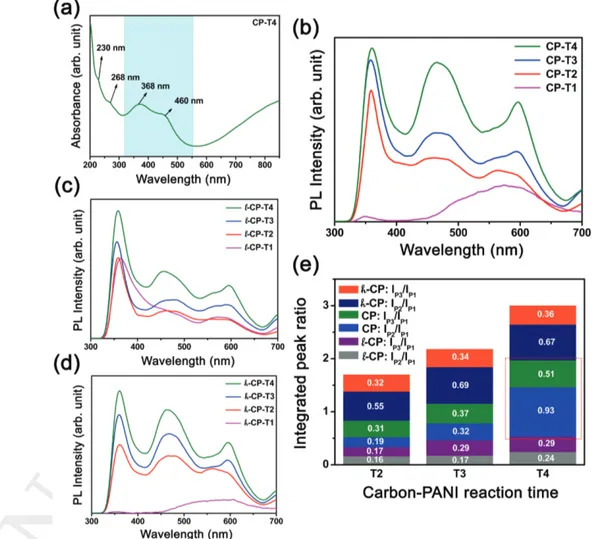
To investigate the optical properties of as-prepared CNP-PANI samples, UV–vis absorbance and PL spectra of the CNP-PANI dispersions were analyzed. Figure 4a shows several character-istic absorption peaks of CNP-PANI composites. The absorp-tion bands, observed at 230 and 268 nm can be assigned to π–π* (aromatic sp2 domains) and n–π* (broken symmetry
transition from CO) transitions in functionalized CNPs.[43,44]
Other absorption around 368 nm corresponds to π–π* ben-zenoid transition within PANI.[40,45] Besides, the connected
chemical groups between CNPs and PANI may contribute to the absorption region band starting from 320 to 560 nm, which can arise from π–π interaction. Absorption at 368 and 460 nm can be attributed to a transition from σ and π orbital (HOMO) to the lowest unoccupied molecular orbital (LUMO).
A circumstantial study of PL emission has been performed upon using this energy band as excitation.
CNP-PANI nanocomposites in the present study have exhib-ited excitation-independent triple-band emission which is an excellent outcome to utilize the waste carbon product for fur-ther optoelectronic applications at the same time making the process economic and green. A dynamic study of PL character-istics has been performed for the assorted series of composites for different amounts of carbon nanoparticles functionalized within polyaniline (l-CP, CP, and h-CP series) associating with different reaction times (T1–T4). The particular of samples with their notation have been given in the Experimental Section. Figure 4b represents triple-band PL emission spectra for the sample series of CP for different functionalization time when excited at 280 nm. The strong emission peak at 360 nm (IP1) may be attributed to benzenoid π–π* transition in the
polymer backbone due to the well-matched absorption band information obtained earlier during the UV–vis study (i.e., the peak at 368 nm corresponding to benzenoid π–π* transition of PANI component).[46] The other peak at ≈466 nm (I
P2) is due
Figure 4. Optical study of CNP incorporated PANI samples. a) UV–vis absorption spectra of a typical sample. b) Triple band PL emission (λEM =
360, 466, and 596 nm) of CNP incorporated PANI for sample series of CP in aqueous medium with the excitation of 280 nm. It has been displayed that the PL emission around 466 and 596 nm comparatively are stronger with increasing functionalization time. Triple band PL emission for sample series of c) l-CP and d) h-CP. e) Plot of integrated areas of IP2/IP1 and IP3/IP1 PL peak for three different series of samples. The red box indicates the
UNCORRECTED PROOF
1 2 3 4 5 6 7 8 9 10 11 12 13 14 15 16 17 18 19 20 21 22 23 24 25 26 27 28 29 30 31 32 33 34 35 36 37 38 39 40 41 42 43 44 45 46 47 48 49 50 51 52 53 54 55 56 57 58 59 1 2 3 4 5 6 7 8 9 10 11 12 13 14 15 16 17 18 19 20 21 22 23 24 25 26 27 28 29 30 31 32 33 34 35 36 37 38 39 40 41 42 43 44 45 46 47 48 49 50 51 52 53 54 55 56 57 58 59 to synergic effect between the two, CNPs and PANI for theirconjugation. Another peak at ≈596 nm (IP3) can be assigned as
a luminescence effect from functionalized CNPs. Emission at 530–570 nm has been previously reported for NH2
-functional-ized carbon materials.[17] In the present work, a further red-shift
in PL emission for CNP-PANI should have originated from the change of electronic structure by formation of functional-ized CNP-PANI. However initially, for time T1 we have noticed a low intense broad emission peak originating from 400 to 750 nm, may be a combined effect of peak IP2 and IP3. The
result can be attributed to a weak interaction between CNPs and PANI in the elementary form of reaction. Also, a tiny peak around 350 nm has been originated due to PANI. But, with increasing polymerization time the three peaks come out and get intensified. This observation implies that the strong triple-band emission state exists in CNP-PANI hybrid systems, unlike most previously reported PL of carbon particles.[47,48] The
com-parative PL emission for these three consecutive wavelengths has been influenced by the reaction time between CNPs and PANI. The phenomenon can be due to the development of an oxidation-resistant reaction through the introduction of CNPs in aniline monomer during polymerization. This can be corre-lated with the results of Q/B ring ratio, determined from FTIR analysis. Decreasing nature in Q/B signifies the presence of more reduced emeraldine segments in CNP-PANI composite, can be ascribed to strong π–π interaction between CNPs and PANI. Consequently, CNPs interact with polymeric chains where the incorporated carbon nanoparticles reduce the PANI through charge transfer, increasing strongly with reaction time. As a result, with time (from T1 to T4) CNPs incorporated within PANI lead to an influential effect on PL emissions for
IP2 and IP3. The contributing effect of PL emission due to
func-tionalized form of CNPs can be analyzed from the integrated peak ratio of IP2/IP1 and IP3/IP1, where IP1 is the PL emission
from PANI itself. Interestingly, the ratios (IP2/IP1 and IP3/IP1)
rise from T1 to T4 indicating strong π–π interaction within the composite. Peak intensities were recorded as maximum values for the sample CP-T4. All these features are well distin-guished from other previously reported CNPs.[17] The optical
performance relates to the change of chemical structure or local environment of CNPs that have occurred here due to the func-tionalization of common oven produced carbon material into polyaniline matrix.
The above study has gradually revealed how we have achieved interesting PL properties from the CNP-PANI com-posites which had no such distinguished and sharp features for its individual components whether it is CNPs or PANI (just broad hump-like spectra as shown in Figure S5, Supporting Information). Additionally, we have studied more details in the variation of PL emission correlated with the change in CNPs concentration within PANI. Figure 4c,d shows PL emission spectra for lower concentration of CNPs (named with l-CP) and higher concentration of CNPs (named with h-CP), respec-tively. Though for higher CNP concentration (than that in CP series samples) there is no pronounced change in the pattern of emission, but for lower CNP concentration we have noticed some anomalous features (compatible with the previously dis-cussed reasons). For example, the PL emission spectrum for sample l-CP-T1 (with low CNP concentration and initial stage of
functionalization) exhibits a strong peak of IP1 at 364 nm with
a weak shoulder of IP2 unlike other CNP-PANI samples. The
initial hump of second PL emission peak (IP2) can be attributed
to weak synergic effect between the two, CNPs and PANI for their conjugation. The low intense blunt peak at ≈596 nm (IP3)
can also be understood as a feeble luminescence effect from the weakly functionalized CNPs. Further, the integrated peak area ratio of IP2/IP1 and IP3/IP1 are getting higher with increasing
reaction time, which is justifiable by the previous analysis due to the presence of lower CNP concentration and lower function-alization effect therefore. More explicitly, the integrated areas of as discussed peak ratio (IP2/IP1 and IP3/IP1) for all the series
of samples (l-CP, CP, and h-CP) for functionalization time T2, T3, and T4 have been illustrated in Figure 4e. According to this analytical data, it is clear that the luminescence effect from CNP-PANI composite is progressive for sample series of CP and it effectively shows promising results for CP-T4, com-parable with all others photoluminescence effects.
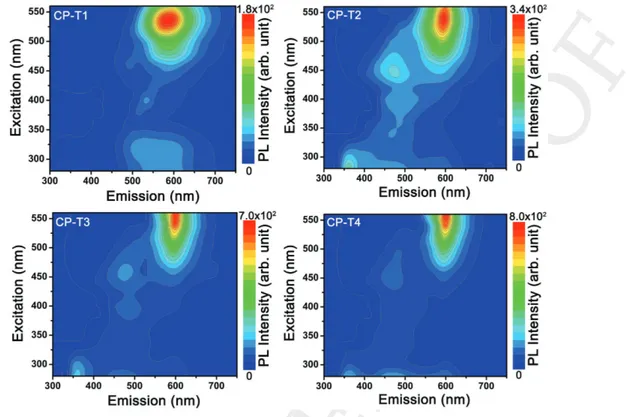
In accordance with the absorption spectra of CNP-PANI composites, we measured PL excitation-emission (PLE) maps within the UV–visible range. Figure 5 shows a consecutive series of PLE maps of samples CP-T1, CP-T2, CP-T3, and CP-T4. An acute arena of PL emission centered at 596 nm (IP3)
clearly reveals in all the PLE maps which is the effect of surface passivation on the optical properties of functionalized CNPs within PANI. All the consecutive PLE maps have been followed by the formation of metamorphosis in arena of IP3.
The shape of the PL arena has been changed from circular to elliptical with increasing interaction between CNPs and PANI. These observed features of metamorphosis in PL arena are the results of narrower and sharper emission of IP3 with
increasing T-value. Decrease in peak broadening is because of increase in surface passivation with ongoing functionalization time duration, causing less defect states. It can also be noticed that the most intense point of the arena (reddish part of the PLE map) is shifted toward exposition to higher excitation wavelength from T1 to T4. In detail, the demonstration of PL emission at 596 nm when the excitation wavelength is changed from 420 to 560 nm has been shown in the Supporting Infor-mation. Figure S6 (Supporting Information) shows how the emission peak at 596 nm first increases for increasing excita-tion wavelength and reaches a maximum at PLE of 540 nm and then starts to decrease with further increase in excitation wave-length, while the peak position remains unchanged. Generally, the PL reported for carbon dots are highly excitation-dependent originating from inhomogeneous dot size effect and or surface defects. However, in the present case, PL of CNPs is thoroughly showing excitation-independent behavior which is considered to be related to the surface passivation effect because of using NH2-group-rich aniline as the starting monomer. During the
in situ polymerization process to form PANI while simulta-neously functionalizing CNPs, it is the surface amino groups that passivate the traps on surface of CNPs and lead to a single transition mode. In addition, another interesting observation in PLE maps has been noticed for all the CNP-PANI composites at the elementary reaction condition (i.e., T1 state). PLE maps of l-CP-T1 and h-CP-T1 have been given in Figure S7 (Sup-porting Information). An anomalous behavior of emission has been noticed for l-CP-T1 where the IP1 displays more intense
UNCORRECTED PROOF
1 2 3 4 5 6 7 8 9 10 11 12 13 14 15 16 17 18 19 20 21 22 23 24 25 26 27 28 29 30 31 32 33 34 35 36 37 38 39 40 41 42 43 44 45 46 47 48 49 50 51 52 53 54 55 56 57 58 59 1 2 3 4 5 6 7 8 9 10 11 12 13 14 15 16 17 18 19 20 21 22 23 24 25 26 27 28 29 30 31 32 33 34 35 36 37 38 39 40 41 42 43 44 45 46 47 48 49 50 51 52 53 54 55 56 57 58 59 www.advancedsciencenews.com www.advsustainsys.comemission comparable with IP3, indicating less functionalization
effect of CNPs with PANI.
As-synthesized CNP-PANI samples were also found to be strongly luminescent on a substrate (deposited as thin films). As shown in Figure 6, the fluorescence image of a typical CNP-PANI sample obtained by confocal microscopy exhibits a bright and intense luminescence effect from the material (excitation wavelength: 488 nm). However, it should be cautioned that the observed brightness variation might also be subject to effects from some measurement issues, such as some luminescent centers being slightly out of the focal plane.
2.3. Concentration-Dependent PL
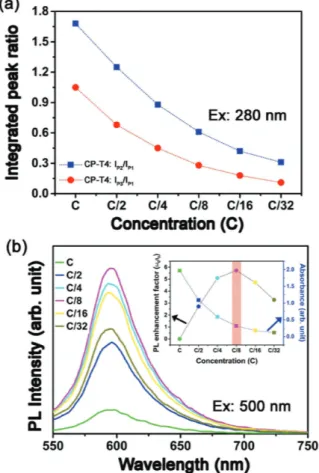
Furthermore, Figure 7a shows a clear correlation of IP2/IP1
and IP3/IP1 with the concentration of a typical sample series of
CP-T4, dispersed in the solution. Each time sample concentra-tion was decreased to half of the previous one. The exponential decreasing factor of the integrated peak ration of IP2/IP1 and
IP3/IP1 indicates that these changes in the dispersion of the
CP-T4 can have large effects on the number of reabsorption events a photon undergoes. It can be because of photon reab-sorption[49,50] at the lower wavelength emission (PL emission at
≈360 nm) which is most strongly affected by concentration of CNP-PANI in the solution, over the total detected emissions. For the range of concentrations investigated, it shows a purely monotonic trend with the peak rations.
Again, we have investigated the PL emission around at 596 nm with excitation of 500 nm. The PL intensity is com-pletely dependent on the sample concentration. Initially, PL intensity increases with decreasing factor of sample tion in the solution. But further decrease of sample concentra-tion, PL intensity decreases again. The phenomenon can be
Figure 5. PLE maps of the solution of CP series for different CNP-PANI functionalization times (T1, T2, T3, and T4). An intense arena of the PL
emis-sion centered at 596 nm (IP3) has been patterned for all the samples, followed by the metamorphosis in shape with increasing functionalization time,
that is, duration of interaction between CNPs and PANI. Other emission centers of IP1 and IP2 have also been noticed for CP-T2, CP-T3, and CP-T4,
which are comparatively less intense.
Figure 6. A confocal fluorescence microscopy image of a typical
CNP-PANI composite at room temperature (irradiated under the laser excita-tion wavelength of 488 nm).
UNCORRECTED PROOF
1 2 3 4 5 6 7 8 9 10 11 12 13 14 15 16 17 18 19 20 21 22 23 24 25 26 27 28 29 30 31 32 33 34 35 36 37 38 39 40 41 42 43 44 45 46 47 48 49 50 51 52 53 54 55 56 57 58 59 1 2 3 4 5 6 7 8 9 10 11 12 13 14 15 16 17 18 19 20 21 22 23 24 25 26 27 28 29 30 31 32 33 34 35 36 37 38 39 40 41 42 43 44 45 46 47 48 49 50 51 52 53 54 55 56 57 58 59 attributed to the effect of emission photon scattering[51] withinthe sample. The emission photon scatters when the sample concentration in the dispersion is higher, resulting lesser PL emission detection. But the effect reduces with decreasing con-centration and PL enhancement has been observed. But, PL intensity again decreases after reaching the optimum sample concentration, that is, when the scattering factor minimizing could not affect over the real emission from the samples. Figure 7b shows the concentration-dependent emission with the excitation of 500 nm, for the sample series of CP-T4. Inset of Figure 7b plots the variation of PL enhancement factor of CP-T4 dispersion with function of UV absorption at the exci-tation wavelength (i.e., 500 nm) for five different sample con-centrations. The PL enhancement factor is defined as (I −I0)/I0,
where I0 and I are the initial and the enhanced PL intensities,
respectively. Interestingly, UV absorption at the excitation wave-length decreases monotonously with the decreasing concentra-tion of CP-T4, but the trend is not observed same for the PL enhancement factor. At the concentration of C/8, though the absorption is lower at the excitation, the emission at 596 nm is maximum.
2.4. PL Probing for Ion Sensing
Recently, photoluminescent carbon dot-based nanosensors are being extensively developed for practical field application.[52,53]
So, here we have tried to explore the feasibility of using as- prepared CNP-PANI as a PL sensing platform and found that it can be actually used as an effective PL probe for the detec-tion of Fe+3 ion. It is well-known that Fe+3 ions are indispen-sable for a large number of living systems and act as a key material for many important biochemical processes like oxygen uptake, oxygen metabolism, and electron transfer. So, detection of such metal ions is considered to be highly desirable. Here in Figure 8a, the PL intensity of as-synthesized CNP-PANI (optimized one, i.e., CP-T4; excitation wavelength: 500 nm) at 596 nm was observed to decrease gradually with increasing Fe+3
ion concentration, indicating that Fe+3 can effectively quench the photoluminescence of CNP-PANI.
This quenching can be simply attributed to nonradiative electron-transfer process generated due to adsorption of Fe+3
ion on the surface of material that involves partial transfer for an electron in the excited state to the d orbital of Fe+3. To get
insight into the quenching mechanism, corresponding data were analyzed by the familiar Stern–Volmer equation. The full concentration range (0–60 × 10−6m) plot as presented in
Figure 8b is not rigorously following the conventional linear Stern–Volmer equation inferring that both dynamic and static quenching processes occur in the above-mentioned analytical system. Other two types of CNP-PANI samples (h-CP-T4 and l-CP-T4) have also responded (Figure S8, Supporting Informa-tion) in this sensing experiment but the quenching effect is much lower than that of CP-T4 (see inset of Figure 8b). A PL emission titration experiment was also performed for CP-T4 for evaluating the quantitative detection capability of this system at a signal-to-noise ratio of 3. The limit of detection (LOD) of Fe+3 is estimated to be about 12 × 10−9m based on three times
standard deviation rule (LOD = 3δ/slope) from the linear fit of Stern–Volmer equation in the range of 0–160 × 10−9 m
(the correlation coefficient R2 is 0.99, Figure S9, Supporting
Information). The result is significantly lower compared to the previous results.[54,55] So, the material is highly sensitive
toward detecting Fe+3 ions. In addition, to evaluate the
detec-tion ability of this system for other various biologically and environmentally relevant metal ions, we investigated the PL quenching effect for ions including Na+, K+, Ca+2, Cd+2, Mg+2, Mn+2, Fe+3, Ag+, Cu+2, Co+2, Zn+2, and Pb+2. The response of
the assay was tested for these different ions at a concentration of 10 × 10−6m under the same conditions as those used with
Fe+3 (Figure S10, Supporting Information). Remarkably, no sig-nificant PL quenching effect was observed for adding the other metal ions (some showed minimal quenching effect such that the influence is almost negligible) except Cu+2 ions. The Cu+2
ions showed dramatic decrease in the PL intensity; herein the quenching can be ascribed to the fact that Cu+2 is a
paramag-netic ion with unfilled d shell and hence can result in quench of the PL intensity via electron or energy transfer. Though Cu+2
showed a relatively strong quenching effect (Figure S11, Sup-porting Information) but, while tested for titration experiment for comparing the detection ability with that of Fe+3 under same conditions, the results demonstrated for Fe+3 ions are far better
Figure 7. a) The integrated peak ration of IP2/IP1 and IP3/IP1 decreases
exponentially with the decreasing factor of CP-T4 sample concentration in the solution for the excitation wavelength of 280 nm. b) The concen-tration-dependent emission with the excitation of 500 nm, for the sample series of CP-T4. Inset: Plots the variation of PL enhancement factor of CP-T4 dispersion and the UV absorption at the excitation wavelength (i.e., 500 nm) for five different sample concentrations. Red line indicates the optimum concentration of the sample for best PL enhancement factor.
UNCORRECTED PROOF
1 2 3 4 5 6 7 8 9 10 11 12 13 14 15 16 17 18 19 20 21 22 23 24 25 26 27 28 29 30 31 32 33 34 35 36 37 38 39 40 41 42 43 44 45 46 47 48 49 50 51 52 53 54 55 56 57 58 59 1 2 3 4 5 6 7 8 9 10 11 12 13 14 15 16 17 18 19 20 21 22 23 24 25 26 27 28 29 30 31 32 33 34 35 36 37 38 39 40 41 42 43 44 45 46 47 48 49 50 51 52 53 54 55 56 57 58 59 www.advancedsciencenews.com www.advsustainsys.comand also more interesting. Fe+3 ion is already a well-known effi-cient fluorescence quencher due to its paramagnetic properties via electron or energy transfer. Here, the Fe+3 could be pref-erentially binding with nitrogen atom of the amino groups[56]
residing in the polymeric backbone of the composite. There-fore, the Fe+3 ions can be adsorbed on the material surface with
its higher affinity for the amino group itself, which would facili-tate charge transfer further and thus restrain exciton recom-bination, leading to significant fluorescence quenching. Thus, as-synthesized CNP-PANI showed high detection selectivity for Fe+3 ions among the studied metal ions, except Cu+2 ions. So basically, the strong affinity between the Fe+3 ions and nitrogen
atom of the amino groups on CNP-PANI surface enables this composite material as a promising nanosensing platform for Fe+3 ions with high efficiency and selectivity criteria. Even if
Cu+2 at high concentration interferes with Fe+3 detection, the issue can be circumvented by using ethylenediaminetetraacetic acid (EDTA) as a strong chelating agent of Cu+2 ions,[57]
indi-cating also the ability of transforming our system toward the Fe+3 selectivity.
In summary, incorporation of carbon nanoparticles within polyaniline has been proven to be an effective strategy for pro-ducing fluorescent CNPs. Moreover, no further chemical modi-fication is needed before using cooking oven produced trash carbon materials; thus, it incorporates green nanotechnology for efficient reduction of waste products and offers the advan-tages of an economic and less toxic procedure for application. Such CNP-PANI nanocomposites exhibited excitation-wave-length-independent photoluminescent behavior with lumi-nescence intensity progressively increasing as the CNPs con-tent increased; the optimal condition was also achieved where photo luminescence reached its maximum. The CNP-PANI nanocomposites exhibit broad PL spectra covering most of the visible range but with three distinct intense peaks, thus opening up the possibility of using these materials as luminophores in white light LEDs and multicolor patterning systems. As- synthesized CNP-PANI has been further tested as a sensing platform for metal ions which provided data in support of its highly sensitive detection ability for Fe+3 and Cu+2 ions. Our
present study is important because it provides a simple, low-cost route toward incorporating carbon nanoparticles within a polymer to get CNP-PANI that can be used further for sensing and other optoelectronics devices.
3. Experimental Section
Reagents and Materials: CNPs used in the present work were simply
the waste carbon product collected from cooking oven (the morphology of the waste carbon comprised of CNPs is discussed later in the Results and Discussions). Aniline monomer (Aldrich) was distilled under vacuum prior to use. Ammonium persulfate (APS; 99.99%, Aldrich) and all other reagents like hydrochloric acid (HCl; 35%, Alfa Aesar) and absolute ethanol (>99.99%, Alfa Aesar) were used as received without further purification. The salts used for ion detection are NaCl, KCl, CaCl2,
CdCl2, MgCl2, MnCl2, FeCl3, AgNO3, CuCl2.2H2O, CoCl2, PbCl2, and
ZnCl2. Deionized (DI) water was used throughout all the experiments.
Preparation of CNP-PANI: Waste carbon products were used
here without any further chemical modification or purification. The preparatory strategy was both green and economic. The polymerization was done in 1:1 (v/v) ethanol-water media. Ethanol here helped to disperse the CNPs within precursor during reaction and also slow down the polymerization process to some extent. The CNPs were introduced into the polymer following a typical chemical oxidative polymerization of aniline at 0 °C (ice bath) in presence of APS as oxidant and HCl as dopant. Aniline was added to 20 mL of ethanol-water solution and cooled at 0 °C. Some amount of CNPs (for different samples preparation, 1.1, 2.2, and 4.4 mg) was dispersed in 10 mL of ethanol-water mixture (to ensure stable dispersion it was mildly stirred for 1 h on a magnetic stirrer with 430 rpm speed) and then APS and HCl (both used with the same number of moles as the number of moles of aniline monomer) were added to it. After that, this mixture was kept for cooling at 0 °C for few minutes and then was dropwise added to the precooled monomer solution with 10 s shaking. The polymerization was allowed to continue unagitated for 1.5 h or more (for other samples with time
Figure 8. Ion detection by PL spectra. a) Dependence of PL emission
spectra (λEX = 500 nm) on Fe+3 ions concentration (0–6.3 × 10⁻⁶m) in
mix-ture with CP-T4 sample (10 µg mL−1). b) Corresponding ion detection plot
of relative PL emission ((I0 − IFe+3)/I0, where I0 is the PL emission of
as-synthesized material without any ions and IFe+3 is the PL emission upon
addition of Fe+3 ion) at 596 nm for Fe+3 concentration (0–60 × 10−6m)
for sample CP-T4. Inset: The same detection plot of Fe+3 ions
concen-tration (0–120 × 10−6m) for the sample of -CP-T4 (orange color) and
-CP-T4 (purple color). It has been noted that the detection value strikes at 0.56 for 9.5 × 10⁻⁶m of Fe+3 ions for CP-T4, but the value is much
lower for the sample of -CP-T4 and -CP-T4 (0.09 and 0.16, respec-tively). However, from the linear fitting, the estimated LOD for Fe+3 ion is ≈12 × 10−9m for CP-T4.
UNCORRECTED PROOF
1 2 3 4 5 6 7 8 9 10 11 12 13 14 15 16 17 18 19 20 21 22 23 24 25 26 27 28 29 30 31 32 33 34 35 36 37 38 39 40 41 42 43 44 45 46 47 48 49 50 51 52 53 54 55 56 57 58 59 1 2 3 4 5 6 7 8 9 10 11 12 13 14 15 16 17 18 19 20 21 22 23 24 25 26 27 28 29 30 31 32 33 34 35 36 37 38 39 40 41 42 43 44 45 46 47 48 49 50 51 52 53 54 55 56 57 58 59variations, e.g., 2, 2.5, and 3 h). The dark green precipitate was collected after filtration and several times washing with DI water and methanol and was finally dried in a vacuum oven at 60 °C for 24 h. Either powders or films were obtained depending on the nature of characterization requirements. The optimized sample was obtained by using 2.2 mg of CNPs; hence the following nomenclature is used: CP for the series of the optimized ones with different time durations like T1 (1.5 h), T2 (2 h), T3 (2.5 h), T4 (3 h); l-CP and h-CP for lower and higher concentrations of CNPs (i.e., 1.1 and 4.4 mg), respectively.
Characterizations: The measurement of phase imaging under bias
voltage has been performed by AFM (Asylum MFP-3D) in tapping mode using high-resolution conducting probe. Morphological studies and composition analysis were carried out by FESEM-FIB (Carl Zeiss Auriga Crossbeam microscope) equipped with an EDX (OXFORD) analyser. The samples were further characterized by FTIR spectroscopy and UV–vis–NIR spectroscopy (Shimadzu, UV-3101PC). FTIR spectra for the samples were acquired using an attenuated total reflectance (ATR) sampling accessory (Smart iTR) equipped with a single-bounce diamond crystal on a Thermo Nicolet 6700 Spectrometer (used in the absorbance mode at 50 scans with a resolution of 4 cm−1 for frequency
range 400–4000 cm−1). XPS was performed on a KRATOS Analytical
AMICUS instrument equipped with an achromatic Al Kα X-ray source (1468.6 eV). For a typical analysis, the source was operated at voltage of 10 kV and current of 10 mA. The survey spectra were acquired using a step of 1 eV, whereas 0.1 eV was employed for acquiring narrow scan regions. The pressure in analysis chamber was less than 5 × 10⁻⁶
Pa. The deconvolution of peaks was done by fitting with a Gaussian– Lorentzian ratio of 0.5 and a constant FWHM of 1.9 eV. The binding energy of all samples was corrected for eventual charging by shifting the convoluted peak intensity of C1s to 284.6 eV. The Raman measurements with the excitation laser line of 532 nm were performed using a WITEC Alpha300AR+ Confocal Raman system in air ambient environment. The room-temperature PL experiments were performed with a PerkinElmer LS-55 instrument using a Xenon lamp as excitation source with an excitation wavelength range from 280 to 560 nm. Also, the optical image was collected by a confocal laser scanning microscope (LSM 700/Carl Zeiss), with 488 nm laser. Afterward, the image analysis was performed using ZEN 2.1 software (Carl Zeiss).
Detection of Ions: The detection of Fe+3 ions was performed in PBS
(10 × 10−3m, pH 7.1) buffer solution. In a typical run, CNP-PANI sample
dispersion (loading 10 µg mL−1) was added into 3 mL of PBS buffer in
a spectrophotometer quartz cuvette, followed by addition of different concentrations of Fe+3 ions. The PL spectra were recorded after reaction
for 15 min. To investigate the selectivity of Fe+3 ions and possible
interference of other cations, following salts were used: NaCl, KCl, CaCl2, CdCl2, MgCl2, MnCl2, FeCl3, AgNO3, CuCl2.2H2O, CoCl2, FeSO4,
and ZnCl2, and tested with the sample stock solution (10 × 10−6m)
in buffer in a similar way. All the experiments were performed at room temperature.
Supporting Information
Supporting Information is available from the Wiley Online Library or from the author.
Acknowledgements
This work was partially financed by FEDER funds through the COMPETE 2020 Programme and National Funds through FCT under the project UID/CTM/50025/2013 and EXCL/CTM-NAN/0201/2012. S.N. was supported by FCT-MEC under fellowship SFRH/BPD/70367/2010. P.C. acknowledges funding from KAUST.
Conflict of Interest
The authors declare no conflict of interest.
Keywords
carbon nanoparticles, functionalization, ion sensing, photoluminescence, polyaniline
Received: September 28, 2017 Revised: October 28, 2017 Published online:
[1] J. Briscoe, A. Marinovic, M. Sevilla, S. Dunn, M. Titirici, Angew.
Chem., Int. Ed. 2015, 54, 4463.
[2] X. Guo, C. F. Wang, Z. Y. Yu, L. Chen, S. Chen, Chem. Commun.
2012, 48, 2692.
[3] P. Mirtchev, E. J. Henderson, N. Soheilnia, C. M. Yip, G. A. Ozin,
J. Mater. Chem. 2012, 22, 1265.
[4] S. Chandra, P. Patra, S. H. Pathan, S. Roy, S. Mitra, A. Layek, R. Bhar, P. Pramanik, A. Goswami, J. Mater. Chem. B 2013, 1, 2375.
[5] H. T. Li, X. D. He, Z. H. Kang, H. Huang, Y. Liu, J. Liu, S. Lian, C. H. T. Sang, X. Yang, S. T. Lee, Angew Chem., Int. Ed. 2010, 49, 4430.
[6] L. Cao, X. Wang, M. J. Meziani, F. Lu, H. Wang, P. G. Luo, Y. Lin, B. A. Harruff, L. M. Veca, D. Murray, S.-Y. Xie, Y.-P. Sun, J. Am.
Chem. Soc. 2007, 129, 11318.
[7] S. T. Yang, L. Cao, P. G. Luo, F. Lu, X. Wang, H. Wang, M. J. Meziani, Y. Liu, G. Qi, Y.-P. Sun, J. Am. Chem. Soc. 2009, 131, 11308. [8] S. J. Zhu, J. H. Zhang, L. Wang, Y. B. Song, G. Y. Zhang, H. Y. Wang,
B. Yang, Chem. Commun. 2012, 48, 10889.
[9] B. Kong, A. Zhu, C. Q. Ding, X. M. Zhao, B. Li, Y. Tian, Adv. Mater.
2012, 24, 5844.
[10] S. Liu, J. Tian, L. Wang, Y. Zhang, X. Qin, Y. Luo, A. M. Asiri, A. O. Al-Youbi, X. Sun, Adv. Mater. 2012, 24, 2037.
[11] J. Zhang, Y. Yuan, Z. L. Yu, A. Yu, S. H. Yu, Small 2014, 10, 3662. [12] X. Li, S. Zhang, S. A. Kulinich, Y. Liu, H. Zeng, Sci. Rep. 2014, 4,
4976.
[13] J. Ju, W. Chen, Biosens. Bioelectron. 2014, 58, 219. [14] J. Ju, R. Zhang, S. He, W. Chen, RSC Adv. 2014, 4, 52583. [15] J. Ju, W. Chen, Anal. Chem. 2015, 87, 1903.
[16] J. Ju, R. Zhang, W. Chen, Sens. Actuators, B 2016, 228, 66.
[17] S. Zhu, Y. Song, X. Zhao, J. Shao, J. Zhang, B. Yang, Nano Res.
2015, 8, 355.
[18] Z. C. Yang, M. Wang, A. M. Yong, S. Y. Wong, X. H. Zhang, H. Tan, A. Y. Chang, X. Li, J. Wang, Chem. Commun. 2011, 47, 11615. [19] J. Zhou, X. Zhou, R. Li, X. Sun, Z. Ding, J. Cutler, T. K. Sham, Chem.
Phys. Lett. 2009, 474, 320.
[20] S. Qu, H. Chen, X. Zheng, J. Cao, X. Liu, Nanoscale 2013, 5, 5514. [21] Z. Gan, X. Wu, Y. Hao, Cryst. Eng. Commun. 2014, 16, 4981. [22] Z. Gan, S. Xiong, X. Wu, T. Xu, X. Zhu, X. Gan, J. Guo, J. Shen,
L. Sun, P. K. Chu, Adv. Opt. Mater. 2013, 1, 926.
[23] N. S. Sariciftci, L. Smilowitz, A. J. Heeger, F. Wudi, Science 1992,
258, 1474.
[24] S. Goswami, S. Nandy, T. R. Calmeiro, R. Igreja, R. Martins, E. Fortunato, Sci. Rep. 2016, 6, 19514.
[25] Y. Liao, C. Zhang, Y. Zhang, V. Strong, J. Tang, X.-G. Li, K. Kalantar-zadeh, E. M. V. Hoek, K. L. Wang, R. B. Kaner, Nano
Lett. 2011, 11, 954.
[26] I. Kovalenko, D. G. Bucknall, G. Yushin, Adv. Funct. Mater. 2010, 20, 3979.
[27] Z. Gan, H. Xu, Y. Hao, Nanoscale 2016, 8, 7794.
[28] Y. Dong, R. Wang, H. Li, J. Shao, Y. Chi, X. Lin, G. Chen, Carbon
2012, 50, 2810.
[29] P. Anilkumar, X. Wang, L. Cao, S. Sahu, J.-H. Liu, P. Wang, K. Korch, K. N. TackettII, A. Parenzana, Y.-P. Sun, Nanoscale 2011, 3, 2023.
UNCORRECTED PROOF
1 2 3 4 5 6 7 8 9 10 11 12 13 14 15 16 17 18 19 20 21 22 23 24 25 26 27 28 29 30 31 32 33 34 35 36 37 38 39 40 41 42 43 44 45 46 47 48 49 50 51 52 53 54 55 56 57 58 59 1 2 3 4 5 6 7 8 9 10 11 12 13 14 15 16 17 18 19 20 21 22 23 24 25 26 27 28 29 30 31 32 33 34 35 36 37 38 39 40 41 42 43 44 45 46 47 48 49 50 51 52 53 54 55 56 57 58 59 www.advancedsciencenews.com www.advsustainsys.com[30] S. Zhu, J. Zhang, S. Tang, C. Qiao, L. Wang, H. Wang, X. Liu, B. Li, Y. Li, W. Yu, X. Wang, H. Sun, B. Yang, Adv. Funct. Mater. 2012, 22, 4732.
[31] X. Zhai, P. Zhang, C. Liu, T. Bai, W. Li, L. Daic, W. Liu, Chem.
Commun. 2012, 48, 7955.
[32] S. Nandy, G. Gonçalves, J. V. Pinto, T. Busani, V. Figueiredo, L. Pereira, R. F. P. Martins, E. Fortunato, Nanoscale 2013, 5, 11699. [33] S. Golczak, A. Kanciurzewska, M. Fahlman, K. Langer, J. J. Langer,
Solid State Ionics 2008, 179, 2234.
[34] B. P. Payne, M. C. Biesinger, N. S. McIntyre, J. Electron Spectrosc.
Relat. Phenom. 2011, 184, 29.
[35] G. Wu, L. Li, J. H. Li, B. Q. Xu, Carbon 2005, 43, 2579.
[36] Y. Dong, H. Pang, H. B. Yang, C. Guo, J. Shao, Y. Chi, C. M. Li, T. Yu, Angew. Chem., Int. Ed. 2013, 52, 7800.
[37] M. Trchová, J. Stejskal, Pure Appl. Chem. 2011, 83, 1803.
[38] S. Saravanan, C. J. Mathai, M. R. Anantharaman, S. Venkatachalam, P. V. Prabhakaran, Phys. Chem. Solids 2006, 67, 1496.
[39] S. Goswami, U. N. Maiti, S. Maiti, S. Nandy, M. K. Mitra, K. K. Chattopadhyay, Carbon 2011, 49, 2245.
[40] S. G. Bachhav, D. R. Patil, Am. J. Mater. Sci. 2015, 5, 90. [41] M. C. Bernard, A. Hugot-Le Goff, Electrochim. Acta 2006, 52, 595. [42] R. V. Salvatierra, M. M. Oliveira, A. J. G. Zarbin, Chem. Mater. 2010,
22, 5222.
[43] R. Zhang, W. Chen, Biosens. Bioelectron. 2014, 55, 83.
[44] C.-L. Li, C.-C. Huang, A. P. Periasamy, P. Roy, W.-C. Wu, C.-L. Hsu, H.-T. Chang, RSC Adv. 2015, 5, 2285.
[45] L. Dennany, P. C. Innis, S. T. McGovern, G. G. Wallace, R. J. Forster,
Phys. Chem. Chem. Phys. 2011, 13, 3303.
[46] H. Zengin, B. Erkan, Polym. Adv. Technol. 2010, 21216.
[47] F. Wang, Z. Xie, H. Zhang, C.-Y. Liu, Y.-G. Zhang, Adv. Funct. Mater.
2011, 21, 1027.
[48] C. Wang, H. Lin, Z. Xu, Y. Huang, M. G. Humphrey, C. Zhang, ACS
Appl. Mater. Interfaces 2016, 8, 6621.
[49] Z. Gan, H. Xu, Y. Fu, J. Phys. Chem. C 2016, 120, 29432. [50] T. Trupkea, J. Appl. Phys. 2006, 100, 063531.
[51] D. Deirmendjian, R. Clasen, W. Viezee, J. Opt. Soc. Am. 1961, 51, 620.
[52] X. Gao, C. Du, Z. Zhuang, W. Chen, J. Mater. Chem. C 2016, 4, 6927.
[53] X. Gao, Y. Lu, R. Zhang, S. He, J. Ju, M. Liu, L. Li, W. Chen, J. Mater.
Chem. C 2015, 3, 2302.
[54] K. Qu, J. Wang, J. Ren, X. Qu, Chem. Eur. J. 2013, 19, 7243. [55] S. Liu, R. Liu, X. Xing, C. Yang, Y. Xu, D. Wu, RSC Adv. 2016, 6,
31884.
[56] J. Li, Q. Wang, Z. Guo, H. Ma, Y. Zhang, B. Wang, D. Bin, Q. Wei,
Sci. Rep. 2016, 6, 23558.
[57] S. Liu, J. Tian, L. Wang, Y. Zhang, X. Qin, Y. Luo, A. M. Asiri, A. O. Al-Youbi, X. Sun, Adv. Mater. 2012, 24, 2037.
Q1: Please provide TOC keyword.
Q2: Please provide the highest academic title (either Dr. or Prof.) for all authors, where applicable. Q3: Please define all acronyms at their first appearance in the text.
Q1: TOC Keyword
Green Nanotechnology
Q2: Highest academic title for all authors, where applicable.
Dr. S. Goswami, Dr. S. Nandy, Dr. J. Deuermeier, Dr. D. Nunes, Dr. S. P. Patole, Prof. P. M. F. J. Costa,
Prof. R. Martins, Prof. E. fortunato.
Q3. All acronyms are defined at their first appearance in the text.
Comments: In Acknowledgment part, we have inserted two more funding agencies which are crucial,
Project 1D-NEON (GA No. 685758), BET-EU (GA No. 692373); Please insert them.
Also, in the text, we have commented that ''l'' and ''h'' should be used in the similar font as they are used in the
Figure 4 or 8 and also in the figure captions.
Wiley-VCH Verlag GmbH & Co. KGaA A company of John Wiley & Sons, Inc. - Location of the Company: Weinheim - Trade Register: Mannheim, HRB 432833. Chairman of the Supervisory Board: Stephen Michael Smith.
General Partner: John Wiley & Sons GmbH, Location: Weinheim
Trade Register Mannheim, HRB 432296 Managing Director: Sabine Steinbach und Guido Herrmann
Reprint Order Form
Please complete this form and return it via E-Mail to the
Editorial Office at
E-mail: advsustainsys@wiley-vch.de
Wiley-VCH Verlag GmbH & Co. KGaA
Manuscript No.: __________________________________
Advanced Sustainable Systems
Customer No.: (if available) _________________________
Boschstr. 12
Purchase Order No.: __________________________
69469 Weinheim
Author: ___________________________________
Germany
Date: _______________________________________
Charges for Reprints in Euro (excl. VAT), prices are subject to
change. Minimum order 50 copies; single issues for authors at a
reduced price.
Information regarding VAT: Please note that from German sales tax point of
view, the charge for Reprints, Issues or Posters is considered as supply of goods and therefore, in general, such delivery is a subject to German sales tax. However, this regulation has no impact on customers located outside of the European Union. Deliveries to customers outside the Community are automatically tax-exempt. Deliveries within the Community to institutional customers outside of Germany are exempted from the German tax (VAT) only if the customer provides the supplier with his/her VAT number. The VAT number (value added tax identification number) is a tax registration number used in the countries of the European Union to identify corporate entities doing business there. Starting with a country code (e.g. FR for France), followed by numbers.
No. of pages 50 100 150 200 300 500
copies copies copies copies copies copies
1 4 345, 395, 425, 445, 548, 752, 5 8 490, 573, 608, 636, 784, 1077, 9 12 640, 739, 786, 824, 1016, 1396, 13 16 780, 900, 958, 1004, 1237, 1701, 17 20 930, 1070, 1138, 1196, 1489, 2022, every additional 4 pages 147, 169, 175, 188, 231, 315,
Please send me and bill me for
no. of reprints
airmail
(+ 25 Euro)surface mail
Fedex No.:
no. of issue
airmail
(+ 25 Euro)(1 copy: 54 Euro)
surface mail
Fedex No.:
high-resolution PDF file
(330 Euro)E-mail address:
Special Offer:
If you order 200 or more reprints you will
get a PDF file for half price.
Please note: It is not permitted to present the PDF file on
the internet or on company homepages.
Cover Posters (prices excl. VAT)
Posters of published covers are available in two sizes:
DIN A2 42 x 60 cm / 17 x 24in (one copy: 39 Euro)
DIN A1 60 x 84 cm / 24 x 33in (one copy: 49 Euro)
Postage for shipping posters overseas by airmail:
+ 25 Euro
Postage for shipping posters within Europe by surface
mail: + 15 Euro
_________________________________________
Date, Signature
VAT number: ______________________________
Mail reprints / copies of the issue to:
_________________________________________
_________________________________________
_________________________________________
_________________________________________
_________________________________________
Send bill to:
_________________________________________
_________________________________________
_________________________________________
_________________________________________
I will pay by bank transfer
I will pay by credit card
VISA, Mastercard and AMERICAN EXPRESS
For your security please use this link (Credit Card
Token Generator) to create a secure code Credit
Card Token and include this number in the form
instead of the credit card data. Click here:
https://www.wiley-vch.de/editorial_production/index.php