WORKING PAPER SERIES
CEEAplA WP No. 02/2012
The Demand of Car Rentals: a
Microeconometric Approach with Count
Models and Survey Data
António Gomes de Menezes Ainura Uzagalieva
The Demand of Car Rentals: a Microeconometric
Approach with Count Models and Survey Data
António Gomes de Menezes
Universidade dos Açores (DEG e CEEAplA)
Ainura Uzagalieva
Universidade dos Açores (CEEAplA e CERGE-EI)
CEEAplA Working Paper n.º 02/2012 Janeiro de 2012
RESUMO/ABSTRACT
The Demand of Car Rentals: a Microeconometric Approach with Count Models and Survey Data
The purpose of this study is to analyze the demand side of the tourist market in a small island economy, the Autonomous Region of the Azores, a Portuguese region experienced a rapid growth in the tourism sector in the last decade. Azorean islands are, normally, a “fly-and-drive” destination given the high frequency of car rentals by the tourists. It is well known that the excessive use of cars can lead to negative externalities such as pollution and the degradation of roads. Considering the growing number of tourist in the Azores and ecological fragility that is typical for small islands, it is crucially important to investigate the extent of these negative externalities. This phenomenon is very important in terms of policy-making on the management of tourism in small island economies as well as in the global environmental context from the perspectives of effective "eco-taxes", used as instruments for internalizing negative externalities and enhancing environmental protection. To this end, the demand function of car rentals is analyzed with the use of the family of count models and the unique micro-level survey data, conducted on a large number of tourists visited the region. Based on the price elasticity of demand for care rentals, we then suggest desired tax rates for internalizing the congestion costs.
Keywords: count data models, survey data, tourism, market demand, car
rentals.
António Gomes de Menezes Universidade dos Açores
Departamento de Economia e Gestão Rua da Mãe de Deus, 58
9501-801 Ponta Delgada Ainura Uzagalieva
Universidade dos Açores
Departamento de Economia e Gestão Rua da Mãe de Deus, 58
The Demand of Car Rentals: a Microeconometric Approach
with Count Models and Survey Data
Antonio Menezesa and Ainura Uzagalievab
Abstract
The purpose of this study is to analyze the demand side of the tourist market in a small island economy, the Autonomous Region of the Azores, a Portuguese region experienced a rapid growth in the tourism sector in the last decade. Azorean islands are, normally, a “fly-and-drive” destination given the high frequency of car rentals by the tourists. It is well known that the excessive use of cars can lead to negative externalities such as pollution and the degradation of roads. Considering the growing number of tourist in the Azores and ecological fragility that is typical for small islands, it is crucially important to investigate the extent of these negative externalities. This phenomenon is very important in terms of policy-making on the management of tourism in small island economies as well as in the global environmental context from the perspectives of effective "eco-taxes", used as instruments for internalizing negative externalities and enhancing environmental protection. To this end, the demand function of car rentals is analyzed with the use of the family of count models and the unique micro-level survey data, conducted on a large number of tourists visited the region. Based on the price elasticity of demand for care rentals, we then suggest desired tax rates for internalizing the congestion costs.
Keywords: count data models, survey data, tourism, market demand, car rentals
a
Centre of Applied Economics Studies of the Atlantic at the Department of Economics and Management, the University of the Azores, Portugal. Rua da Mãe de Deus, 9501-801, Ponta Delgada, S. Miguel Azores, Portugal; e-mail: [email protected]
b
Centre of Applied Economics Studies of the Atlantic at the Department of Economics and Management, the University of the Azores, Portugal; CERGE-EI, Charles University and the Academy of Sciences, Prague, Czech Republic. Centre of Applied Economics Studies of the Atlantic at the Department of Economics and
Management, the University of the Azores, Rua da Mãe de Deus, 9501-801, Ponta Delgada, S. Miguel Azores, Portugal; e-mail: [email protected], [email protected]
1. Introduction
Tourism is becoming one of the important and fast growing economic activities around the globe. In recent years, it has grown around 4-5% per year and it represented around 10% of the gross domestic product (GDP) and investment worldwide in 2010. According to the World Travel and Tourism Council (WTTC), it is expected that the tourism sector will continue to rise, from about 9% in 2011 to 10% by 2020 of global GDP, at the annual rate of about 4.4%, supporting 303 million jobs around the globe. Consequently, the sector is becoming one of the important fields of fiscal actions as well, especially in tourist destination countries. The tax receipts generated by the tourism sector alone, for example, represented more than 10% of the tax revenue collected by some developed countries (McAleer, Shareef and Veiga 2005). This figure can be much larger in small island economies, where tourism plays a dominant role in economic growth and accounts for a large proportion in GDP (Shareef 2003). Shareef (2003) provides the definition and unique characteristics of small island economies. These are a relatively small size in terms of population and territory, the island nature with corresponding ecology and climate, and heavy reliance on tourism receipts due to limited production capacity.
Vast globalization and the increasing role of tourism in economic growth prompted research on tourism in recent economic and academic literature (e.g. Clarke and Ng 1993; Dwyer, Forsyth and Spur 2004; Lanza, Markandya and Pigliaru 2005; Gago, Labandiera, Picos and Rodriguez 2009; Green, Hunter and Moore 1990; Palmer-Tous, Riera-Font and Rosello-Nadal 2007; Seetanah 2010; Sequeira and Nunes 2008). For example, the dynamic contribution of tourism to the economic growth of 19 island economies, within the conventional augmented Solow growth model, is explored in Seetanah (2010). The study suggests that tourism significantly contributes to the economic growth of island economies.
Similar view is confirmed in Sequeira and Nunes (2008), who argue that tourism is a positive determinant of economic growth in a broad sample of countries, including poor and small countries, where earnings from tourism is one of the important sources of foreign exchange and employment.
Small islands are considered economically and environmentally vulnerable, due to “their delicate ecosystems with regard to global warming and rises in sea levels” (Shareef and McAleer 2005, p. 314). The ecological fragility of the small island economies prompted island-related research on tourism in order to address various problems and opportunities for the small island economies in the period of vast globalization. In particular, fiscal actions and the concept of tourism taxation are covered in Gago et al. (2009), where the specific and general mechanisms of indirect taxation are analyzed and compared. According to the authors, general indirect taxation may be a more feasible, equitable, and neutral way to obtain tax revenues from tourism. Congestion externalities caused by car rentals are considered in Palmer-Tous et al. (2007) with the use of the family of count data models for the analyzing the demand of car rentals by tourists.
The purpose of this study is to analyze the demand side of the tourist market in a small island economy, the Autonomous Region of the Azores, the Portuguese region with the highest growth rate of tourism in the last decade. According to Menezes, Moniz and Vieira (2008) and Menezes, Vieira and Carvalho (2009), tourist arrivals increased largely from 159 thousand in 1995 to 260 thousand in 2005, while the number of visitors in touristic accommodations more than doubled, rising from 407 thousand in 1995 to 936 thousand in 2005. Such a rapid increase resulted from large public investments in the sector with the total number of hotels growing from 3 thousand in 1995 to 10 thousand in 2005 (Menezes et al. 2009). Azorean islands are, normally, a “fly-and-drive” destination given the high frequency
of car rentals by the tourists (Menezes et al. 2008). It is well known that the excessive use of cars can lead to negative externalities such as pollution and degradation of roads. Considering the growing number of tourist in the Azores and ecological fragility typical for small islands, it is crucially important to investigate the extent of these negative externalities, which by definition constitute deviation from socially optimal situation. The social optimum is reached when externalities are internalized by imposing fees or a single tax on the generator of a negative externality directed, in this particular case, at reducing the costs caused by the use of cars rentals - congestion externalities (Palmer-Tous et al. 2007). This phenomenon is very important not only in terms regional public policy-making on tourism management in Azores, but also in the global environmental context. Specifically, from the perspectives of effective "eco-taxes" which are used as instruments for regional policy-making in internalizing negative externalities, enhancing environmental protection and promoting social optimum welfare.
The demand of car hire based on the family of count-models. Different ways of modeling the demand function of car rentals are examined with the use of the unique micro-level survey data, covering a large number of tourists visited the region. These surveys include detailed information on the demographic characteristics of tourists (e.g. citizenship, age and gender), their social and economic status (e.g. marital status, education, occupation, income and the number of travels), experiences, habits and satisfaction in finding accommodation, visiting the islands, renting vehicles and other activities.
2. Tourism taxation: foundations and mechanism
The public regulation and taxation of tourism play a crucially important role in pursuing a balanced net social benefit. This is because the tourism sector brings not only
economic benefits (additional value added and employment), but also incurs various costs such as congestion and environmental degradation. Among various public instruments for correcting these costs, the taxing of tourism became a very attractive tool for its role in internalizing the congestion costs (e.g. Gago et al. 2009; Green et al. 1990; Palmer-Tous et al. 2007). There are a number of reasons for that. First of all, taxing is related to the magnitude of potential revenues obtained from the tourist activity. The second reason is that taxes paid by tourists can act as a substitute for the prices of the public goods and services consumed by tourists. Finally, taxes can play a corrective role in internalizing the external costs resulted from tourist activities. This reason relates, basically, to environmental costs and congestion (Fujii, Khaled and Mak 1985; Green et al. 1990). Therefore, public intervention through the taxation of tourism is very important, since corrective taxes lead to the inclusion of environmental and congestion (external) costs in the final price of the tourism package (Clarke and Ng 1993). For these reasons, many countries introduced the wide range of taxes on the tourism sector (Gago et. al 2009).
A taxable base for internalizing the congestion costs can be defined in several ways. Acoording to Palmer-Tous et. al (2007), it can be done by vehicle traffics in the congested area. The tax rate is equivalent to external congestion costs (Newbery 1990). Alternatively, tax bases can be linked to the traffic flows through congested areas, directly or indirectly (Hau 1992; De Borger, Peirson and Vickerman 2001). The direct mechanism includes licensing schemes, road tolls and different electronic road pricing systems, while the indirect one includes vehicles taxes, parking fees or fuel taxes. The tax rates, in these cases, should differ, depending on the degree of congestion caused by cars at different times and places. For this reason, Mayeres and Van Dender (2001) suggested that a tax levy should be applied at times
when there is “a surplus demand over and above a fixed capacity and in places where congestion occurred leading to incremental time losses”.
The direct tax mechanism levied on vehicles implies that distance travelled or congested areas are taken into careful consideration when internalizing external environmental costs. This can be achieved by the introduction of a quite advanced technology, such as electronic pricing system with vehicle identification capacity enabling to distinguish the hired cars one from others. Due to the fact that this type of technology is still in the early stage of development, the introduction of the direct tax mechanism is complex and costly in terms of investments required for identification the cars and control systems.
The indirect tax mechanism, on the contrary, has little relation to the distance traveled and the use of congested areas. In addition, it does not differentiate tax bases spacialy or temporally. Thus, they have a low corrective capacity for externalities associated with the environment and traffic accidents due to the low level of differentiation and lack of variability that European Union taxes of this kind tend to have (European Commission, 2002). Nevertheless, these instruments are helpful for correcting the atmospheric or noise-related externalities. Since taxes levied on cars are not a very suitable instrument for internalizing external environmental and congestion costs (Palmer-Tous et. al 2007), due to the increase of vehicle numbers (private and hired cars), taxes on fuel consumption are considered a better
proxy. The taxable base in this case is the rate of daily car rentals which allow to fix a daily
amount of the tax to be collected from every car.
3. Empirical model
A standard framework for the analysis of count data are Poisson regression models. The count data contain very often the incidence of zero counts, therefore the data can be
largely over-dispersed to the Poisson distribution. Due to this feature, there has been considerable interest in the econometric literature so far in modeling the count data, with the view of accounting properly the excess zeros. These studies are very diverse and include those from different fields as, for example, manufacturing defects (Lambert 1992), patent applications (Crepon and Duguet 1997), road safety (Miaou 1994), species abundance (Welsh, Cunningham, Donnelly and Lindenmayer 1996), medical consultations (Gurmu 1997), use of recreational facilities (Gurmu and Trivedi 1996) and sexual behavior (Heilbron 1994). In this section, we review and compare the count methods with a particular focus on the market demand of care hire.
The choice of count models in our study is justified by certain restrictions imposed on the dependent variable: the duration of car rentals cannot take a negative value. These models have been used in earlier studies focused on a market demand (Hellerstein 1991; Smith 1988; Palmer-Tous et. al 2007). Since not all respondents would arrange the car rentals, with the zero number of days in using cars, the skewed distribution of the explanatory variable should be expected with heavy concentration of zeros in tails. Taking into account that this leads to biased estimations, we use the trancated and zero-inflated Poisson regression and negative binomial regression models as well. In addition to these models, a logit model is estimated to explain underlying factors for the choice of car rentals.
The demand function of a car rental is defined in a generic and standard form as follows:
DCi stands for the number of days an individual i arranges to rent a car (i.e. i=0,1,2…) and xi
is the vector of variables including the rental price per day (PD) and the set of socioeconomic variables characterizing the tourists. The Poisson distribution (P) as an initial modeling approach is, as used in Palmer-Tous (2007):
(2)
The term W in the expression (2) is the i-th observation of the discrete variable of interest with w representing the set of non-negative variables such that (w =0, 1, 2,…). The term N represents the number of observations and the parameter λ denotes the mean and the variance of random variable Wi, defined as:
(3) , where
X is a matrix N×K of explanatory variables and β is a vector of parameters to be estimated
with the K dimension. According to Cameron and Trivedi (1986), the ratio of the conditional mean and the variance of the dependent variable can be greater than one under over-dispersion. This leads to a downward bias in the standard errors of the parameter β. In order to treat this issue, we use a standard negative binominal distribution (NB), defined as:
A non-observable price for those tourists, who choose not to hire a car, can lead to a zero truncation and possible bias in the estimation of the parameter β within the set-up provided in the expressions (2) and (4). This problem can be dealt by estimating the Zero-Truncated Poisson (TP) and Zero-Truncated Negative Binomial (TNB) models suggested in Gerdtham (1997) and Lee, Wang, Yau and Somerford (2003), where the left-truncated density functions (k=0) can be expressed as the following expressions for t he TP and TNB processes, respectively (Grogger and Carson 1991):
(5)
(6)
Following Cragg (1971), Mullahy (1986) and Palmer-Tous et. al (2007), we use in addition to the abobe-mentioned specifications, a two-step process. The reason for this is to reflect the decision of tourists whether to hire a car or not as the first step, and then their decision for how long to hire as the second step. The advantage of this approach is in allowing to admit zeros in both stages which can potentially have a high number of observations if demand for car rental is weak. Johnson, Kotz and Kemp (1992), Lambert (1992) suggest a Zero-Inflated Poisson model (ZIP) with larger extra weights in the probability of an observed zero and smaller likelihood of other observed results defined as a logit-type binary choice model. Consequently, the ZIP model represents a mixture that combines a count component and a point mass at zero, defined as:
(7)
In the expression (7), represents the probability of non-participation in the car rental market with Poissin function. Greene (1994) provides the details of analogous Zero-Inflated Negative Binomial (ZINB) regression models as:
(8)
4. Application of the count models for the market of car rental in the Azores
The data used in this study come from the survey conducted at the main regional airports on tourists visited the Azores in the summer of 2007, as mentioned. The data were gathered by the Studies and Consultancy Department of Norma - Acores, through a questionnaire elaborated specifically to this end. The brief description of the sample data is in Table (1). In total, 1000 questionnaires were distributed and from these questionnaires, 110 were not responded back. Consequently, this study is based on a sample of 890 questionnaires, from which 50.6% were answered by male respondents. The average age of the interviewees is 43 with the youngest age 18 and the oldest 77. The sample median is 47 years old.
The marital status of the interviewees looks as folows: 633 were married, representing 71% of the sample; 23.5% were single; and 5% of the interviewees had a different marital
status. The country residence of the 302 interviewees is Portugal, representing abound 33.9% in the sample data. The second largest country, in terms of the origin of tourists, is Sweden with 10.2% of visitors and the third place belongs to Germany with about 7.4% tourists. According to Table 1, 47.8% of the interviewees did have high university education, while 36.9% did have secondary school or technical education. From the 890 interviewees, 127 attended school until the 9th grade only.
Table 1. Sample descriptive statistics
The work status of the toursists is characterized as the following: 80.67% of respondents were employed, 9% were retired, 6.5% represented students, 2.6% were housewives, and 0.8% were unemployed at the moment of conducting the surveys. Most tourists did not have Azorean origin or local tires, representing about 84.2% of population, while some (18% of the interviewed women and 14% of the men) did have such connections. Therefore, the main reason of the visit was holidays or pleasure for 83.4% of the interviewees, while 11.2% came for visiting friends or relatives. Only 4.4% of the interviewees visited the islands for business or professional motives.
The data presented in Table 1 suggests that 71% of the interviewees visited the Azores for the first time, 11.9% had visited once, and 17.1% had been visiting twice or more in the past. To the question of whether individuals considered alternative destinations before coming to the Azores, the 72.8% of respondents answered negatively, that they did not consider other alternative destinations. With respect to the overall satisfaction of the interviewers, regarding the visit to the Azores, 39.4% answered that they were “pleased”, while 58.3% gave a “very
pleased” answer. From the whole sample group, 497 tourists hired cars as a means of
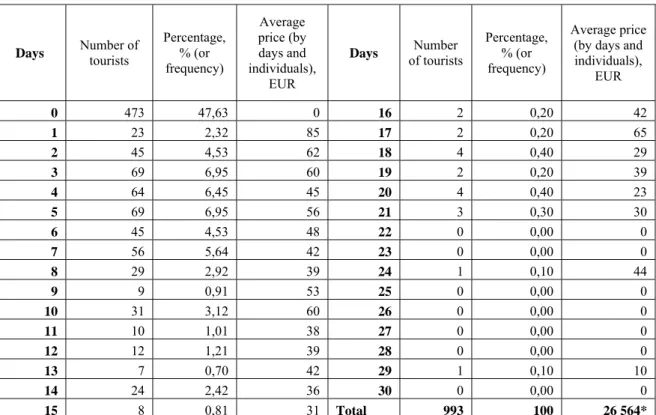
transport, while 473 chose not to hire. The distribution of car rentals by days and the number of individuals is shown in Table 2. The numbers demonstrate that the majority of tourists (about 35%) rented cars from 2 to 7 days, which made about 72.92% of total expences spent by all tourists on renting cars.
Table 2. The distribution of car hire by days
Days Number of tourists
Percentage, % (or frequency) Average price (by days and individuals), EUR
Days of tourists Number
Percentage, % (or frequency)
Average price (by days and individuals), EUR 0 473 47,63 0 16 2 0,20 42 1 23 2,32 85 17 2 0,20 65 2 45 4,53 62 18 4 0,40 29 3 69 6,95 60 19 2 0,20 39 4 64 6,45 45 20 4 0,40 23 5 69 6,95 56 21 3 0,30 30 6 45 4,53 48 22 0 0,00 0 7 56 5,64 42 23 0 0,00 0 8 29 2,92 39 24 1 0,10 44 9 9 0,91 53 25 0 0,00 0 10 31 3,12 60 26 0 0,00 0 11 10 1,01 38 27 0 0,00 0 12 12 1,21 39 28 0 0,00 0 13 7 0,70 42 29 1 0,10 10 14 24 2,42 36 30 0 0,00 0 15 8 0,81 31 Total 993 100 26 564*
The sample data employed for the estimations of count models cover the number of days in renting a car, a rental price per day, average daily expenses, and the set of dummy variables representing: the countries of residence; accommodation type (hotel or other); the level of education (university or lower); martial status (single or married); family roots in the Azores (have ties or not); work status (employed or retired; employed and student); and the number of companions (alone or with adults; alone or with children). With these sample data, the different specifications of the demand function are estimated, using the models presented in section 3 (P, NB, TP, TNB, ZIP and ZINB).
The TP and TNB models include only those individuals choosing to rent a car, while the rest of the models are estimated on the whole sample. The results of the estimations are presented in Table 3.
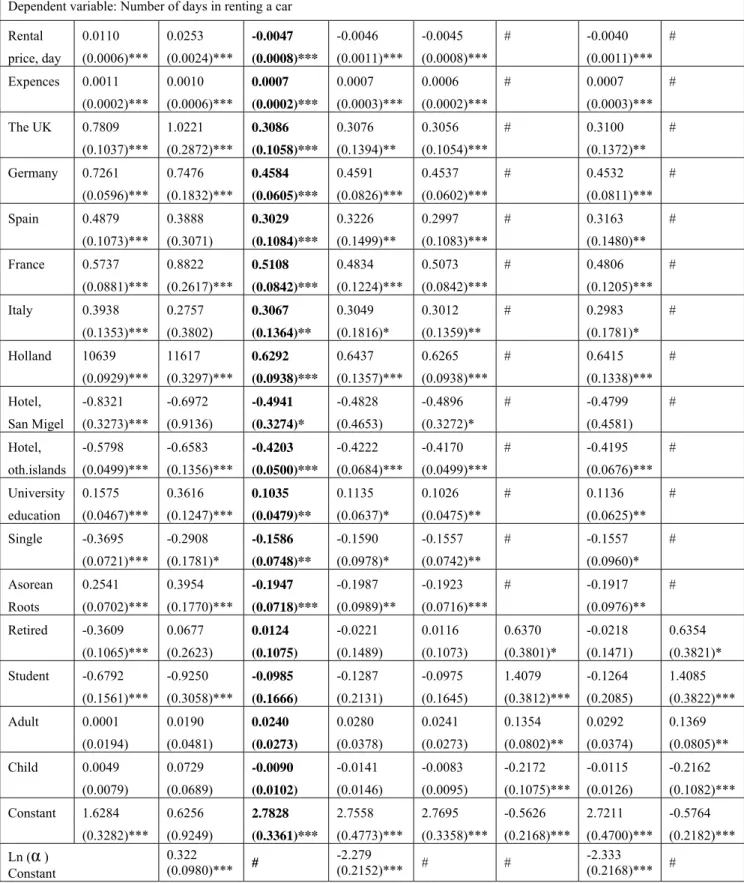
Table 3. Estimation results
P NB TP TNB ZIP Logit ZINB Logit
Dependent variable: Number of days in renting a car
Rental 0.0110 0.0253 -0.0047 -0.0046 -0.0045 # -0.0040 # price, day (0.0006)*** (0.0024)*** (0.0008)*** (0.0011)*** (0.0008)*** (0.0011)*** Expences 0.0011 0.0010 0.0007 0.0007 0.0006 # 0.0007 # (0.0002)*** (0.0006)*** (0.0002)*** (0.0003)*** (0.0002)*** (0.0003)*** The UK 0.7809 1.0221 0.3086 0.3076 0.3056 # 0.3100 # (0.1037)*** (0.2872)*** (0.1058)*** (0.1394)** (0.1054)*** (0.1372)** Germany 0.7261 0.7476 0.4584 0.4591 0.4537 # 0.4532 # (0.0596)*** (0.1832)*** (0.0605)*** (0.0826)*** (0.0602)*** (0.0811)*** Spain 0.4879 0.3888 0.3029 0.3226 0.2997 # 0.3163 # (0.1073)*** (0.3071) (0.1084)*** (0.1499)** (0.1083)*** (0.1480)** France 0.5737 0.8822 0.5108 0.4834 0.5073 # 0.4806 # (0.0881)*** (0.2617)*** (0.0842)*** (0.1224)*** (0.0842)*** (0.1205)*** Italy 0.3938 0.2757 0.3067 0.3049 0.3012 # 0.2983 # (0.1353)*** (0.3802) (0.1364)** (0.1816)* (0.1359)** (0.1781)* Holland 10639 11617 0.6292 0.6437 0.6265 # 0.6415 # (0.0929)*** (0.3297)*** (0.0938)*** (0.1357)*** (0.0938)*** (0.1338)*** Hotel, -0.8321 -0.6972 -0.4941 -0.4828 -0.4896 # -0.4799 # San Migel (0.3273)*** (0.9136) (0.3274)* (0.4653) (0.3272)* (0.4581) Hotel, -0.5798 -0.6583 -0.4203 -0.4222 -0.4170 # -0.4195 # oth.islands (0.0499)*** (0.1356)*** (0.0500)*** (0.0684)*** (0.0499)*** (0.0676)*** University 0.1575 0.3616 0.1035 0.1135 0.1026 # 0.1136 # education (0.0467)*** (0.1247)*** (0.0479)** (0.0637)* (0.0475)** (0.0625)** Single -0.3695 -0.2908 -0.1586 -0.1590 -0.1557 # -0.1557 # (0.0721)*** (0.1781)* (0.0748)** (0.0978)* (0.0742)** (0.0960)* Asorean 0.2541 0.3954 -0.1947 -0.1987 -0.1923 # -0.1917 # Roots (0.0702)*** (0.1770)*** (0.0718)*** (0.0989)** (0.0716)*** (0.0976)** Retired -0.3609 0.0677 0.0124 -0.0221 0.0116 0.6370 -0.0218 0.6354 (0.1065)*** (0.2623) (0.1075) (0.1489) (0.1073) (0.3801)* (0.1471) (0.3821)* Student -0.6792 -0.9250 -0.0985 -0.1287 -0.0975 1.4079 -0.1264 1.4085 (0.1561)*** (0.3058)*** (0.1666) (0.2131) (0.1645) (0.3812)*** (0.2085) (0.3822)*** Adult 0.0001 0.0190 0.0240 0.0280 0.0241 0.1354 0.0292 0.1369 (0.0194) (0.0481) (0.0273) (0.0378) (0.0273) (0.0802)** (0.0374) (0.0805)** Child 0.0049 0.0729 -0.0090 -0.0141 -0.0083 -0.2172 -0.0115 -0.2162 (0.0079) (0.0689) (0.0102) (0.0146) (0.0095) (0.1075)*** (0.0126) (0.1082)*** Constant 1.6284 0.6256 2.7828 2.7558 2.7695 -0.5626 2.7211 -0.5764 (0.3282)*** (0.9249) (0.3361)*** (0.4773)*** (0.3358)*** (0.2168)*** (0.4700)*** (0.2182)*** Ln (α ) Constant 0.322 (0.0980)*** # -2.279 (0.2152)*** # # -2.333 (0.2168)*** # Numbers in brackets are standard errors: ***,**,* , denoting 1%, 5% and 10% significance level, respectively.
The estimated models, which are presented in Table 3, were compared based on test statistics (e.g. χ2 , log-likelihood, AIC, BIC and Vuong statistics) presented in Table 4.
Table 4. Count model test statistics
Statistics: P NB TP TNB ZIP ZINB
Number of observations 532 532 299 299 532 532 R2-pseudo 0.2141 0.0706 0.1662 0.0842 # # χ2 903 177 308 137 305 132 9 74 49 # Log-likelihood -1700 -1200 -770 -750 -1100 -1100
Log-likelihood, model comparison -1700 # -770 # #
Degrees of freedom 18 19 18 19 23 24 Vuong tests 9.23 4.39 Akaike information criterion (AIC) 3352 2380 1583 1536 2294 2248 Bayesian information criterion (BIC) 3429 2461 1650 1606 2392 2351
According to Table 4, the zero-trancated poisson (TP) and zero-inflated poisson (ZIP) models yield similar and better results compared to the Poisson (P) and negative binominal (NB) ones. The dispersion of the Poisson model clearly underestimates the observed dispersion, which can be seen in very large log-likelihoods, χ2 and AIC (or BIC) criterion. Hence, the standard errors of coefficients in the P model are downwardly biased and cannot be considered appropriate for describing the population of interest. This can be the result of latent heterogeneity in the data that cannot be captured by a single parameter λ in the poisson model, causing this oversdispersion due to the large frequency of zeros in the distribution.
One possibility to cope with the overdispersion issue is to assume that the latent heterogeneity can be adequately described by some density in terms of Poisson parameters. The traditional approach is based on using an additional shape parameter (α in our case) in a parametric model with the Gamma distribution, presented in section 3. In this case, the
marginal density becomes the negative binomial. The results obtained by the negative binominal (NB) model in our study suggest that the model improves the fit significantly, performing better than the initial P-model. Still, it is not sufficient for modeling the excess zeros which can be seen from the large values of AIC and BIC criteria, for example. Therefore, the NB model can further be improved by using a non-parametric approach.
The non-parametric approach for dealing with overdispersion consists of weighting the latent heterogenous subset in the data, without specifying any parametric density. This can be done by trancating the non-zero subset in the data or inflating the data by zeros, as it was presented in section 3. In our case, the zero-inflated models combine the (1-π) proportion of extra-zeros with the count poisson and negative binominal distributions, as presented in expressions 7 and 8. Consequently, there are two sources of zeros, which may come from the point mass and count component. For modeling the latent state, a binary logit is used with an intercept and regressors that included four fictitious variables indicating weather the respondents are retired or students, have adult and child accompanies. The intuition behind this is that this subset of population may choose excess zeros due to underlying economic reason.
As shown in Table 3, the regression coefficients and the standard errors obtained by the trancated and zero-inflated models are rather similar, though very different from the poisson and negative binominal estimations. Therefore, in terms of predicted means, the models give very similar results.c The models are further inspected by the associated test statistics, which leads to a conclusion that trancated and zero-inflated models lead to the best results in terms of likelihood on this data set. Overall, both models lead to the same
qualitative results and very similar. Perhaps, the trancated poisson model is slightly preferable in terms of its goodness of fit, which explains about 16.62% of variation in the data.
According to the estimates obtained by the trancated poisson (TP) model, the price variable has a negative sign, as expected; the higher the prices, the weaker the demand for car rentals. Average daily expenditures for a family or travel party, which can serve also as a proxy for the incomes and spending capacity of tourists in our study, have a positive and significant impact on the demand of car hire. Being the residents of the UK, Germany, Spain, France, Italy and Holland seem to cause a stronger demand for the cars rentals. The dummy variables for other countries in the sample are dropped due to insignificant standard errors. Hotel accommodation is found to have a negative impact on the demand, compared to the other types of accommodation, such as renting a flat. Presumably, this reflects the fact that most hotels in the Azores provide organized transport services to their customers, in the form of shuttle or tourist buses.
The level of education seems to have a significant and positive impact on the demand of car rentals with the longer time of rentals, compared to those with secondary education only. The coefficients on variables describing the marital status show (single tourists) or family ties with the residents of the Azores (roots) are negative. The coefficients on the dummy variables for students, retired, having adult and infant companions are not significant, according to the results of the TP model. Taken as unobservable latent variables for inflating the ZIP model, however, these variables show high statistical significance. Based on those estimations, one can infer a positive relationship between the duration of car rentals and the certain attributes of tourists, such as whether they are retired or students. Being a tourist with adult accompanies seem to have a positive impact on the demand of car rentals, while for those having children the opposite is likely.
The price elasticity of demand is calculated based on the coefficient on the variable that stands for the price of car hire per day. An increase in the price of rental by 1% leads to the decrease in the duration of car rentals by approximately 29.18%. Consequently, tax rates can be applied to daily rental fees, depending on the petrol consumed and for how long the policy-makers are willing to reduce the duration of car rentals. Table 4 provides the simulated values of a relationship between the price and duration of car rentals based on the TP estimates which resulted in the price elasticity of about 0.29.
Table 4. The effect of price changes on the average number of days
Elasticity of demand is 0.29
Daily tax rates in EUR 2 4 8 12
The effect on the number of days -0.26 -0.62 -1.13 -1.74
Based on these results, one can see that the daily taxes imposed at the rates of 2, 4, 8, and 12
EURs would shorten the number of days by 0.26, 0.62, 1.13 and 1.74 days, correspondingly. As discussed in section 2, the indirect tax mechanism is helpful for correcting the
atmospheric or noise-related externalities, despite its weaknesses discussed in the above-mentioned section. The reason for this is that taxes that are levied directly on cars are not a very suitable tool for internalizing external environmental and congestion costs, due to an increase in the number of private as well as hired cars. Therefore, taxes on the consumption of fuel are suggested to be a good proxy for the taxable base. In this case, the number of days in car rentals allows to determine the rate and amount of the taxes to be collected on a daily basis.
7. Conclusion
This paper focuses on the demand side of the tourist market in a small island economy, the Azores, which experienced a rapid growth in the tourism sector during the last decade. Since the Azorean islands are characterized by the high frequency of car rentals by the tourists, it is crucially important to take into account the extent of negative externalities caused by car rentals. To this end, we analyze the demand function of car rentals by estimating the family of count models on the micro-level survey data. Based on the price elasticity of demand for car rentals, we then suggest desired tax rates for internalizing the congestion costs.
The results reveal that the TP and ZIP models lead to better outcomes in terms of likelihood on our data set. Overall, both models lead to similar qualitative results; however, the TP model is slightly preferable in terms of its goodness of fit, which explains about 16.62% of variation in the data. According to the estimates, the price variable has a negative sign, as expected: the higher the prices, the weaker the demand for car rentals. Based on the coefficient on the price variable, the price elasticity of demand is calculated. It suggests that an increase in the price of rental by 1% leads to a decrease in the duration of car rentals by approximately 29.18%. Consequently, tax rates can be applied to daily rental fees, depending on the petrol consumed and for how long the policy-makers are willing to reduce the duration of car rentals. The simulated values of a relationship between the price and duration of car rentals resulted in the price elasticity of about 0.29. Based on these results, one can see that the daily taxes imposed at the rates of 2, 4, 8, and 12 EURs would shorten the number of days by 0.26, 0.62, 1.13 and 1.74 days, correspondingly. Taxing the consumption of fuel is suggested as a proxy for the taxable base. In this case, the rate and amount of the taxes will be determined based on the number of days in car rentals.
References
Cameron, A.C. and Trivedi, P. (1986): Econometric Models Based on Count Data: Comparisons and Applications of Some Estimations and Tests. Journal of Applied
Econometrics, 1, 29-53.
Clarke, H. and Ng, Y. (1993): “Tourism, Economic Welfare and Efficient Pricing”, Annals of
Tourism Research, 20, pp. 613-632.
Crepon, B. and E. Duguet (1997): Research and Development, Competition and Innovation – Pseudo-Maximum Likelihood and Simulated Maximum Likelihood Methods Applied to Count data Models with Heterogeneity. Journal of Econometrics, 79, pp. 355-378. Cragg, J. G. (1971): Some Statistical Models for Limited Dependent Variables with
Application to the Demand for Durable Goods. Econometrica, 39, pp. 829-844.
De Borger, B., Peirson, J. and Vickerman, R. (2001): An Overview of Policy Instruments. In
Reforming Transport Pricing in the European Union. A Modelling Approach, Eds.
Borger, B. and Proost, S. Edward Elgar, Cheltenham, United Kingdom.
Fujii, E., Khaled, M. and Mak, J. (1985): “The Exportability of Hotel Occupancy and other Tourist Taxes”, National Tax Journal, 38, pp. 169-177.
Gago, A., Labandeira, X., Picos, F. and Rodriguez, M. (2009): Specific and General Taxation of Tourism Activities. Evidence from Spain. Tourism Management, Vol. 3(3), pp.381-392.
Gerdtham, U.G. (1997): Equity in Health Care Utilization: Further Tests Based on Hurdle Models and Swedish Micro Data. Econometrics and Health Economics, 6, pp. 303-319. Green, H., Hunter, C. and Moore, B. (1990): “Assessing the Environmental Impact of
Gurmu, S. (1997): Semi-parametric Estimation of Hurdle Regression Models with an Application to Medicaid Utilization. Journal of Applied Econometrics, 12, pp. 225-242. Gurmu, S. and P. Trivedi (1996): Excess Zeros in Count Models for Recreational Trips.
Journal of Business & Economic Statistics, 14, pp. 469-477.
Grogger, J. and R. Carson (1991): Models for Truncated Counts. Journal of Applied
Econometrics, 6, pp. 225-238.
Heilbron, D. (1994): Zero-altered and other Regression Models for Count data with Added Zeros. Biometrical Journa, 36, 531-547.
Hellerstein, D. M. (1991): Using Count Data Models in Travel Cost Analysis with Aggregate Data. American Journal of Agricultural Economics, 73, 860-866.
Hau, T. (1998): Congestion Pricing and Road Investment. In: Road Pricing, Traffic
Congestion and the Environment, Eds. Button, K.J. and Verhoef, E.T. Edward Elgar,
Cheltenham, United Kingdom.
Johnson, N., Kotz, S. and Kemp, A.W. (1992): Univariate Discrete Distributions, 2nd Edition, Wiley: New York.
Lambert, D. (1992): Zero-Inflated Poisson Regression with an Application to Defects in Manufacturing. Technometrics, 34, 1-14.
Lanza, A., Markandya, A. and Pigliaru, F. (2005): The Economics of Tourism and Sustainable Development, Cheltenham: Edward Elgar Publishing Limited.
Lee, A.H., Wang, K., Yau, K.K.W and Somerford, P.J. (2003): Truncated Negative Binomial Mixed Regression Modelling of Ischaemic Stroke Hospitalitzations. Statistics in
Mayeres, I. and Van Dender, K. (2001): The External Costs of Transport. In Reforming
Transport Pricing in the European Union. A Modelling Approach, Eds. Borger, B. and
Proost, S., chapt. 7, Edward Elgar, Cheltenham, United Kingdom.
Menezes, A., Vieira, J., and Carvalho, J. (2009): Assessing Toursit Satisfaction in the Azores: A Microeconometric Approach. European Journal of Toursim Research, Vol.2(1), pp. 91-122.
Menezes, A., Moniz, A. and Vieira, J. (2008): Determinants of Length of Stay: A Parametric Survival Analysis. Tourism Economics, 14(1), pp. 205-222.
McAleer, M., Shareef, R. and Da Veiga, B. (2005): Risk Management of Daily Tourist Tax Revenues for the Maldives. Note di Lavoro 137-2005, Fondazione Eni Enrico Mattei. Miaou, S.-P. (1994): The relationship Between Truck Accidents and Geometric Design of
Road Sections. Poisson Versus Negative Binomial Regressions. Accident Analysis &
Prevention, 26, pp. 471-482.
Mullahy, J. (1986): Specification and Testing of Some Modified Count Data Models. Journal
of Econometrics, 33, pp. 341-365.
Newbery, D. (1990): Pricing and Congestion: Economic Principles Relevant to Pricing Roads.
Oxford Review of Economic Policy, 6 (2), pp. 22-38.
Palmer-Tous, T., Riera-Font, A. and Rossello-Nadal, J. (2007): Taxing Tourism: the Case of Rental Cars in Malorca. Tourism Management, Vol. 28(1), pp. 271-279.
Seetanah, B. (2010): Assessing the Dynamic Economic Impact of Tourism for Island Economies. Annals of Tourism Research. In Press, available online, November 5, 2010.
Shareef, R. (2003): Small Island Tourism Economies: A Bird's Eye View, in D. Post (ed.), Proceedings of the International Conference on Modeling and Simulation: Socio-economic Systems, Townsville, Australia, 3, 1124-1129.
Shareef. R., McAleer. M. (2005): Modeling International Tourism Demand and Volatility in Small Island Tourism Economies. International Journal of Tourism Research, 7, 313-333.
Smith, V. K. (1988): Selection and Recreation Demand. American Journal of Agricultural
Economics, 70, 29-36.
Welsh, A., Cunningham, R., Donnelly, C. and Lindenmayer, D. (1996): Modeling the Abundance of Rare Species - Statistical-Models for Counts with Extra Zeros.
Ecological Modelling, 88, 297-308.
World Travel and Tourism Council (2010): Economic Impact Data and Forecast: World-Key Facts at a Glance, available at http://www.wttc.org.