Bottom-Up Accountability and Public Service Provision:
Evidence from a Field Experiment in Brazil
∗
Danilo Freire
†Manoel Galdino
‡Umberto Mignozzetti
§4 September 2019
Abstract
Does grassroots participation improve public service delivery? We study the effect of a mobile phone application that allows citizens to monitor school construction projects in Brazilian municipalities. The app provides a platform where users can submit photos of construction sites, consult independent engineers, and contact the mayor’s office about project delays. Our results show that the app has a null impact on the school construction outcomes. Additionally, we find that politicians are unresponsive to individual requests. The results question the impact of local monitoring on public service performance and suggest that interventions targeted at other groups may produce better policy outcomes.
Keywords: accountability, Brazil, impact evaluation, state capacity, technology
∗We thank Fábio Barros, Guilherme Jardim Duarte, Stephen Herzog, and David Skarbek for their helpful comments.
We are specially grateful to Catarina Roman and the staff of Transparência Brasil for their excellent research assistance. This research was pre-registered on the EGAP pre-registry tool (https://egap.org/registration/4505) and approved by the Brazilian Ministry of Education. The authors thank the 2016 Google Social Impact Challenge for financial support and declare that there are no conflict of interest. Replication data and code are available athttp://github.com/ umbertomignozzetti/tdp-accountability.
†Postdoctoral Research Associate, The Political Theory Project, Brown University, Providence, RI 02912, USA, danilofreire@brown.edu,http://danilofreire.github.io, +1 (401) 584-2494. Corresponding author.
‡Executive Diretor, Transparência Brasil, São Paulo, SP, Brazil,mgaldino@transparencia.org.br, https://www. transparencia.org.br.
§School of International Relations, Fundação Getulio Vargas, São Paulo, SP, Brazil and Wilf Family Department of
1
Introduction
A robust accountability system is crucial for efficient public services provision (Besley and Ghatak
2003; Cameron2004; Ferejohn1986; O’Donnell1998). In its standard definition, accountability is
understood as the process of holding authorities responsible for their actions (Finer1941; Mulgan2000;
O’Loughlin1990). Past studies show that accountability has a positive impact on governance, as it
ensures that politicians act on behalf of voters (Freire2010; Moncrieffe1998), reduces the opportunities
for rent-seeking and corruption (Deininger and Mpuga2005; Wenar2006), and improves the quality
of public services (Adsera et al.2003; Björkman and Svensson2009). Recent research also suggests
that accountability leads to higher economic growth because it limits state discretion in the economy
and increases long-term investments in human capital (Benhabib and Przeworski2010; Suebvises
2018; Ponzetto and Troiano2018).
However, accountability systems take many forms. One promising model is that of bottom-up monitoring, in which citizens receive information about the shortcomings of a given project so
they can evaluate and pressure underperforming public officials (Kosack and Fung 2014; Molina
et al.2016; Raffler et al.2018). Proponents argue that bottom-up accountability is effective because:
1) constituents have first-hand information about the outcomes of local policies; 2) citizens have incentives to attack corruption that directly affects themselves; 3) policy-makers are sensitive to social
punishment from their own communities (Serra2011, 570). In this regard, bottom-up accountability
offers a potential solution to the principal-agent dilemma in public service by aligning the interests
of state officials with those of the constituency they serve (Barro1973; Raffler et al.2018, 2).
Here we assess the impact of Tá de Pé (TDP), a mobile phone application designed to lower the costs of evaluating public works and punish political representatives in Brazil. Developed by
Transparência Brasil1, TDP allows citizens to learn the location of public school construction sites,
check their completion status, and anonymously request information from competent authorities. TDP users can also take pictures of the construction sites and submit them to independent engineers for examination. If the engineers classify the construction as delayed, TDP prompts users to send a message to the mayor’s office asking for completion estimates and explanations about the construction 1Transparência Brasil is an non-governmental organisation whose mission is to ‘promote transparency and social
control of public power’. It has been active since April 2000, receives no public funding, and is non-partisan. More information athttp://transparencia.org.br(access: July 2019).
status. TDP has been online since April 2017 and was the winner of the 2016 Google Social Impact
grant with more than 200,000 popular votes2.
We use the TDP app to conduct two experimental interventions and test its impact on five outcomes related to school completion rates and complaints to public authorities. Overall, our results show that providing information to citizens has no consistent impact on policy outcomes. In the first experiment, we find that the TDP app increased the likelihood of construction cancellation by 2 percent, but the result does not replicate. The remaining five models have null results. In our second intervention, none of the estimations reach conventional levels of statistical significance. Importantly, all coefficients are small, what suggests that even if the TDP app had a significant effect on the outcomes, its substantive impact would be virtually negligible.
The findings raise questions about the ability of citizens to hold representatives accountable
using bottom-up strategies. Although studies like Björkman and Svensson (2009), Fiala and Premand
(2017), and Reinikka and Svensson (2005) report better policy outcomes after providing information
to local communities, our findings are closer to Banerjee et al. (2010), Keefer and Khemani (2014),
Lieberman et al. (2014), Bjökman Nyqvist et al. (2017), Olken (2007), and Raffler et al. (2018) offering
little evidence that information-based interventions lead to greater government responsiveness. Our analysis suggests that grassroots monitoring is ineffective in altering government behaviour in Brazil.
2
The Tá de Pé Project
The Tá de Pé3(TDP) cell phone application is an initiative carried out by Transparência Brasil to
foster bottom-up accountability in the Brazilian public sector. More specifically, the main goal of the TDP project is to improve responsiveness in government education expenditures. The TDP app incentivises citizens to provide up-to-date information about unfinished school constructions in their neighbourhoods, and that information will be assessed by a group of independent specialists. In the case the construction is behind schedule, TDP provides a writing platform whereby citizens can report to public officials quickly and anonymously. The app then prompts citizens to write a notification to the mayor’s office, which has 15 days to reply. If they do not respond to the request, 2About 1,000 Brazilian charities participated in the 2016 Google Social Impact Challenge. An independent committee
selected 10 organisations as finalists, and Transparência Brasil won the challenge with about 200,000 popular votes. To know more about the contest, please visithttps://impactchallenge.withgoogle.com/brazil2016(access: July 2019).
the app forwards the notification to the Brazilian Ministry of Education, making it harder for the municipality to access federal funds in the future. The motivation behind this intervention is that providing information to citizens empowers individuals to closely monitor public works. This, in turn, results in better social outcomes as public agents become more responsive to community demands. Transparência Brazil built the app in from January to March 2017 and tested it in May of that year. The first stable Android version was deployed on Google Play on 14 August 2017. A version for iOS came about six months later. In October 2017, Transparência Brazil started a Facebook campaign in order to publicise the app. Facebook is the most widely used social media network in Brazil with
around 72 million users (Statista2018). The campaigns attracted 2,028 new users to the platform in
October 2017 only.
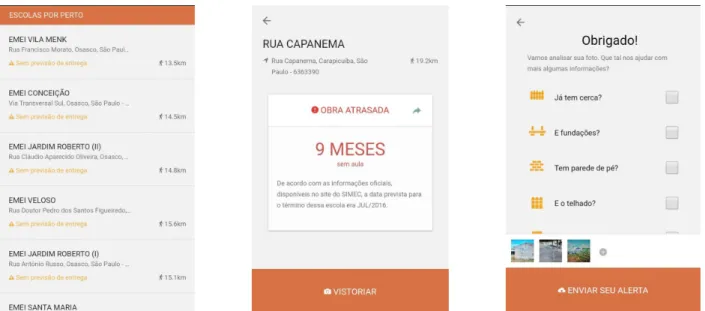
Figure 1: The Tá de Pé mobile phone application. The first image presents a list of school construction sites close to the users’ location. The second image shows that the school construction selected by the user is delayed by 9 months. The last image shows how citizens can add information to the photos they submit via the app.
Transparência Brasil partnered with the Brazilian branch of Engineers without Borders (EWB), an
independent non-governmental organisation4, to provide technical assessment of school completion
rates based on user-submitted photos and GPS coordinates. The engineers’ reports are later uploaded to the TDP database and stored on the users’ mobile devices so citizens can follow the progress of the reported constructions.
4Please visithttp://www.ewb-international.orgto know more about Engineers without Borders International and https://esf.org.brfor information on the Brazilian office.
The TDP also received feedback from Brazilian computer scientists and policy analists. In 2017 and 2018, Transparência Brasil announced two team programming competitions, called ‘Tá de Pé Hackathons’, where contributors could fix code bugs and suggest new functionalities to the TDP
project. One of these innovations consists of a Twitter bot (https://twitter.com/tadepeapp) which
posts a message on the social network each time a user submits a new picture for evaluation or a municipality responds to a citizen’s request. This allows any interested parties, including those who do not use the TDP app, to check the state of school construction sites.
3
Experimental Design
Between August 2017 and February 2019, we implemented two interventions to measure the effect of the TDP app on five school construction outcomes plus a placebo test. The outcomes are: 1) a placebo outcome indicating the percentage of the project completed before the impact evaluation started; 2) the percentage of the project completed by the end of the interventions; 3) the difference between the percentage reported as completed before and after the interventions; 4) the number of finished constructions; 5) the number of cancelled constructions; 6) the number of schools where
construction companies updated the conclusion dates. In terms of expectations, Table1depicts the
expected effects for each of the studied outcomes.
The first intervention was carried out from August 2017 to February 2018 using the Android version of TDP. The randomization was conduct at the municipal level. We randomly selected 344 municipalities to the control group and included 2642 in the treatment group. Our control condition consists in removing all information about school construction from the TDP app in the chosen municipalities, so that citizens were unable to report constructions in the control municipalities.
To evaluate the random assignment, we used the following pre-treatment variables: 1) log of municipal population in 2015; 2) log of number of poor families in each city; 3) log of total federal transfers to the municipality in 2016; 4) federal government indicator for primary school quality; 5) federal government indicator for secondary school quality. The data come from the Brazilian Ministry of Education and the Census. Balance tests show that the randomisation was successful and are available in the Supplementary Materials.
Table 1: Outcomes and expected effect of the TDP intervention
Expected
impact Meaning
Placebo:
Percentage of the project completed before the impact evaluation started.
Null
The placebo outcome, as reported before the intervention, should have a null impact. This represents the absence of differences between treatment and control prior to the intervention.
Outcome 1:
Percentage of the project reported as completed by the end of the intervention period.
Positive
If the intervention has a positive effect, the firms should increase their efforts toward finishing the construction more quickly.
Outcome 2:
Difference between the percentage reported as completed before and after the intervention.
Positive
If the intervention has a positive impact, the difference between before and after the intervention should reflect this.
Outcome 3:
Dummy indicator for finished constructions. Positive
If the intervention has a positive effect, more schools should be reported as finished in the treatment group. Outcome 4:
Dummy indicator for cancelled construction. Negative
If the intervention has a positive impact, less constructions should be abandoned and reported as finished in the treatment group.
Outcome 5:
Number of schools where construction companies updated the conclusion dates.
Positive
If the intervention has a positive effect, firms and mayor’s offices should be responsive to the public, and update their finishing dates.
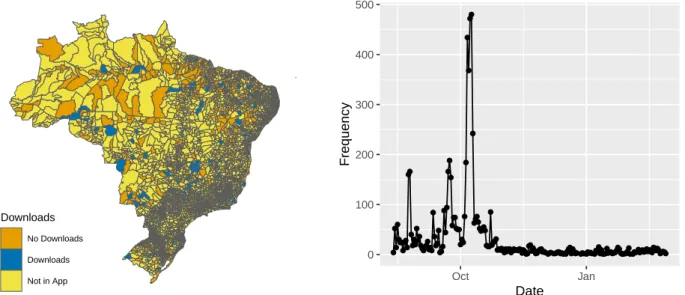
municipality and over time. Figure2displays the results and indicates that the treatment has good
territorial variability. There are 455 downloads in the 1023 municipalities in the treatment condition. Downloads peak during the Facebook TDP campaign, launched in October 2017, then diminish in the following months.
Downloads No Downloads Downloads Not in App 0 100 200 300 400 500 Oct Jan Date Frequency
Figure 2: Manipulation checks for intervention 1. The first plot shows the geographical distribution of the treatment condition and the second graph displays the number of TDP app downloads from August 2017 to February 2018.
The second intervention is similar to intervention 1 in all but three characteristics. First, the TDP app was available for both Android and iOS devices. Second, we randomised the intervention at the school level, with 659 control and 3717 treatment units. We used blocked randomisation stratified by Brazilian states, school construction status (under construction, stopped, unfinished), and whether the municipality spent more on school construction that the distribution median. Finally, the intervention period lasted from August 2018 to February 2019.
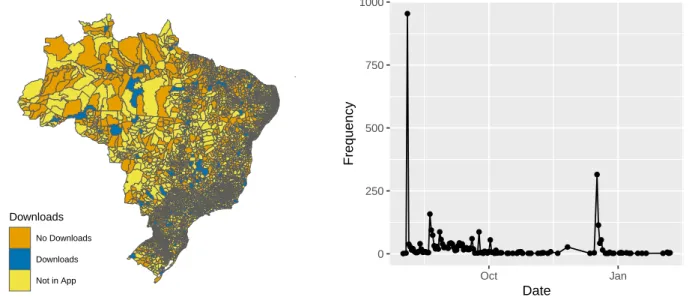
Balance tests and manipulation checks were also successful for intervention 2. In total, 443 municipalities downloaded the app. There is about 1,000 user downloads in August 2018, right after intervention 2 starts, and a second spike around December. The number of downloads is smaller in this second intervention as there was no associated social media campaign in that period.
Downloads No Downloads Downloads Not in App 0 250 500 750 1000 Oct Jan Date Frequency
Figure 3: Manipulation checks for intervention 2. The graphs display the geographical and temporal variation of TDP app downloads from August 2018 to February 2019.
We estimate all models using the following regression equation:
Yi = α + βTi+ γXi+ θZi+ εi (1)
wherei indexes the experiment units. Yi is one of the six outcomes described above,α is the
intercept,β denotes the average treatment effect, and Ti is a binary treatment indicator.γ is a vector
of fixed effects,Xi is a matrix of Brazilian states’ fixed effects,θ is a vector of controls and Zi an
array of controls for the casei. The error term is denoted by εi. We cluster the standard errors at the
4
Results
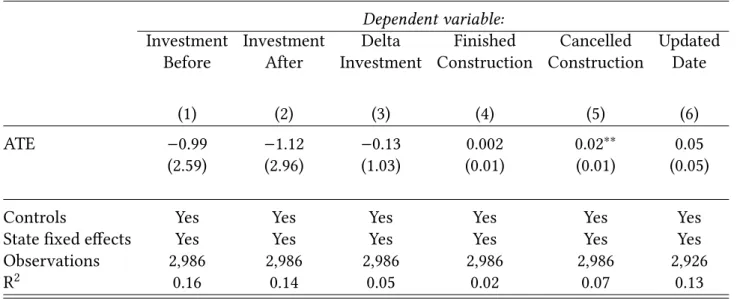
Table2summarises the main results of intervention 1. Each column represents the treatment effect
of the TDP app on one of the outcomes we measured for this study. All models reported here include the five control variables described in the previous section and Brazilian states’ fixed effects. We also estimated the models without control variables, without fixed effects, and with nearest-neighbour matching. The results are very similar to those below.
Table 2: Impact Evaluation – Intervention 1
Dependent variable:
Investment Investment Delta Finished Cancelled Updated
Before After Investment Construction Construction Date
(1) (2) (3) (4) (5) (6)
ATE −0.99 −1.12 −0.13 0.002 0.02∗∗ 0.05
(2.59) (2.96) (1.03) (0.01) (0.01) (0.05)
Controls Yes Yes Yes Yes Yes Yes
State fixed effects Yes Yes Yes Yes Yes Yes
Observations 2,986 2,986 2,986 2,986 2,986 2,926
R2 0.16 0.14 0.05 0.02 0.07 0.13
Note: ∗p<0.1;∗∗p<0.05;∗∗∗p<0.01
Cluster-robust SEs at the municipality level.
We find that the app only has a small effect on cancellation rates. The TDP application increases the likelihood of cancelling the construction in 2.07 percent. While this result goes in the opposite direction of our theoretical expectations, the finding is largely inconsistent, and it does not replicate in the second experiment. All other coefficients are not statistically significant at conventional levels. On the one hand, the results indicate that our placebo outcome, the percentage of the invested executed before the intervention, indeed behaves as predicted. On the other hand, we expected the five remaining outcomes to improve after the introduction of the app. The literature on bottom-up accountability argues that more information about the shortcomings of public service provision will mobilise citizens who, in turn, would pressure state agents to produce better social policies. Our results do not lend support to that hypothesis.
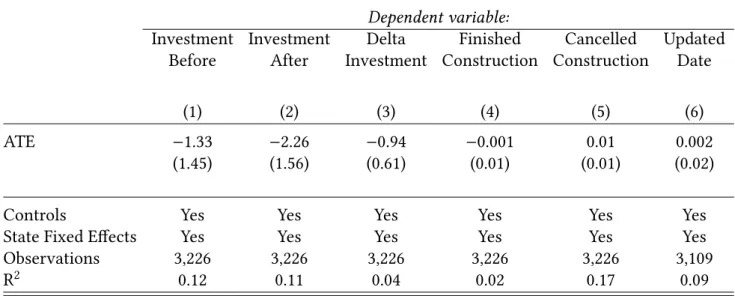
significant effect on any our outcomes of interest, including the placebo. This raises further questions about the effect of the TDP app on school completion. Note that the effect signs are also inconsistent with improving the outcomes, what demonstrates that our results do not derive from low statistical power or the reduced control group size.
Table 3: Impact Evaluation – Intervention 2
Dependent variable:
Investment Investment Delta Finished Cancelled Updated
Before After Investment Construction Construction Date
(1) (2) (3) (4) (5) (6)
ATE −1.33 −2.26 −0.94 −0.001 0.01 0.002
(1.45) (1.56) (0.61) (0.01) (0.01) (0.02)
Controls Yes Yes Yes Yes Yes Yes
State Fixed Effects Yes Yes Yes Yes Yes Yes
Observations 3,226 3,226 3,226 3,226 3,226 3,109
R2 0.12 0.11 0.04 0.02 0.17 0.09
Note: ∗p<0.1;∗∗p<0.05;∗∗∗p<0.01
Cluster-robust SEs at the municipality level. IPW computed by the randomizr package.
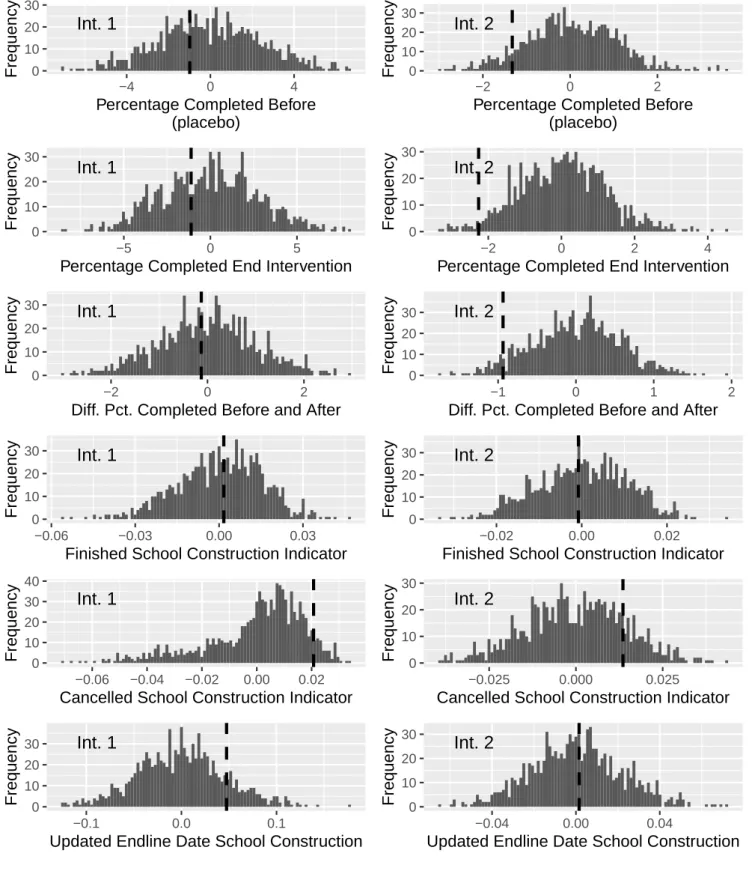
Figure4shows the results of our randomisation inference tests. Randomisation inference allows
us to estimate the probability of the sharp null hypothesis over all possible randomisations that could
have occurred under our research design (Coppock2019; Gerber and Green2012). We fail to reject
0 10 20 30
−4 0 4
Percentage Completed Before (placebo) Frequency Int. 1 0 10 20 30 −2 0 2
Percentage Completed Before (placebo) Frequency Int. 2 0 10 20 30 −5 0 5
Percentage Completed End Intervention
Frequency Int. 1 0 10 20 30 −2 0 2 4
Percentage Completed End Intervention
Frequency Int. 2 0 10 20 30 −2 0 2
Diff. Pct. Completed Before and After
Frequency Int. 1 0 10 20 30 −1 0 1 2
Diff. Pct. Completed Before and After
Frequency Int. 2 0 10 20 30 −0.06 −0.03 0.00 0.03
Finished School Construction Indicator
Frequency Int. 1 0 10 20 30 −0.02 0.00 0.02
Finished School Construction Indicator
Frequency Int. 2 0 10 20 30 40 −0.06 −0.04 −0.02 0.00 0.02
Cancelled School Construction Indicator
Frequency Int. 1 0 10 20 30 −0.025 0.000 0.025
Cancelled School Construction Indicator
Frequency Int. 2 0 10 20 30 −0.1 0.0 0.1
Updated Endline Date School Construction
Frequency Int. 1 0 10 20 30 −0.04 0.00 0.04
Updated Endline Date School Construction
Frequency
Int. 2
Figure 4: Sampling distribution of the estimated coefficient for our six outcomes in two interventions. Graphs on the left correspond to randomisation inference estimates for intervention 1 and those on the right describe the results for intervention 2.
We also note that effect sizes are small in all estimations and that the coefficients flip signs in all but one of our six dependent variables. This provides further evidence for the null results: not only the app would have a low impact even if the treatment were significant, but the results could
go against what the bottom-up accountability theory predicts. At least in the school construction outcomes we investigate here, we find little evidence that grassroots monitoring works in the context of school constructions in Brazil.
5
Discussion
In this paper, we discuss whether a mobile phone application can foster grassroots mobilisation and political accountability in Brazil. Our two interventions show that the results are at best mixed. Although we find an effect on school construction completion and cancelling rates in the first intervention, the app has no consistent impact on our outcomes of interest. These findings add to the studies that cast doubts on the relationship between bottom-up accountability and local policy
performance (e.g., Banerjee et al.2010; Lieberman et al.2014; Raffler et al.2018).
What factors, then, are driving these results? It seems unlikely that the null results derive from flaws in the research design. First, our study is well powered. Although the treatment is indirect, meaning that the person has to download the app, find a school construction, and then report it, we included a substantial number of schools in the treatment groups. Second, balance and manipulation tests indicate that the treatment allocation was successful, so we can rule out problems in the randomisation procedures. Third, after doing a series of robustness tests, we still find no firm evidence of treatment effect. Finally, note that the sign of the coefficients are frequently contrary to our theoretical expectations. This rules out a possible concern about statistical power with our small control group approach.
A plausible explanation is that individuals were unable to differentiate the effect of political corruption from those of spending cuts. Due to the severe economic crisis in 2014–2016, the Brazilian federal government introduced discretionary spending limits that affected public investment (Mello
and Spektor2016; Rossi and Dweck2016). Politicians may argue that delays in school constructions
are not derived from their misuse of government funds, but from the austerity measures. If this is the case, citizens will not blame local politicians for the underprovision of public goods. Consequently, representatives can dismiss individual requests as the issue is unlikely to escalate.
Moreover, it is possible that a mobile app like TDP is simply not sufficient to promote collective
to higher pressure on public agents, such as citizens’ apathy towards their ability to make public agents accountable, lack of official channels to support popular demands, or that constituents have more pressing needs than monitoring representatives. Furthermore, individuals may also believe they are better off by free-riding on other users of the TDP app, thus reaping the benefits of having
faster school constructions without incurring personal costs (Olson1965).
In sum, our experiments suggest that popular participation and bottom-up monitoring may not be effective to improve public service delivery in the case of school constructions in Brazil. Nevertheless, the null findings are informative to researchers and policy-makers. The most important recommendation derived from this study is that interventions targeting elite groups, such as lobbyists or civil servants, might render better policy outcomes than those focused at the grassroots levels. Another core lesson is that although digital interventions are promising means to deliver information, perhaps they do not have the same impact as personal, face-to-face communication. Since many developing countries share Brazil’s issues with education provision, the shortcomings we describe here serve as warnings for future interventions. Finally, whether this study generalises beyond school constructions to other bottom-up programs, and to other contexts, remains to be studied.
References
Adsera, A., Boix, C., and Payne, M. (2003). Are You Being Served? Political Accountability and Quality of Government. The Journal of Law, Economics, and Organization, 19(2):445–490.
Banerjee, A. V., Banerji, R., Duflo, E., Glennerster, R., and Khemani, S. (2010). Pitfalls of Participatory Programs: Evidence from a Randomized Evaluation in Education in India. American Economic Journal: Economic Policy, 2(1):1–30.
Barro, R. J. (1973). The Control of Politicians: An Economic Model. Public Choice, 14(1):19–42. Benhabib, J. and Przeworski, A. (2010). Economic Growth under Political Accountability. International
Journal of Economic Theory, 6(1):77–95.
Besley, T. and Ghatak, M. (2003). Incentives, Choice, and Accountability in the Provision of Public Services. Oxford Review of Economic Policy, 19(2):235–249.
Bjökman Nyqvist, M., de Walque, D., and Svensson, J. (2017). Experimental Evidence on the Long-Run Impact of Community-Based Monitoring. American Economic Journal: Applied Economics, 9(1):33–69.
Björkman, M. and Svensson, J. (2009). Power to the People: Evidence from a Randomized Field Experiment of a Community-Based Monitoring Project in Uganda. Quarterly Journal of Economics, 124(2):735–769.
Cameron, W. (2004). Public Accountability: Effectiveness, Equity, Ethics. Australian Journal of Public Administration, 63(4):59–67.
Coppock, A. (2019). ri2: Randomization Inference for Randomized Experiments. https://CRAN.
R-project.org/package=ri2. R package version 0.1.2.
Deininger, K. and Mpuga, P. (2005). Does Greater Accountability Improve the Quality of Public Service Delivery? Evidence from Uganda. World Development, 33(1):171–191.
Ferejohn, J. (1986). Incumbent Performance and Electoral Control. Public Choice, 50(1):5–25. Fiala, N. and Premand, P. (2017). Social Accountability and Service Delivery: Evidence from
a Large-Scale Experiment in Uganda. https://sites.tufts.edu/neudc2017/files/2017/10/
Social-accountability-and-service-delivery.pdf.
Finer, H. (1941). Administrative Responsibility in Democratic Government. Public Administration Review, 1(4):335–350.
Freire, D. (2010). Nova Gestão Pública e Democracia no Brasil. In Erkens, R., editor, Nova Gestão Pública, chapter 1, pages 9–16. Friedrich Naumann Stiftung.
Gerber, A. S. and Green, D. P. (2012). Field Experiments: Design, Analysis, and Interpretation. New York City, NY: WW Norton.
Keefer, P. and Khemani, S. (2014). Mass Media and Public Education: The Effects of Access to Community Radio in Benin. Journal of Development Economics, 109:57–72.
Kosack, S. and Fung, A. (2014). Does Transparency Improve Governance? Annual Review of Political Science, 17:65–87.
Lieberman, E. S., Posner, D. N., and Tsai, L. L. (2014). Does Information Lead to More Active Citizenship? Evidence from an Education Intervention in Rural Kenya. World Development, 60:69–83.
Mello, E. and Spektor, M. (2016). How to Fix Brazil: Breaking Addiction to Bad Government. Foreign Affairs, 95:102–110.
Molina, E., Carella, L., Pacheco, A., Cruces, G., and Gasparini, L. (2016). Community Monitoring Interventions to Curb Corruption and Increase Access and Quality of Service Delivery in Low-and Middle-Income Countries: A Systematic Review. Campbell Systematic Reviews, 12.
Moncrieffe, J. M. (1998). Reconceptualizing Political Accountability. International Political Science Review, 19(4):387–406.
Mulgan, R. (2000). ‘Accountability’: An Ever-Expanding Concept? Public Administration, 78(3):555– 573.
O’Donnell, G. A. (1998). Horizontal Accountability in New Democracies. Journal of Democracy, 9(3):112–126.
Olken, B. A. (2007). Monitoring Corruption: Evidence from a Field Experiment in Indonesia. Journal of Political Economy, 115(2):200–249.
O’Loughlin, M. G. (1990). What is Bureaucratic Accountability and How Can We Measure It? Administration & Society, 22(3):275–302.
Olson, M. (1965). The Logic of Collective Action. Cambridge, MA: Harvard University Press.
Ponzetto, G. A. and Troiano, U. (2018). Social Capital, Government Expenditures and Growth. Technical report, National Bureau of Economic Research.
Raffler, P., Posner, D. N., and Parkerson, D. (2018). The Weakness of Bottom-Up Accountability:
Experimental Evidence from the Ugandan Health Sector. https://bit.ly/2LPL6Nm.
Reinikka, R. and Svensson, J. (2005). Fighting Corruption to Improve Schooling: Evidence from a Newspaper Campaign in Uganda. Journal of the European Economic Association, 3(2-3):259–267.
Rossi, P. and Dweck, E. (2016). Impactos do Novo Regime Fiscal na Saúde e Educação. Cadernos de Saúde Pública, 32:1–5.
Serra, D. (2011). Combining Top-Down and Bottom-Up Accountability: Evidence from a Bribery Experiment. The Journal of Law, Economics, & Organization, 28(3):569–587.
Statista (2018). Number of Facebook Users in Brazil from 2017 to 2023 (in Millions). https://www.
statista.com/statistics/244936/number-of-facebook-users-in-brazil/.
Suebvises, P. (2018). Social Capital, Citizen Participation in Public Administration, and Public Sector Performance in Thailand. World Development, 109:236–248.
Wenar, L. (2006). Accountability in International Development Aid. Ethics & International Affairs, 20(1):1–23.