Scaling up management of social-ecological systems: a case study on community-based marine protected areas in the Philippines
128
0
0
Texto
(2) NOME / NAME: Jeneen Reyes Garcia DEPARTAMENTO / DEPARTMENT: Química, Bioquímica e Farmácia Faculdade de Ciências e Tecnologia da Universidade do Algarve ORIENTADOR / SUPERVISOR: Dr. Laurence Mee, Scottish Association of Marine Science and Dr. Alice Newton, Faculdade de Ciências e Tecnologia da Universidade do Algarve DATA / DATE: 12 April 2010 TÍTULO DA TESE / TITLE OF THESIS: Scaling up management of socialecological systems: A case study on community-based marine protected areas in the Philippines JURI: Dr. Tomasz Boski, Faculdade de Ciências do Mar e do Ambiente, Universidade do Algarve Dr. Juergen Weichselgartner, Land-Ocean Interactions in the Coastal Zone, GKSS Institut für Küstenforschung Dr. Eva Annette Roth, Department of Environmental and Business Economics, University of Southern Denmark Dr. Alice Newton, Faculdade de Ciências e Tecnologia, Universidade do Algarve. ii.
(3) Acknowledgements Heartfelt gratitude is due to all who have helped made this leap of faith possible within four months: the key informants, Mr. William Ablong, Hon. Rodrigo Alanano, Dr. Angel Alcala, Dr. Hilconida Calumpong, Hon. Amado Diaz Jr., Dr. Mundita Lim, Mr. Mario Pascobello, Mr. Diosdado Suan, Mrs. Mercy Teves and Dr. Alan White for generously sharing their time and experience; CRM Officer Rosabelle Sanchez, Police Environmental Desk Officer Richard Elma and the PNP of the Municipality of Dauin; Manric and Anabelle Barillo, and Joaquin dela Peña of the ENRD, and Provincial Fisheries Officer Dr. Leonardo Aro of Negros Oriental; AIPLS PASu Viernov Grefalde and staff; the staff of SUAKCREM, SU Salonga Center and SU IEMS; and Dr. Porfirio Aliño and Hazel Arceo of ECOGOV 2, Evangeline Miclat of Conservation InternationalPhilippines, Elline Cañares of CCEF, Dr. Enrique Oracion of the SU Sociology Department and Mar Guidote of CRMP for invaluable information and assistance; Inocencia Catadman and the Catadman Compound residents in Dumaguete, and RV Escatron and the Kalikasan Center staff in Valencia for accommodations; the LOICZ project, Dr. Juergen Weichselgartner and the staff at the International Project Office, GKSS Institute for Coastal Research, and GKSS Library in Germany; and Celia Oliveira and the Mobility Office staff at the University of Algarve in Portugal for logistical support and for being helpful in so many ways; Liz Herbert, Ester Auxiliadora and Yahoo!Bablefish for the kind assistance in translation; my supervisors Dr. Laurence Mee and Dr. Alice Newton, and my unofficial adviser Mr. Roy Olsen de Leon for their wisdom and guidance; my unofficial external readers Dr. Porfirio Aliño, Mr. Patrick Knight, and Dr. Alan White for their time and insightful comments; my ever-supportive family in Davao City and New York, my Skype consultants Jong Rojas, Rich Herbert and Jemi Aquino, all other family and friends who have offered assistance, encouragement and prayers on this last leg, and Skype, because the best things in life are free. Ad majorem Dei gloriam. iii.
(4) Resumo Sistemas ‗sociais-ecológicos‘ são desafiando de serem controlados, não apenas por seus muitos componentes de interação, mas também, porque funcionam em escalas de interações múltiplas, que são frequentemente ignoradas. Este estudo, procurou responder a pergunta de quais elementos são necessários na escamação acima da gerência de sistemas sociais-ecológicos. Uma aproximação do estudo de caso foi usada, examinando a escamação-acima da gerência marinha community-based da área protegida (MPA) nas Filipinas, do console às escalas municipais, provinciais e do nacional. Derivando a informação das entrevistas chaves do informador e da literatura disponível, os processos do estabelecimento, as estruturas de gerência, e as funções do MPA de cada escala foram comparadas. Um sistema de avaliação foi desenvolvido para medir a contribuição relativa de cada ator à gerência do MPA. As conclusões principais mostram que os três elementos cruciais à escamação acima da gerência são: 1) a estrutura legal e institucional existente, 2) a capacidade da gerência de unidades de gerência e 3) as características dos líderes destas unidades de gerência. A avaliação destes três elementos é crítica em determinar as necessidades e o potencial do capacitybuilding para a escamação-acima dos sistemas de gestão existentes. As recomendações essenciais, incluem a concessão de mandatos legais aos gerentes de fato e às partes interessadas que possuam recursos existentes para atuar como enlaces, e às capacidades do edifício de líderes e de unidades de gerência baseadas em suas forças escalaresrelacionadas. Uma estrutura geral é proposta para a escamação-acima da administração de sistemas ecológicos-sociais. Palavras-chaves: sistemas sociais-ecológicos, escala, áreas protegidas marinhas, Filipinas, console do Apo. iv.
(5) Abstract Social-ecological systems are challenging to manage not only because of their many interacting components, but also because they function at multiple interacting scales, many of which are often ignored. This study sought to answer the question of what elements are necessary in scaling up the management of social-ecological systems. A case study approach was used by examining the scaling-up of community-based marine protected area (MPA) management in the Philippines from island to municipal, provincial and national scales. Deriving information from key informant interviews and available literature, MPA establishment processes, management structures, and functions ateach scale were compared. A rating system was developed to measure the relative contribution of each actor to MPA management. Key findings show that the three crucial elements to scaling up management are 1) the existing legal and institutional framework, 2) management capacities of management units, and 3) characteristics of leaders of these management units. The assessment of these three elements is critical in determining the capacity-building needs and potential for scalingup of existing management systems. Key recommendations include granting legal mandates to de facto managers and to stakeholders that possess existing resources to act as cross-scale linkages, and building capacities of leaders and management units based on their scale-related strengths. A general framework is proposed for the scaling-up of social-ecological system management. Keywords: social-ecological systems, scale, marine protected areas, Philippines, Apo Island. v.
(6) TABLE OF CONTENTS Acknowledgements ....................................................................................................... iii Resumo ......................................................................................................................... iv Abstract ..........................................................................................................................v 1.. INTRODUCTION ................................................................................................... 1 1.1. Background ............................................................................................................ 1 1.2. Objectives ............................................................................................................... 2. 2.. REVIEW OF LITERATURE ................................................................................ 3. 3.. METHODOLOGY .................................................................................................. 8 3.1. Case Study .............................................................................................................. 8 3.2. Comparison of Actor Contributions ....................................................................... 8. 4.. CASE STUDY ........................................................................................................ 13 4.0.1 Institutional framework .................................................................................. 14 4.0.2 Legal framework ............................................................................................ 17 4.1. Island .................................................................................................................... 19 4.1.1. History of establishment ................................................................................ 20 4.1.2. Management structure ................................................................................... 22 4.1.3. Objectives and motivations ........................................................................... 23 4.1.4. Strategies and methods .................................................................................. 24 4.1.5. Benefits .......................................................................................................... 26 4.1.6. Learning and diffusion .................................................................................. 26 4.2. Municipal ............................................................................................................. 27 4.2.1. History of establishment ................................................................................ 28 4.2.2. Management structure ................................................................................... 30 4.2.3. Objectives and motivation ............................................................................. 33 4.2.4. Strategies and methods .................................................................................. 34 4.2.5. Benefits .......................................................................................................... 35 4.2.6. Learning and diffusion .................................................................................. 36 4.3. Provincial ............................................................................................................. 37 4.3.1. History of establishment ................................................................................ 38 4.3.2. Management structure ................................................................................... 42 4.3.3. Objectives and motivation ............................................................................. 43 4.3.4. Strategies and methods .................................................................................. 44 vi.
(7) 4.3.5. Benefits .......................................................................................................... 46 4.3.6. Learning and diffusion .................................................................................. 46 4.4. National ................................................................................................................ 47 4.4.1. History of establishment ................................................................................ 49 4.4.2. Management structure ................................................................................... 50 4.4.3. Objectives and motivations ........................................................................... 53 4.4.4. Strategies and methods .................................................................................. 53 4.4.5. Benefits .......................................................................................................... 55 4.4.6. Learning and diffusion .................................................................................. 56 5.. RESULTS ............................................................................................................... 58 5.1. Establishment and Management .......................................................................... 58 5.2. Actors and Services .............................................................................................. 62 5.2.1. Island ............................................................................................................. 62 5.2.2. Municipal....................................................................................................... 63 5.2.3. Provincial....................................................................................................... 67 5.2.4. National ......................................................................................................... 67 5.2.5. Comparisons across scales ............................................................................ 68 5.3. Cross-scale Functions .......................................................................................... 72 5.3.1. Coordination of management units ............................................................... 72 5.3.2. Learning and diffusion .................................................................................. 75. 6.. DISCUSSION......................................................................................................... 80. 7.. CONCLUSION ...................................................................................................... 98. 8.. REFERENCES .................................................................................................... R-1. 9.. ANNEXES ............................................................................................................ A-1 9.1. List of Key Informants .........................................................................................A-1 9.2. General Interview Questions...............................................................................A-2 9.3. CCEF MPA Rating System..................................................................................A-4 9.4. Actor Ratings.......................................................................................................A-5 9.5. List of Acronyms..................................................................................................A-9 9.6. Glossary of Local Terms ...................................................................................A-11. vii.
(8) LIST OF FIGURES Figure 1. Location of the Philippines in Southeast Asia ..............................................................13 Figure 2. Distribution of local government share (40%) of national internal revenues .............17 Figure 3. Legal framework for MPA establishment and the primary management bodies .........19 Figure 4. Location of Apo Island and its MPA ............................................................................20 Figure 5. MPA management structure of Apo Island (1985-1994) .............................................23 Figure 6. Location of the Municipality of Dauin and its coastal barangays ...............................28 Figure 7. MPA management structure of the Municipality of Dauin ..........................................32 Figure 8. Income-sharing scheme for MPA user fees ..................................................................35 Figure 9. Location of the Province of Negros Oriental and its municipalities and cities in Region VII ....................................................................................................................................38 Figure 10. MPA management structure of the Province of Negros Oriental ..............................43 Figure 11. Location of national MPAs in their biogeographic zones (left) and of AIPLS management zones (right) ............................................................................................................48 Figure 12. AIPLS management structure (1994-present) ............................................................51 Figure 13. Comparison of service delivery of actors at island scale (1985-1994) ......................65 Figure 14. Comparison of service delivery of actors at municipal scale ....................................65 Figure 15. Comparison of service delivery of actors at provincial scale ....................................66 Figure 16. Comparison of service delivery of actors at national scale .......................................66 Figure 17. Comparison of total contribution of common actors across scales ...........................68 Figure 18. Comparison of distribution of services provided .......................................................72 Figure 19. Similarities of services delivered (MDS and cluster analyses) ..................................72 Figure 20. Cross-scale comparison of actors with coordinating functions .................................73 Figure 21. Cross-scale comparison of actors enabling social learning ......................................78 Figure 22. Framework for assessing the potential for scaling up management of socialecological systems ........................................................................................................................90 Figure 23. Functional relationships in scaling up management of social-ecological systems ....94. viii.
(9) LIST OF TABLES Table 1. Services contributing to MPA success and their descriptions .........................................9 Table 2. Rating system for actors delivering services contributing to MPA success ...................11 Table 3. Institutional framework of the Philippine government ..................................................16 Table 4. Comparison of social-ecological features of different scales ........................................58 Table 5. Comparison of management histories and roles at different scales .............................59 Table 6. Donor organisations and projects funded at each scale ................................................69 Table 7. Methods used for learning and diffusion across scales .................................................76 Table 8. Summary of lessons learned ...........................................................................................88 Table 9. Key elements in scaling up management of social-ecological systems ..........................89 Table 10. Summary of key recommendations for scaling up management of social-ecological systems .........................................................................................................................................95 Table 11. Key informants interviewed and their relevant roles ................................................. A-1 Table 12. MPA rating system ..................................................................................................... A-4. ix.
(10) 1. INTRODUCTION This thesis is submitted in partial fulfilment of the academic requirements of the Erasmus Mundus Master in Water and Coastal Management. The topic chosen is appropriate for this course because it examines how the management of coastal socialecological systems such as marine protected areas may be scaled up. Marine protected areas are recognised to be an important tool in coastal and marine resource management worldwide.. 1.1. Background Social-ecological systems are systems that arise from regular interactions between human societies and ecosystems (Liu et al., 2007, Anderies et al., 2004). They are complex adaptive systems, and as such are self-organising and have emergent properties (Finnigan, 2005). These interactions may therefore result in several different outcomes. Holling (2001) argues that what makes a social-ecological system complex is not just the interaction of its various human and environmental components, but also the interactions of its different scales. Because of its nested nature, the sustainability of a social-ecological system depends on its being managed at multiple scales. Marine protected areas (MPAs) are an example of a social-ecological system, where interventions implemented by a management body in the coastal zone produce feedback loops that have an impact on the well-being of users and other stakeholders as well. Prohibiting all forms of fishing, for example, may eventually lead to a spillover of fish biomass into non-MPA areas, resulting in increased fish catch; on the other hand, allowing excessive tourism may result in habitat degradation, which may affect incomes through reduced tourism..
(11) Being social-ecological systems, MPAs need to be managed at several scales, one reason being that many of the species targeted for protection are mobile and make use of different ecosystems at different phases in their life cycle. Sea turtles, for example, may be protected on one island, only to be captured for food when they lay their eggs on another island. For protection to be effective, MPA management needs to be scaled up. Different scales, however, have different properties; what management structures and approaches are effective at one scale may not function at another (Berkes, 2006). It is therefore of primary concern to determine which elements are necessary for successfully scaling up the management of a social-ecological system. Apo Island in the Philippines, the world‘s first successful community-based MPA, is an example of how the technology of community-managed, no-take MPAs to manage fisheries and conserve biodiversity has been adapted at higher scales of management in the Philippines and even in the region. This study draws lessons from the model of Apo Island and the networks of MPAs that have been formed at the municipal, provincial and national scales through its pioneering experience.. 1.2. Objectives This study aims to: 1) compare the characteristics of community-based MPA management systems in the Philippines at four different scales; 2) analyse the relative importance of actors contributing to MPA establishment, management and learning at each scale; 3) propose a general framework for scaling up the management of social-ecological systems based on the findings from the case study.. 2.
(12) 2. REVIEW OF LITERATURE In the last two decades, both research and policy have undergone a radical paradigm shift from viewing ecosystems as storehouses of resources that simply need to be maintained in equilibrium, to human life-support systems that may have several states of equilibrium, or regimes (Folke et al., 2007, Walker et al., 2004). There is now growing recognition that social systems and ecological systems are not merely linked but are inextricable components of a complex social-ecological system whose parts are constantly evolving and interacting (Galaz et al., 2006). Initiatives such as the Land-Ocean Interactions in the Coastal Zone (LOICZ) contribute to this awareness by supporting projects that combine social and ecological data, providing a holistic analysis of social-ecological systems. These projects demonstrate how changes in society such as policies, agricultural land use, per capita income, and lifestyles result in corresponding changes in nutrient budgets in river basins and seas (e.g. Langmead et al., 2009, Artioli et al., 2008, Borbor-Cordova et al., 2006, Seitzinger et al., 2005). At the same time, these projects reveal how environmental factors such as rising sea surface temperatures and basin circulation may result in non-linear feedbacks that modify anthropogenic inputs and management initiatives (McQuatters-Gollop et al., 2009, Artioli et al., 2008, McQuatters-Gollop et al., 2008). Projects such as these enable better understanding of properties that are inherent to complex adaptive systems. Holling (2001) further defines the complexity of systems as referring also to the interaction of nested social-ecological systems functioning at different scales, called a ―panarchy‖. Scale refers to both spatial and temporal dimensions, with sociological components having the additional dimensions of representation and organisation (Cumming et al., 2006, Westley et al., 2002). Garmestani et al. (2009) identify changes 3.
(13) in scale in relation to discontinuities in size classes as observed in the structure of both ecological and social systems; the existence of a particular size class therefore indicates the presence of new functions that match emergent scale-specific properties. Because social-ecological systems consist of nested scales, the dynamics at one scale may be influenced by pressures and drivers at higher or lower scales, and from other domains or systems (Folke et al., 2002, Berkes, 2006). The Coastal Futures project in Germany highlights how activities in one river basin, for example, may be driven by policies at both regional and national scales, each with its own management approach and priorities (Bruns and Gee, 2009, Glaeser et al., 2009). Another study by the SCOPE Biofuels project shows how the global trend of ethanol use for biofuel will lead to national-scale changes in agricultural land use in the United States, which in turn will greatly increase losses of nitrogen and phosphorus to local rivers and lakes (Simpson et al., 2008). Management of social-ecological systems therefore cannot be restricted to scales where the problem is most apparent. Of particular concern are catastrophic events, which often come as surprises that are generated through cross-scale interactions, where dominant processes at a particular point in time at one scale interact with those at another scale (Peters et al., 2004). Small changes at one scale may cause a cascade of effects and regime shifts crossing ecological to social and political domains (Kinzig et al., 2006). Among the challenges related to management at different scales is ignorance, or the lack of awareness that the phenomenon being observed is a product of cross-scale dynamics. Another is plurality, or the assumption that a single set of solutions will suffice to solve a problem at multiple scales (Cash et al., 2006). Cumming et al. (2006) attribute many of the current resource management problems to mismatches in scale, i.e. differences in. 4.
(14) both the spatial and temporal scales at which human organisations and ecosystems function. Societies often manage resources for particular objectives, such as singleresource extraction, therefore ignoring the larger-scale processes that support resource production. Folke et al. (2007) call this the ―problem of fit‖, noting that resources are not evenly distributed over space and time, with distribution patterns also changing over time. Social institutions that do not adapt to this variability may disrupt ecosystem structures and processes. This includes the misperception of the actual scale of the ecosystem, such as managing fisheries on a large scale when individual species spawn at a local scale (Wilson et al., 1999). Some options for realigning management scales are the restructuring of organisations to function at the appropriate social-ecological scale, or redefining human-imposed ecosystem boundaries (Cumming et al., 2006). Olsson et al. (2007) suggest that the fit between governance systems and ecosystems may be enhanced by the creation of the right links among different groups of actors across different scales, at the right time and around the right issues; bridging organisations with visionary leadership may fulfil this function. These cross-scale linkages enable adaptive management by bringing together groups with local but broad foci and those with trans-local but narrow mandates (Wilson et al., 2006). Examples of institutions embodying cross-scale linkages are multistakeholder bodies, capacity-building institutions, donor and other organisations that link local with regional concerns, research and management approaches that involve several scales, mechanisms for citizen science, boundary organisations between scientists and decision-makers within and across scales to effectively inform policy-making, and co-management networks, or collaborative arrangements between the State and the private sector (Carlsson and Berkes, 2005, Berkes, 2002, Cash and Moser, 2000). These cross-scale 5.
(15) linkages serve a coordinating function by enabling the exchange or pooling of knowledge and ideas, material and financial resources, and efforts within and across scales, across different types of stakeholders (Christie et al., 2009a). Cash et al. (2006) particularly point out the need for structures or arrangements that allow co-production of knowledge and translation between groups of different disciplines. The combination of local, traditional and scientific knowledge, for example, or of factual information and community perception, allows management systems to better adapt to uncertainty and change (Olsson et al., 2007, Pahl-Wostl, 2007, Olsson et al., 2004, Berkes and Folke, 2002). In Europe, the ENCORA Coordination Action project provides opportunities for scientists, managers and policymakers to collaborate on and standardise innovative scientific solutions to management problems (e.g. Ducrotoy, 2009, Kratzer and Tett, 2009, Derous et al., 2007). The CABRI (Cooperation Along a Big River) project demonstrates how the simple sharing of experiences by various stakeholders (e.g. from politics, business, academe, NGO) from different countries is a way for Russia to learn about appropriate management measures and build its capacity for water governance (Nikitina et al., 2009). Adger et al. (2005) put forward the view that cross-scale linkages are inherent to any resource management system, emerging naturally from the interplay of power among stakeholders, i.e. interactions are made depending on the costs and benefits to the stakeholder undertaking them. They caution that some cross-scale linkages may reinforce the uneven distribution of power when those who can afford to create these linkages do so only to benefit themselves; this results in mistrust and conflict rather than in improved communication and management.. 6.
(16) The scaling up of MPA management to match the scale of ecosystems has been the subject of empirical study in the last decade in the Philippines as well as worldwide. Some methods that have been explored for scaling up include the creation of intermunicipal and reef-wide management councils (Armada et al., 2009, Eisma-Osorio et al., 2009), multistakeholder national networks and channel-wide working groups (IUCN-WCPA, 2008), a national marine reserve system (WB, 2006), and a tri-national management committee covering a marine ecoregion (Miclat, 2008, Miclat et al., 2006). Best practices and guidelines on the social, governance and biophysical settings necessary for scaling up MPAs have also been published (e.g. Lowry et al., 2009, IUCN-WCPA, 2008, WB, 2006). Given the relatively advanced strides in the management of this particular social-ecological system, this study analyses which elements may be applied in the scaling-up of social-ecological systems in general.. 7.
(17) 3. METHODOLOGY 3.1. Case Study The case study examines MPA management at four scales: island, municipal, provincial and national. For each scale, information on the history of MPA establishment, management structure and strategies, and cross-scale learning and diffusion was gathered from published literature and semi-structured key informant interviews. Two key informants were interviewed for each scale of MPA management in November and December 2009. Informants were selected based on their roles in the establishment and management of MPAs at their respective scales, as evidenced in published literature as well as according to the legal and institutional framework (see Table 11 in Annex). The case study was then analysed to compare social-ecological features, establishment histories, key management roles and functions, and cross-scale learning and diffusion methods.. 3.2. Comparison of Actor Contributions Several studies have been made to quantitatively determine what factors are correlated with the success of MPAs, many of them done in Central Visayas in the Philippines. Measures of MPA success included both biological and sociological variables, such as increase in fish abundance and improved coral cover, and community compliance with MPA regulations and community empowerment (Christie et al., 2009b, Pietri et al., 2009, Crawford et al., 2006, McClanahan et al., 2006, Walmsley and White, 2003, Pollnac et al., 2001, Pomeroy et al., 1997). Factors tested for correlation with MPA success included social, political, economic and geographic variables as well as projectrelated variables, such as strategies and post-implementation activities. These factors. 8.
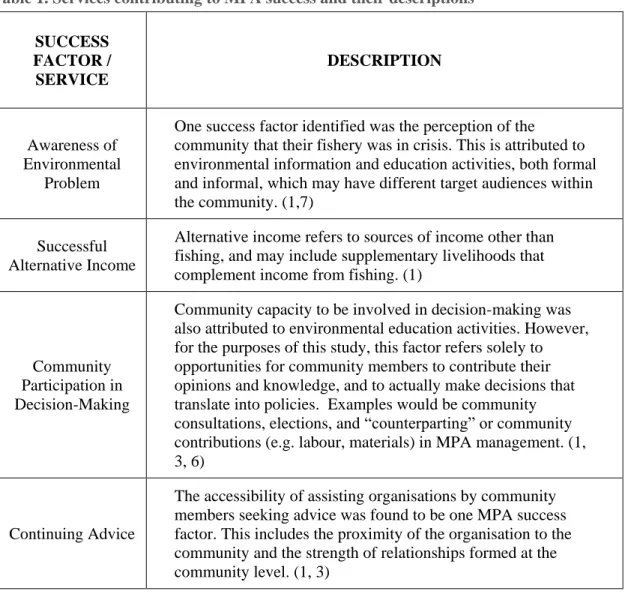
(18) were culled from papers published on several long-term case studies and focus group discussions (e.g. Lowry et al., 2009, White et al., 2005, Christie et al., 2002, Crawford et al., 2000, White, 1986). Success factors identified by these studies were selected as criteria for measuring the contribution of each actor to the establishment and management of MPAs at each scale. Only relevant factors, which depend on the delivery of services by assisting organisations or management bodies, were used. Table 1 shows the relevant success factors and their descriptions. The last two factors pertain particularly to the success of MPA networks. Table 1. Services contributing to MPA success and their descriptions SUCCESS FACTOR / SERVICE. DESCRIPTION. Awareness of Environmental Problem. One success factor identified was the perception of the community that their fishery was in crisis. This is attributed to environmental information and education activities, both formal and informal, which may have different target audiences within the community. (1,7). Successful Alternative Income. Community Participation in Decision-Making. Continuing Advice. Alternative income refers to sources of income other than fishing, and may include supplementary livelihoods that complement income from fishing. (1) Community capacity to be involved in decision-making was also attributed to environmental education activities. However, for the purposes of this study, this factor refers solely to opportunities for community members to contribute their opinions and knowledge, and to actually make decisions that translate into policies. Examples would be community consultations, elections, and ―counterparting‖ or community contributions (e.g. labour, materials) in MPA management. (1, 3, 6) The accessibility of assisting organisations by community members seeking advice was found to be one MPA success factor. This includes the proximity of the organisation to the community and the strength of relationships formed at the community level. (1, 3). 9.
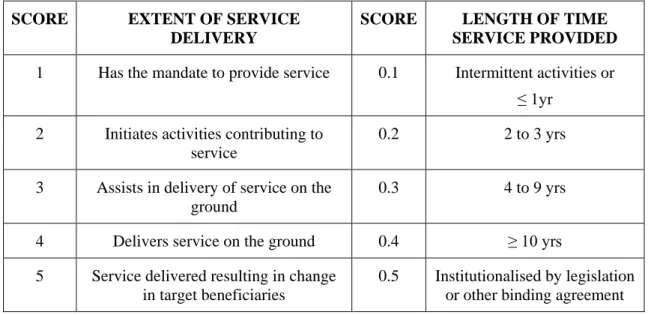
(19) SUCCESS FACTOR / SERVICE. DESCRIPTION. Fair and Effective Enforcement. Enforcement refers to the conduct of regular patrols, and the appropriate punishment being carried out when violations are committed. Activities contributing to this may include the organisation of enforcement teams, or the training of community members to become deputised fish wardens. (2, 3). Management Inputs. Management inputs refer specifically to MPA management infrastructure, such as marker buoys, sanctuary sign boards, patrol boats and guardhouses, or funding that is allocated for these infrastructure. Activities contributing to these include the monitoring of marine resources and the delineation of MPA boundaries. (1, 2). Capacity Development of MPA Managers. Clear MPA leadership and participation in continuing training are two factors identified by different studies as contributing to MPA success. This service refers specifically to training activities targeted at equipping MPA managers, rather than the whole community, with specific skills related to MPA management. This may include activities that develop leadership among particular individuals. (3, 5). Social Learning among MPA Communities. Participation in cross-site visits, or visits to other MPAs, in combination with community environmental education where there is personal exchange, as opposed to formal trainings, has been identified as a success factor for MPA networks. A score is given to actors that enable MPA communities at a particular scale to learn from or share knowledge with other MPA communities, regardless of what scale the other communities are on. (4, 5). Coordination of management units. Collaboration among management units, especially villagelevel management committees and governments, has been found to correlate with perceived effectiveness of MPA management. A score is given to institutions that facilitate the interaction of different units within a management system, especially across scales. (3, 4, 5). 1) Pollnac et al., 2001, 2) Walmsley and White, 2003, 3) Christie et al., 2009b, 4) Lowry et al., 2009, 5) Pietri et al., 2009, 6) Pomeroy et al., 1997, 7) Crawford et al., 2006. Similar to approaches used by Pollnac et al. (2001) and Christie et al. (2009b) to assess factors contributing to MPA success, actors identified at each scale by key informants and mentioned in literature were rated on a scale of 1 to 5 based on the extent of in delivery of the critical services, as attributed by key informants and available literature. The extent of service delivery was weighted based on the length of time the service was. 10.
(20) provided. Table 2 shows the rating system for both extent of service delivery and length of time. Table 2. Rating system for actors delivering services contributing to MPA success SCORE. EXTENT OF SERVICE DELIVERY. SCORE. LENGTH OF TIME SERVICE PROVIDED. 1. Has the mandate to provide service. 0.1. Intermittent activities or ≤ 1yr. 2. Initiates activities contributing to service. 0.2. 2 to 3 yrs. 3. Assists in delivery of service on the ground. 0.3. 4 to 9 yrs. 4. Delivers service on the ground. 0.4. ≥ 10 yrs. 5. Service delivered resulting in change in target beneficiaries. 0.5. Institutionalised by legislation or other binding agreement. The scores for the extent of service delivery range from whether the actor has the potential capacity to provide the service should the community seek its assistance (score 1), to whether the delivery of the service has produced an evident change in the recipients of the service, such as a change in behaviour (score 5). Score 2 refers to activities that may lead to the actual success factor or service being implemented, but do not directly result in the service being provided. Score 3 refers to the role of the actor as secondary in providing the service, such as in providing personnel or funding, but with another actor taking on the lead role in implementation. Score 4 is given to actors that take on a primary role in implementation of the service on the ground, having direct contact with the community. The ranges for length of time are based on durations of both project and political longevity. Typical development projects in the Philippines are funded for 2 to 3 years, whilst a single political term in local government also lasts 3 years. An indicator of 11.
(21) sustained MPA initiatives is when they are carried on beyond this typical time frame through a continuation in leadership or a project extension. Local government officials are allowed to serve for three consecutive terms, or 9 years. Sustaining the delivery of a service for longer than this implies the establishment of an institutional relationship or system that goes beyond changes in leadership or personalities. This is further strengthened and has a higher probability of being sustained when the delivery of the service becomes officially part of the system or management structure as indicated by a written commitment such as a law, since binding agreements are more likely to have built-in financing. This refers to laws or agreements that pertain to the service being provided to the particular MPAs, rather than just a general mandate. This does not include short-term binding agreements, or those that are effective for less than ten years. Ratings of actors were compared within and across scales. The ratings were also analysed using Multi-dimensional Scaling (MDS), Analysis of Similarities (ANOSIM) and Cluster Analysis using Euclidean distance and group average as measures of similarity (Clarke and Warwick, 2001).. 12.
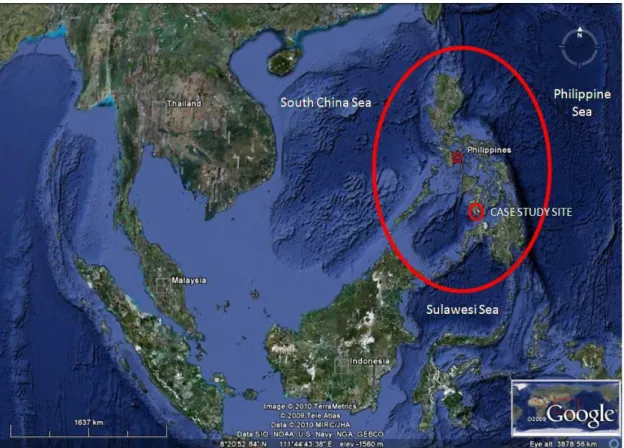
(22) 4. CASE STUDY. Adapted from Google Earth (2010). Figure 1. Location of the Philippines in Southeast Asia. The Philippines is an archipelago of more than 7,100 islands in Southeast Asia (Figure 1). It is located approximately between 4o23'N and 21o25'N longitude and 112oE and 127oE latitude. It is the second largest archipelago in the world, with an aggregate coastline of 36,289 km (WB, 2005). The country is divided into three main island groups: Luzon in the north, Visayas in the central region, and Mindanao in the south. It is bounded on the east by the Philippine Sea and the Pacific Ocean, on the west and north by the South China Sea, and on the south by the Sulawesi (Celebes) Sea. It is part of the Indo-Malay-Philippines coral triangle, which has been found to have the highest biodiversity of corals and marine shorefish in the world (Carpenter and Springer, 2005).. 13.
(23) As of August 2007, the country‘s population was 88.5 million, projected to increase to 92.23 million in 2009 (NSO, 2009); about 62% of this population lives in coastal areas, and approximately 1.4 million are dependent on fisheries (WB, 2005). From the first no-take fish sanctuary established in 1974, there are now over 1,300 established and proposed MPAs in the country; however, more than 50% are less than 10 hectares in size (Campos and Aliño, 2008). The Philippine Marine Sanctuary Strategy aims to put 10% of the country‘s 27,000 km2 of coral reef under full protection by 2020 (CTI, 2009). At present, only 1,459 km2 of Philippine reefs are within no-take MPAs (Weeks et al., 2009). This case study demonstrates how the technology of community-based no-take MPAs as a tool for coastal and marine resources management has been adopted at different scales of management in the Philippines. Community-based no-take MPAs in the Philippines are defined as MPAs where 1) all forms of human extraction of resources are permanently prohibited within the boundaries, and 2) management decisions and implementation of MPA rules are in large part the responsibility of the local community through institutions created by the local government, or through a community-based people‘s organisation in the area (Crawford et al., 2000). These MPAs may also locally be known as marine sanctuaries, fish sanctuaries and marine reserves. In the following case study, a background on the institutional and legal framework for the establishment of MPAs in the Philippines is first provided, after which descriptions of MPA management at island, municipal, provincial and national scales are presented. 4.0.1 Institutional framework The Philippines is a democratic republic run by three branches of government: the legislative, executive and judicial. The legislative branch creates laws, the executive 14.
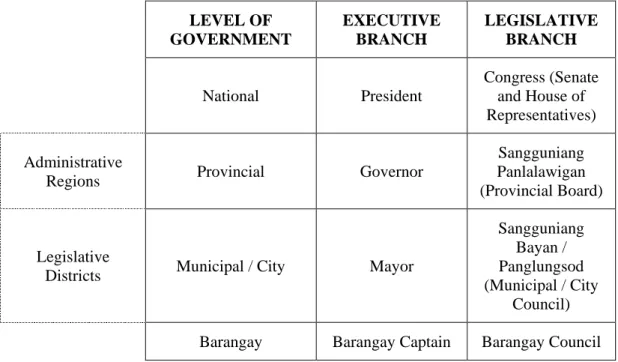
(24) branch implements the laws, and the judicial branch deliberates on violations of the laws. Politically, the country is divided into provinces, which are headed by governors (Table 3). For administrative purposes, provinces are grouped into regions, with the country having a total of 17 regions at present. Provinces are sub-divided into municipalities and cities, headed by mayors. Municipalities and cities are grouped into legislative districts, which are represented at the national level by elected officials in the House of Representatives. Each municipality and city is further sub-divided into barangays or villages headed by barangay captains. The barangay is the smallest political unit. Each level of government has a council that acts as the local government‘s legislative branch. The council passes ordinances, which are laws that apply to its respective province, municipality/city or barangay. The governor or mayor may create offices as needed to implement national and local laws, such as a Coastal Resource Management Office or a Fisheries and Agriculture Office. Each local chief executive and council member serves a term of three years, for a maximum of three consecutive terms. At the national level, the legislative branch is composed of the House of Representatives and the Senate. National laws or Republic Acts (RAs) are proposed and jointly passed by these two bodies, with final approval given by the President of the Philippines. The President, as head of the executive branch, may also issue Executive Orders that pertain to the implementation of national laws. Also part of the executive branch and reporting to the President are national line agencies, such as the Department of Environment and Natural Resources, that implement activities as mandated by law. These national line agencies are each headed by a Department Secretary, with Regional Executive Directors implementing national directives at the regional level. National line agencies may also have officers assigned at the provincial and municipal/city level. Department Secretaries 15.
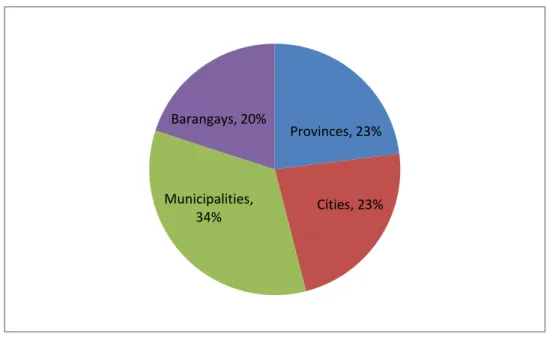
(25) may issue Department Administrative Orders (DAOs) that serve as implementing rules of national laws. Table 3. Institutional framework of the Philippine government. Administrative Regions. Legislative Districts. LEVEL OF GOVERNMENT. EXECUTIVE BRANCH. LEGISLATIVE BRANCH. National. President. Congress (Senate and House of Representatives). Provincial. Governor. Sangguniang Panlalawigan (Provincial Board). Municipal / City. Mayor. Sangguniang Bayan / Panglungsod (Municipal / City Council). Barangay. Barangay Captain. Barangay Council. Forty percent of the taxes collected by the national government are shared by the local government units (LGUs) as their internal revenue allotment (IRA) (RA 7160, Sec. 284). Of this 40% share, 23% each is allotted to provinces and cities, 34% to municipalities, and 20% to barangays (Figure 2). The IRAs are expected to fund the delivery of basic services at local levels, although each LGU also has the autonomy to create its own sources of income, such as from issuing permits and licenses. The actual amount released to each LGU is based on its population and land area, as well as on the total number of LGUs in the country. Of each LGU‘s annual IRA, at least 20% is required to be spent on development projects. This is commonly known as the ―20% economic development fund‖.. 16.
(26) Barangays, 20%. Municipalities, 34%. Provinces, 23%. Cities, 23%. Source: RA 7160, Sec. 284. Figure 2. Distribution of local government share (40%) of national internal revenues. 4.0.2 Legal framework The 1987 Philippine Constitution is the primary law of the country, with which all other laws must be harmonised. It mandates the State to protect each citizen‘s right to ―a healthful and balanced ecology‖ (Article II, Sec. 16) as well as ―the nation‘s marine wealth...to reserve its use and enjoyment exclusively to Filipino citizens‖ (Article XII, Sec. 2). It specifically states that ―the State shall protect the rights of subsistence fishermen, especially of local communities, to the preferential use of the communal marine and fishing resources, both inland and offshore.‖ (Article XIII, Sec. 7). MPAs may be established by law either by the national government or the municipal government (Figure 3). The Local Government Code of 1991 (RA 7160) assigns the primary responsibility over coastal waters to municipal governments. It gives exclusive authority of granting fishery privileges within municipal waters to the municipal or city government (RA 7160, Sec. 149). The law defines municipal waters as all inland water bodies as well as coastal waters within 15 km of the municipality‘s or city‘s coastline (RA 7160, Sec. 131). Regulations pertaining to the use of municipal waters are. 17.
(27) institutionalised through the legislation of municipal ordinances. The law also devolves several environmental management functions, such as solid waste and community-based forestry management and fishery law enforcement, to be provided as basic services by the province and municipality/city. Section 35 encourages local governments to partner with people‘s organisations (POs) and non-government organisations (NGOs) in delivering these basic services. The Philippine Fisheries Code of 1998 (RA 8550) specifically addresses the establishment of MPAs. Under Section 81 of this law, at least 15% of a town‘s municipal waters are to be designated as fish sanctuary for food security purposes. The lead implementing agency of the Fisheries Code is the Bureau of Fisheries and Aquatic Resources (BFAR) of the Department of Agriculture. Under the old Fisheries Code of 1974, the BFAR centrally managed all fish sanctuaries in the country; the Fisheries Code of 1998 devolves fisheries management primarily to municipal governments with technical assistance from the BFAR. The BFAR, however, may also declare areas as fish sanctuaries and refuges, as well as manage all marine reserves already established by Congress or the President (RA 8550, Sec. 81). Some MPAs, on the other hand, are established under the National Integrated Protected Areas System or NIPAS Act of 1992 (RA 7586). These may be declared either by Congress or the President upon the recommendation of the Department of Environment and Natural Resources (DENR). In this case, the DENR is the lead authority in the management of the MPA instead of the municipal government. All bodies of water that are declared to be under national protection are excluded from the municipal waters of a municipality or city (RA 7160, Sec. 131).. 18.
(28) 1987 Philippine Constitution. National Integrated Protected Areas System (NIPAS) Act. Department of Environment and Natural Resources. Philippine Fisheries Code. Local Government Code. Bureau of Fisheries and Aquatic Resources. Municipal Government. Figure 3. Legal framework for MPA establishment and the primary management bodies. 4.1. Island Apo Island is a 0.74-km2 volcanic island in the Bohol Sea, about 5 km southeast of Negros Island (Russ and Alcala, 1999). Politically, the island is a barangay within the municipality of Dauin in the province of Negros Oriental in Central Visayas (Region VII), Philippines (Figure 4). As of 2007, it had a population of 745 (NSO, 2007), from a population of about 700 in 2001 and 460 in 1986 (Raymundo and White, 2004). It has a wide fringing reef of about 106 hectares from the shoreline up to a depth of 60 m, with a recorded 54 species of hard coral and 146 species of fish (PAMB and DENR, 2007). Its 15-hectare MPA is found on the southeastern part of the island. Currently, the MPA is part of a bigger Apo Island Protected Landscape and Seascape that is managed under the NIPAS. This section discusses only the period of management under the community-based Marine Management Committee from 1985 to 1994.. 19.
(29) Inset map adapted from Russ et al. (2004). Figure 4. Location of Apo Island and its MPA. 4.1.1. History of establishment Researchers from Silliman University in Dumaguete City, Negros Oriental came to the island in 1976 to introduce the idea of a no-take marine reserve. This initiative came after the same researchers established the Philippines‘ first no-take MPA on Sumilon Island, in the neighbouring province of Cebu, in 1974 (Russ and Alcala, 1999). On Apo Island, however, it was decided that the strategy would be community-based rather than academic-led. The Marine Conservation Program (MCP) of Silliman University, funded by the United Board for Christian Higher Education in Asia (UBCHEA), was implemented from 1979 to 1980, using non-formal environmental education by community workers as a strategy. The programme also included the first survey of the island‘s marine resources by marine biologists. Work on the island was facilitated by relationships already formed by scientists with island residents during a previous study. 20.
(30) of amphibians and reptiles on the island in the 1950‘s (Alcala, 2001, Raymundo and White, 2004). After this initial programme ended, community work was continued by the Marine Conservation and Development Program (MCDP), also implemented by Silliman University and funded by the United States Agency for International Development (USAID) through The Asia Foundation (TAF) from 1984 to 1986. The MCDP‘s role was to provide education in organisational development, finance and resource management, and to act as conduit between the community and the municipal government, provincial police, the BFAR, as well as other interested agencies. Support for alternative livelihood schemes such as mat-weaving was also given, although none of these schemes were sustained (White and Savina, 1987). By 1982, the community had agreed to select a 0.45 km stretch of reef to become the no-take area (Russ and Alcala, 1999). Silliman University went into an agreement with the municipal government of Dauin to strengthen this move. However, it was not until April 1985 that the community developed a management plan for the MPA as well as for the entire fringing reef up to 500 m from the shoreline. This was supported by a municipal council resolution in October that same year; the MPA was officially established by a municipal ordinance in November 1986 (PAMB and DENR, 2007, White and Savina, 1987). MPA management was to be done in conjunction with the Dauin municipal council with assistance from the BFAR and the provincial police, and management advice from the MCDP (Sangguniang Bayan of Dauin, 1986). In 1985, members of a Marine Management Committee (MMC) were elected by the island residents to take responsibility for implementing the management plan. As stated in the ordinance, the MMC was the primary authority for MPA management from that. 21.
(31) time until the entire island was placed under the NIPAS by the President of the Philippines in August 1994. Silliman University continued to assist the MMC beyond the MCDP in the form of reef monitoring, technical advice on MPA guidelines, and projects such as giant clam restocking (Calumpong, 18 December 2009). Other organisations, such as the NGO Haribon Foundation based in Manila, also provided assistance in the form of funds for infrastructure and educational materials (Suan, 04 December 2009). Under the DENR‘s Coastal Environmental Program, a cooperative was set up and livelihood projects introduced (Cababasay-Lizada, 2008). 4.1.2. Management structure The MMC, being the main management body, met monthly to formulate policies, which would then be approved by the general assembly consisting of all island residents (Pascobello, 03 December 2009) (Figure 5). Decisions on the MPA location and size, however, were made prior to the creation of the MMC by the whole community on the island. Before the MMC was formed, management was done by the barangay council in concert with the municipal council of Dauin and advice from the MCDP. Problems were brought up in community assemblies and barangay meetings. Enforcement was the responsibility of the MMC in cooperation with the provincial police, but implemented by rotating shifts of volunteer residents (White and Savina, 1987, Suan, 04 December 2009). Eventually, a volunteer Bantay Dagat or fish warden organisation was organised by the provincial government to act as the official enforcement team (Pascobello, 11 February 2010). Donations given by users as well as benefactors were collected by the MMC. The municipal council received part of the revenues subject to the submission of a plan that. 22.
(32) had to be approved by the barangay council (Cababasay-Lizada, 2008). Fixed user fees, instead of donations, could not be collected as the MMC had no legal personality.. Figure 5. MPA management structure of Apo Island (1985-1994) Boxes with same colour indicate units at same management level; dashed boxes and arrow indicate units and function not part of the legislated management structure. Circles represent social-ecological systems. Arrows indicate inputs or action directed towards other units/systems.. 4.1.3. Objectives and motivations White and Savina (1987) cite the initial objectives of establishing an MPA on Apo Island as ―to prevent destructive fishing, increase the abundance and diversity of coral reef fishes at the islands, and increase long-term fish yields‖. Part of the objective of the MCDP was to organise groups of local people to undertake marine resource management and set up alternative livelihoods. The primary aim in the beginning, therefore, was the conservation of fish stocks by engaging local participation, rather than income generation for the community (White, 14 November 2008). 23.
(33) On the part of the islanders, the initial reaction to the MPA was resistance, due to fears that the entire island would be closed to fishing, and that the residents would be ejected (Pascobello, 03 December 2009). The motivation to accept the idea of a no-take marine reserve stemmed from the lack of any other solution to the problem of overfishing. The decrease in fish catch had reached a point at which the people were willing to experiment on the no-take reserve proposed by researchers from Silliman University (Pascobello, 03 December 2009, Suan, 04 December 2009). This was, however, subject to the condition set by the barangay council that if no results were seen after two years, the community would revert to the open access regime. When a 2% to 3% increase in hard coral cover and increasing fish yields were seen after about two years, the whole community was convinced to make the MPA permanent (White and Savina, 1987). 4.1.4. Strategies and methods The concept of the community-based approach to resource management originated from work with upland rice farmers by the Silliman University Research, Extension and Development Office (White, 13 November 2009). Dr. Angel C. Alcala, who at that time was vice-president of the office and had been monitoring the reefs in the Bohol Sea since the mid-1970‘s as part of the first nationwide Coral Reef Survey Project of the University of the Philippines, decided to apply the community-based approach to the management of fisheries resources off the islands in the area. According to Alcala (07 December 2009), the primary principle in the work with upland farmers was to stimulate their thinking and enable them to help themselves by adopting new technology and sharing ideas with their neighbours. This would then result in cooperative schemes such as several villages joining together to form organisations that provided health services and livelihood, for example.. 24.
(34) Two key processes were adopted in the coastal application of this methodology: 1) the organisation of communities for certain purposes, and 2) the education of communities about ecosystem processes linked to food production. The organisations resulting from these two processes were envisioned to implement resource management measures using a no-take marine reserve as a tool (Alcala, 07 December 2009). The strategy was to send full-time community development workers trained in marine ecological principles and water skills such as SCUBA diving to live on the island rather than sending marine scientists trained to be community workers (White and Savina, 1987). Non-formal education was a deliberate strategy used to increase awareness, especially in the early part of the project. This refers to slideshows, group discussions, one-on-one conversations, posters, and interviews done with the support of local leaders both political and social to win the commitment of the villagers (Cabanban and White, 1982, White and Savina, 1987). This strategy worked by drawing out local problems and knowledge as a starting point for the introduction of scientific methods. A participatory approach to data collection was also used by having fishermen list their daily fish catch for a period of 12 months; the data were then compiled by Silliman and presented to the general assembly in graphs (White and Savina, 1987). Alcala says that choosing the leaders was important, since they were the ones who dispersed information and ideas to the rest of the community (07 December 2009, Cabanban and White, 1982). The people who were to become part of the MMC were identified through their interest and management skills during an initial community project, which was the building of a community centre (White and Savina, 1987). As an incentive to those involved in MPA management, 10% of the income was given to the collector, 5% to the caretaker, and 15% to the MMC officers (Calumpong and Cadiz, 2003). 25.
(35) 4.1.5. Benefits The Apo Island MPA is one of the few MPAs in the world with sufficient long-term monitoring data to demonstrate a spillover effect. Not only has an increase in the biomass of target fish species been seen inside the reserve, but also a significantly higher total catch of major fish families after reserve establishment, and reduced fishing effort (Alcala et al., 2005, Russ et al., 2004). Higher catch per unit effort has been documented up to 200 to 300 m away from the MPA boundaries, with almost 63% of all hook-and-line catches coming only from this area, or 11% of the total fishing ground (Abesamis et al., 2006, Abesamis and Russ, 2005, Russ and Alcala, 2003, Russ et al., 2003). These changes are especially noteworthy because the MPA was established in a small, highly degraded area that the community could afford to give up rather than in their traditional fishing ground (Alcala, 2001). In the final year of the MMC‘s operation, donations amounting to Php 29,916 were collected from April to November 1999 (Calumpong and Cadiz, 2003). Income from donations was used to fund barangay development projects such as infrastructure, health and education (Pascobello, 11 February 2010, Cababasay-Lizada, 2008). 4.1.6. Learning and diffusion Inputs to the MMC came primarily as technical advice from Silliman University. The island‘s success story was diffused to other scales, however, through several channels, although Silliman University as a research institution was a major one. The model was replicated by Silliman University on other islands in the Bohol Sea through similar projects (Alcala, 2001). The experience has also been widely publicised through MPA workshops, seminars and publications of NGOs, word-of mouth by people who have visited Apo Island, books and reports such as those published by the Coral Reef Information Network of the Philippines (PhilReefs), and both popular and technical 26.
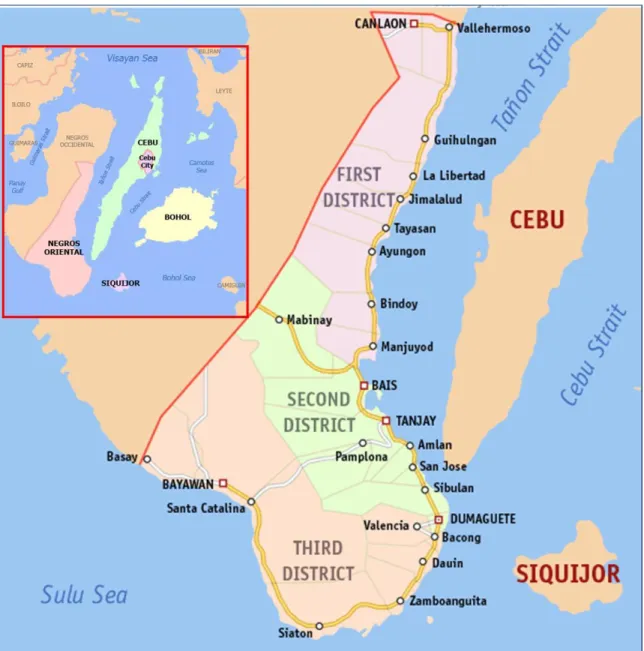
(36) publications such as those published by the Silliman University Angelo King Center for Research and Environmental Management (SUAKCREM), and newspaper columns written by Alcala himself for provincial and national newspapers (Alcala, 07 December 2009, Alcala, 2001). Another important channel of diffusion is cross-site visits, or other MPA communities and local government officials visiting Apo Island and having direct contact with the MMC. These have been facilitated by organisations and projects such as the Coastal Resource Management Project (CRMP), the Central Visayas Regional Project (CVRP), Haribon Foundation, and the University of the Philippines Marine Science Institute (UP-MSI) (Pascobello, 03 December 2009). Mario Pascobello, former MMC head and barangay captain, was also brought by Indonesia‘s own USAID-funded Coastal Resource Management Project to personally teach communities in North Sulawesi the practical aspects of MPA management as part of its strategy. Pascobello (03 December 2009) also cites personal conversations, such as with the municipal mayor, as a way of passing on knowledge from the management of the Apo Island MPA. On the other hand, the national MPA network Pambansang Alyansa ng Maliliit na Mangingisda at Komunidad na Nangangalaga ng Karagatan at Sanktwaryo sa Pilipinas (PAMANA KA SA PILIPINAS) has also been a venue for the MMC to share their experiences.. 4.2. Municipal Dauin is a municipality in the province of Negros Oriental. It is bounded on the north by the municipality of Bacong, on the south by the municipality of Zamboanguita, on the west by the municipality of Sta. Catalina, and on the east by the Bohol Sea (Figure 6). It has a total area of 144.32 km2 and a population of 23,681 in 2007 from 19,609 in 1995 (NSO, 2007). It has a total of 23 barangays, nine of which are coastal, including Apo Island. The coastline is approximately 12 km long (Muncipality of Dauin, 2001). The 27.
(37) total population of all coastal barangays on the mainland is 12,027. At present, it has nine MPAs in seven of its eight mainland coastal barangays (Alanano and Enumeradellon, 2006). The mainland MPAs range from 2.21 to 13 hectares in size, covering 57.12 hectares of the municipal waters (Alanano, 2009). Almost all of its reserves are rated functional by Alcala et al. (2008), and have achieved good to excellent status (Levels 3 to 5) on White et al.‘s (2006) MPA rating system (see Table 12 in Annex).. Inset maps adapted from Mike Gonzalez (http://upload.wikimedia.org) and Alanano (2009). Figure 6. Location of the Municipality of Dauin and its coastal barangays. 4.2.1. History of establishment According to Alanano and Enumeradellon (2006), the first initiative for MPA establishment on mainland Dauin was in 1978 through Silliman University‘s Marine Conservation and Development Program (MCDP), which was also implemented on Apo Island. This was in Barangay Lipayo. In 1986, the municipal council passed an 28.
(38) ordinance taking responsibility for the MPA. However, an unwillingness among community members to accept the MPA, which in turn led to a lack of political will in higher authorities to enforce, caused the MPA to fail. Two years later, the Central Visayas Regional Project – Phase I (CVRP-I) Nearshore Fisheries Component funded by the World Bank and implemented by the provincial government of Negros Oriental introduced artificial reefs and fish catch monitoring to improve fisherfolk incomes in the town. Two of the current MPAs are founded on artificial reefs (ENRD-Office of the Governor, 2009, CCEF, 2009). Reef surveys were done in 1994 by the Centre for the Establishment of Marine Reserves in Negros Oriental (CEMRINO), funded by the European Union and implemented by the University of Bremen with assistance from the German Development Service (GDS) and the Resource Management Division (RMD) of Negros Oriental (Alanano and Enumeradellon, 2006). The surveys enabled the identification of potential MPA sites. The RMD helped organise fisherfolk communities as a first step to having communitymanaged MPAs. A follow-up project, the Synergetic Management of Coastal Resources (SYMCOR), assisted in the establishment of some MPAs (ENRD-Office of the Governor, 2009). This initiative was followed by the Coastal Resource Management Project (CRMP) funded by the USAID, which conducted trainings and workshops in preparation for the drafting of a five-year coastal resource management (CRM) plan. Participatory planning workshops and validation sessions took place between 1999 and 2001 (Muncipality of Dauin, 2001); the CRM plan was approved by the municipal council in 2001. As part of the process, the CRMP also assisted in delineating the municipal waters in 2001 so that they could be zoned for different uses.. 29.
(39) Between 2001 and 2005, several MPAs were established with the assistance of the Environment and Natural Resources Division (ENRD, formerly RMD) of the provincial government and the Coastal Conservation and Education Foundation (CCEF), an NGO based in Cebu City in the province of Cebu, and its Saving Philippine Reefs Project (Alanano and Enumeradellon, 2006). Fishermen‘s associations were organised in every coastal barangay to manage their respective MPAs. CCEF contributed funds and technical assistance, particularly in the form of reef monitoring and trainings. This intervention included the application of an MPA rating tool that assessed the status of MPAs based on the presence of basic infrastructure and financial sustainability measures, among other things. The ENRD deployed community organisers to form the fisherfolk associations (Diaz Jr., 08 December 2009). The DENR provided technical assistance in delineating the MPAs (Alanano, 2009). Public hearings were held to resolve any resistance from community members. In 2005, a CRM Ordinance was passed, incorporating the CRM Plan into the municipal revenue code. The ordinance sets the boundaries of the MPAs, and specifies user fees as well as the distribution of income from these user fees. No new MPAs have been established since 2005, but efforts are being made to increase the sizes of existing MPAs. 4.2.2. Management structure Registered and accredited fishermen‘s associations (FAs) are the primary managers of the MPAs (Figure 7). These are organised groups of fishers composed of at least 15 members, with a set of officers and by-laws (Sangguniang Bayan of Dauin, 2005). Before being eligible to become MPA managers, they must first be accredited by the Department of Labor and Employment, and registered with the municipal government.. 30.
(40) The FAs decide on the size and location of the MPA, and propose this to the municipal council. They are also responsible for implementing MPA rules, such as the collection of user fees. The municipal council alone has the authority to pass a municipal ordinance to legally establish the MPA. Municipal ordinances are needed as well to enforce any regulations regarding resource use in the municipal waters. Municipal ordinances receive final approval from the Mayor. At present, Ordinance No. 05-01 of 2005 sets uniform rules for all the MPAs. Bantay Dagat, literally ―sea watch‖ or fish wardens, are organised and deputised in each barangay to enforce the MPA rules in coordination with the Police Environmental Desk Officer of the Philippine National Police (PNP) stationed at the municipality. Members are also usually FA members. The Bantay Dagat units meet monthly with the Mayor to discuss issues and work on common problems (Alanano, 04 December 2009, Diaz Jr., 08 December 2009). Together, all the Bantay Dagat units of the barangays form a municipal Bantay Dagat (Sangguniang Bayan of Dauin, 2005). The current Mayor has his own network of ―moles‖ who monitor the performance of the Bantay Dagat and update him on lapses in enforcement (Alanano, 04 December 2009). The Coastal Resource Management (CRM) Office, created by the same CRM ordinance under the Office of the Mayor, is tasked to propose measures related to CRM and to coordinate with government bodies and NGOs in the delivery of CRM as a basic service (Sangguniang Bayan of Dauin, 2005). The CRM Office also coordinates with the FAs in the disbursement of income from user fees and fines.. 31.
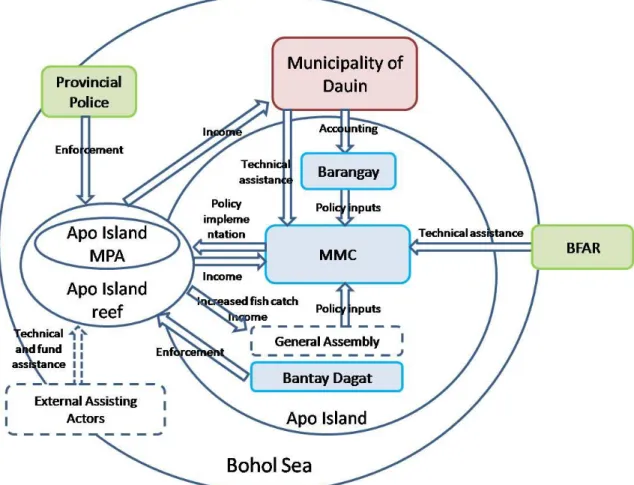
(41) Figure 7. MPA management structure of the Municipality of Dauin Boxes with same colour indicate units at same management level; dashed box and arrow indicate a unit and function not part of the legislated management structure. Units in italics indicate coordinating bodies; shaded arrows indicate interaction initiated by coordinating body. Circles represent social-ecological systems. Arrows indicate inputs or action directed towards other units/systems.. The Municipal Fisheries and Aquatic Resources Management Council (MFARMC) is an advisory body that is tasked to assist the municipal mayor and the municipal council in the formulation and implementation of CRM policies. Under the Fisheries Code, the municipal government must establish MPAs in consultation with the MFARMC, and the MFARMC itself may recommend areas for protection (RA 8550, Sec. 81). It is designed as a multistakeholder body that includes representatives from the national and municipal governments, NGO, private sector, and different fisheries sectors, including women and the youth (RA 8550, Sec. 75). At present, the Dauin MFARMC is composed of government representatives, such as the municipal agriculture officer and the Mayor, representatives of vendors‘ associations, all FA presidents, and Bantay Dagat representatives; it meets monthly (Diaz Jr., 08 December 2009). One of its 32.
(42) specific functions is to evaluate proposals for MPAs and FA accreditation, and also to investigate FAs that are no longer performing as they should. The ENRD continues to validate proposed sites for MPA establishment as needed (Alanano, 04 December 2009). Reef monitoring is conducted intermittently as part of projects or studies usually implemented through Silliman University, or by the ENRD when requested by the municipal government. 4.2.3. Objectives and motivation Municipal mayor Rodrigo Alanano, who is generally credited for the establishment and revival of Dauin‘s MPAs, says that his motivation was the municipality‘s ranking as one of the dirtiest in the country and one of the poorest in the province (04 December 2009). When he came into office in 2001, the coastline was heavily polluted by commercial fishing boats and vendors throwing their waste into the coastal waters. Due to the accessibility of transportation in the town, about 72 to 100 commercial fishing boats would dock every day. This prompted him to implement the CRM Plan, and enforce the provisions of the Philippine Fisheries Code, which meant banning all commercial fishers from the municipal waters in coordination with the BFAR. After the commercial fishers had been driven out, the Mayor then met with about 100 municipal fishermen, out of which only 10% agreed to have an MPA. With this minority and 5 representatives from vendors, the first FA was created spanning two barangays (Alanano, 04 December 2009). The network of MPAs was inspired by the Apo Island model of deriving incomes from user fees (Alanano, 04 December 2009, Pascobello, 03 December 2009). As a municipal councilor of Dauin during the 1980‘s, Alanano was already familiar with how the Apo Island MPA was being managed. The stated objective for setting up MPAs is ―to improve the quality of life and livelihood. 33.
(43) outcomes among people living in coastal communities and enhance adequate supply of food‖ (Alanano, 2009). 4.2.4. Strategies and methods Similar to Apo Island, community-organising was the main strategy used to establish the MPAs in each barangay. MPA management is grounded on an income-sharing scheme institutionalised by Ordinance No. 05-01. The MPA user fees are distributed in a scheme where 40% goes to the municipal trust fund, 20% to the barangay general fund where the MPA is located, and 40% to the FA or cooperative managing the MPA (Figure 8); the Bantay Dagat receive a monthly honorarium taken from the CRM trust fund. Recently, however, the municipal share has accrued directly to the general fund rather than to a special CRM trust fund. The share of the barangays and FAs is released back to them by the municipality subject to their submission of an accomplishment report and work and financial plan approved by their respective general assemblies (Alanano, 04 December 2009). Income is also earned from fines for violations of prohibited acts within municipal waters. Ten percent of fines collected within the barangay are shared equally by the barangay council and the FA. However, a portion of the FA‘s income and of the barangay‘s and municipality‘s 20% economic development fund is required to be allocated for MPA management yearly (Sangguniang Bayan of Dauin, 2005). On top of the funds received from user fees and fines, the Office of the Mayor also contributes a counterpart fund for MPA infrastructure and equipment in each barangay such as marker buoys and guardhouses, as well as funds for training.. 34.
Imagem
+7


Documentos relacionados