IMPACTS OF DIFFERENT MANAGEMENT SYSTEMS ON THE
PHYSICAL QUALITY OF AN AMAZONIAN OXISOL
(1)Elaine Maria Silva Guedes(2), Antonio Rodrigues Fernandes(3), Herdjania Veras de Lima(4), Ademar Pereira Serra(5), José Ribamar Costa(6) & Rafael da Silva Guedes(7)
SUMMARY
The physical quality of Amazonian soils is relatively unexplored, due to the unique characteristics of these soils. The index of soil physical quality is a widely accepted measure of the structural quality of soils and has been used to specify the structural quality of some tropical soils, as for example of the Cerrado ecoregion of Brazil. The research objective was to evaluate the physical quality index of an Amazonian dystrophic Oxisol under different manag ement system s. Soils under fiv e managements were sampled in Paragominas, State of Pará: 1) a 20-year-old second-growth forest (Forest); 2) Brachiaria sp pasture; 3) four years of no-tillage (NT4.); 4) eight years of
no-tillage (NT8); and 5) two years of conventional tillage (CT2). The soil samples were evaluated for bulk density, macro and microporosity and for soil water retention. The physical quality index of the samples was calculated and the resulting value correlated with soil organic matter, bulk density and porosity. The surface layers of all systems were more compacted than those of the forest. The physical quality of the soil was best represented by the relations of the S index to bulk density and soil organic matter.
Index terms: conventional tillage, no-tillage, S Index.
(1)Part of the Master´s dissertation of the first author presented at the Universidade Federal Rural da Amazônia - UFRA.
Received for publication in September 01, 2010 and approved im May 05, 2012.
(2) Professor, Núcleo de Pesquisa Básica e Aplicada. Universidade Federal Rural da Amazônia-UFRA. Rodovia PA 256, km 06,
s/n. CEP 68627-451. Paragominas (PA). Email: [email protected]
(3) Associate Professor III, Universidade Federal Rural da Amazônia - UFRA. Aveinda Presidente Tancredo Neves, 2501. CEP
6607-901. Belém (PA). E-mail: [email protected]
(4) Adjunt Professor, ICA. UFRA. Aveinda Presidente Tancredo Neves, 2501. CEP 6607-901. Belém (PA). E-mail:
(5) Pesquisador EMBRAPA-CNPGC. BR 262, Caixa Postal 154, CEP 79002-970 Campo Grande (MS). E-mail:
(6) Juparanã Comercial Agrícola LTDA. Rodovia PA 256 km 03, Setor Rural 68625-970 - Paragominas (PA). Email:
(7) Doutorando, Programa de Pós-graduação em Agronomia, Universidade Federal Rural da Amazônia - UFRA. Aveinda
RESUMO: IMPACTOS DE DIFERENTES SISTEMAS DE USO E MANEJO NA
QUALIDADE FÍSICA DE UM SOLO DA AMAZÔNIA
A qualidade física dos solos da Amazônia ainda é um assunto pouco explorado, em razão das características especiais que eles apresentam. Os índices de qualidade física do solo, como o índice S, têm se mostrado um bom indicador para representar a qualidade estrutural de vários solos do mundo, inclusive os do Cerrado brasileiro. O objetivo deste estudo foi avaliar a qualidade física de um Latossolo Amarelo da Amazônia sob diferentes usos e sistemas de manejo, a partir da densidade, da porosidade, da matéria orgânica e do índice S. As amostras de solos foram coletadas no município de Paragominas, Estado do Pará. Os sistemas de manejo avaliados foram: 1) mata secundária com cerca de 20 anos (Mata); 2) pastagem de braquiária; 3) plantio direto com 8 anos (PD8); 4) plantio direto com 4 anos (PD4); e 5) plantio convencional com 2 anos (PC2). Foram determinados a densidade do solo (Ds), macro e microporosidade, a curva de retenção de água, o índice S e as relações deste índice com a matéria orgânica (MOS), a Ds e a porosidade. Todos os sistemas de manejos mostraram-se compactados nas camadas superficiais, em relação à mata. A qualidade física do solo foi mais bem representada pelas relações do índice S com a densidade e a matéria orgânica do solo.
Termos de indexação: qualidade física do solo, plantio direto, plantio convencional, índice S.
INTRODUCTION
The quality of Amazonian soils, threatened by uncontrolled deforestation and agriculture, is a matter of concern for experts, particularly when use and management are also inappropriate. The soil physical quality is a subject-matter studied for decades by many researchers. Currently, the most accepted concept of soil quality is the capacity of a soil to fulfill its functions properly or not (Karlen et al., 1997). In agriculture, the soil has several functions: it serves as an optimal means for plant growth, regulates and participates in the mass and energy flow in the environment and acts as an environmental filter (Reichert et al., 2003).
After removing the native vegetation, the physical degradation, particularly of the soil structure, can be triggered by the intensive tillage in subsequent crops. Thus, the ideal environment for root growth is changed and eventually affects agricultural production (Reichert et al., 2003). Most pastures on Oxisols in the Amazon region are degraded to some degree, due to the deterioration of physical and chemical properties (Dias Filho, 2007). The high contact pressures caused by intensive cattle grazing and successive crops of maize, soybean or rice are the main activities causing the decline of soil quality in this region.
Oxisols, with texture class from sandy to very clayey, represent about 41 % of the soils in the Amazon region. These soils are generally found in soft undulating or flat landscapes, very favorable for intensive agriculture and animal husbandry (Vieira, 1988). Raising grain crops on Oxisols in the region began a little over two decades ago, but signs of deterioration of the soil physical and chemical quality are already noticeable. Conventional management
favors the decomposition of organic matter (OM) and the formation of compacted layers in the subsurface, increasing resistance to penetration (Bertol et al., 2001; Costa et al., 2003; Araújo et al., (2004c). Inappropriate pasture management has led to increased soil density, reducing pore space and water storage capacity (Muller et al., 2001). Oliveira et al. (2000) observed an increased bulk density after 17 years of grazing, which was however not significantly correlated with forage production. However, the pasture restoration benefits the soil structure, similarly as no-till systems improve it by OM accumulation (Colet, 2006)
The influence of management on soil physical quality has been studied based on a number of physical properties, e.g., bulk density, soil moisture and penetration resistance, and even combined in the Least Limiting Water Range, and more recently, in Brazil, the S index (Machado, 2006; Tormena et al., 2008). This S index has been proposed as an indicator of the soil physical and structural quality, and is based on the parameters of the water retention curve in the soil (Dexter, 2004a, b, c). Dexter (2004a) proposed an index value of -0.035 as limiting to plant growth. For the Cerrado, Andrade & Stone (2009) reported that an S index of 0.045 indicates a suitable soil physical quality.
thus determine a threshold between rational and inappropriate managements of Amazonian soils. Based on these considerations, the purpose of this study was to evaluate the physical quality of an Amazon Oxisol under different land uses and management systems, determining the density, porosity, organic matter content, and S index.
MATERIAL AND METHODS
Study areas
The experimental areas are located in Paragominas, State of Pará. The Aw climate, according to Köppen, is tropical rainy with a clearly defined dry season and an average annual temperature of 26.5 °C. The mean annual rainfall is 1,800 mm with two seasons - a rainy season that lasts from December to May and a less rainy season, from June to November. The relative air humidity ranges from 70 to 90 %. The relief of the region varies from flat to gently undulating, mostly, with average altitudes of around 200 m asl and a predominantly secondary vegetation, resulting from human action (Rodrigues et al., 2002). The soil was classified as clay-textured Oxisol (Embrapa, 2006), with predominance of the original vegetation, consisting of: dense equatorial subperennial forest, dense equatorial sub-perennial forest of the lowlands and dense evergreen alluvial rainforest (Silva, 1997).
The selection criterion of the areas was based on soil management data and uniformity of the areas. The data base of the semideciduous tree stratum of the project Radam Brazil (Brasil, 1981), with information on geology, geomorphology, pedology, vegetation, and land use potential of a property (02° 55' 24'' S, 47º 34' 36'' W) were also used. The experiment design used for data analysis was completely randomized, with five management systems and land uses (treatments) and seven replications.
The areas evaluated were: 1) 20-year-old secondary forest (“capoeira” forest); abandoned area after
successive low cuts, current plant heights between 15 and 20 m; 2) pasture (Brachiaria brizantha) restored in 2005, with one cut and application of 1 t ha-1 of lime, without incorporation. The pasture was degraded and had been used for extensive grazing at a stocking rate of one animal per hectare, until about 15 years ago; 3) eight years of no-tillage (NT8), growing maize/soybeans, with two chiselings in 2005 and 2007 to a depth of 0.25 m; 4) four years of no-tillage (NT4) without chiseling, growing maize/soybean. Brachiaria
ruziziense was used as ground cover in the NT
systems; 5) two years of conventional tillage (CT2), growing rice/soybean, with annual disking to a depth of 0.2 m, previously covered with secondary forest. The areas of no-tillage (NT8 and NT4) and conventional tillage (CT2) were fertilized with 2 t ha -1 of dolomitic limestone and 350 kg ha-1 of 02-28-20 NPK mixture at planting, and 100 kg of KCl was sidedressed, resulting in an average soybean yield of 3,600 kg ha-1 in the evaluation year.
Sampling and physical soil analyses
The soils were sampled in May 2008, in the dry season. In each area, a 0.5 ha plot was marked and soil samples collected from the layers 0 0.05, 0.05 -0.1 and -0.1 0.2 m, in seven replications per layer, resulting in a total of 21 samples per area. All undisturbed samples were collected with an Uhland sampler (stainless steel cylinder, height 0.05 m). To sample the 0.1 0.2 layer, the cylinder was placed in the middle.
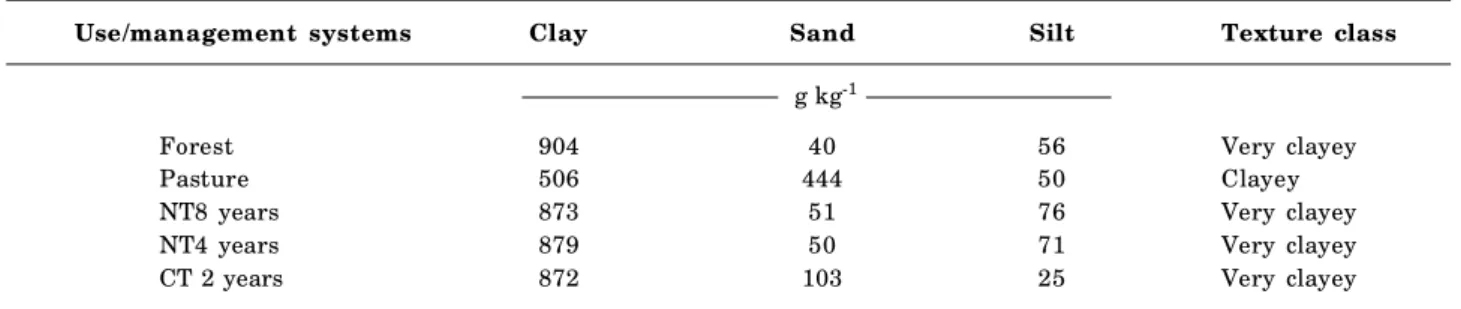
In conventional and no-tillage systems, soil samples were collected between rows at equal distances, following a transect in the area. Disturbed samples were taken for texture analysis as well as organic carbon from the pasture and forest areas, following a transect (Table 1).
Particle size was analyzed to a depth of 0 - 0.2 m, because the texture in the analyzed layers did not vary. The soil fractions were dispersed with 1 mol L-1 NaOH, stirred mechanically and wet-sieved, thus obtaining the sand fraction. The clay fraction was obtained by sedimentation using the pipette method and silt (by difference) (Embrapa, 1997). Total organic carbon was
Use/management systems Clay Sand Silt Texture class
g kg-1
Forest 904 40 56 Very clayey
Pasture 506 444 50 Clayey
NT8 years 873 51 76 Very clayey
NT4 years 879 50 71 Very clayey
CT 2 years 872 103 25 Very clayey
evaluated by potassium dichromate oxidation and titrated with ammonium ferrous sulfate (Walkley & Black, 1934). To determine the macro (> 50 mm) and micropores (<50 ), the undisturbed soil samples were saturated and exposed to a potential of -0.006 MPa (Embrapa, 1997), on a tension table. Particle density was determined using volumetric flasks, and because there was no variation, the general average of SD = 2.65 g cm-3 was taken (Embrapa, 1997). The total porosity was obtained by the formula (TP = 1 - BD/ PD), and soil bulk density was determined according to Embrapa (1997). To establish the water retention curve, the samples were exposed to a pressure range of 0.001, 0.002, 0.003, 0.004, 0.005, 0.006, 0.007, -0.008, -0.009, and -0.01 MPa on a tension table. Higher pressures (-0.03, -0.07, -1.0, -3.0, -10 and -15 MPa) were used for disturbed samples, (aggregate diameter ~ 4 mm), according to Dexter (2004a), in pressure chambers with a porous plate, as described by Klute (1986).
From the applied pressures, the respective moisture values were obtained and fit to the equation of van Genuchten (1980):
(1)
where is the volumetric water content (m3 m-3); ø: the matric potential (MPa); sat: the water content at saturation (m3 m-3); res: the residual water content (m3 m-3); and n are parameters of the fit model. The restriction m = 1 - 1 / n was adopted to adjust the model.
S index calculation
To determine the S index, in each soil management system, all potentials of the water retention curve were used in four replications, -0.001, -0.002, -0.003, -0.004, -0.005, -0.006, -0.007, -0.008, -0.009, and -0.01 MPa. For this purpose, the model of van Genuchten (1980) was used and from its parameters, the S index calculated, as demonstrated by Dexter (2004a), by the following formula:
(2)
All variables were subjected to ANOVA and means compared by the Tukey test at 5 %, using the Statistical Analysis System (SAS, 1999).
RESULTS AND DISCUSSION
Higher BD values were observed in the 0.05 0.1 m layer in all systems, except pasture. Costa et al. (2003) found significant increases in the BD of an Oxisol in the Cerrado, with 629 g kg-1 clay and conventional tillage in Paraná, in the 0.05 0.1 m layer.
In the pasture area, the BD values were highest in all layers, and compaction was highest in the 0 0.05 m layer (Table 2), indicating that cattle trampling affected the surface layer. Figueredo et al. (2008) found a BD of 1.54 t m-3 in the 0 0.1 m in clayey Yellow Oxisol under pasture, but without tillage. Thus, the highest soil compaction in the pasture area may be a consequence of the high animal weight, suggesting that pasture restoration without tillage does not contribute to the reduction of soil compaction.
Camara & Klein (2005) found no differences in the BD values between chiseled and non- chiseled no-tillage soil, down to a depth of 0.2 m in an Oxisol with 610 g kg-1 clay, but the highest BD values were concentrated at a depth of 0.1 m, confirming the results found in this study. Tormena et al. (2002) found higher BD values under no-tillage, to a depth of 0.1 m, than under conventional tillage. The higher BD in no tillage areas is related to the compaction caused by the cumulative effect of tractor and equipment trafûc and lack of plowing at the surface (Araújo et al., (2004c).
The higher BD values in CT2, NT8 and NT4 than in the forest area in the layers 0-0.05 and 0.05-0.10 m may be associated with the lower OM content, which was negatively correlated to CT2 (r = -0.68), NT4 (r = -0.89) and NT8 (r = -0.72), which were significant at 0.05. The organic material in the soil aggregates contributed to improve the soil structural stability (Horn et al., 1995). The contribution of organic matter to improve soil physical properties occurs only after 5 - 10 years of no-tillage, in a transition phase, when waste accumulation begins on the soil surface and the particles are re-aggregated, according to Sá et al. (2004) in a study with soils of Paraná. It is important to note that other factors, e.g., the climatic condition of the region, determine the persistence of straw on the soil. The geographic location of the sampling area is near the equator, in other words, the temperatures and humidity in the region of the Amazon are high, accelerating the decomposition process and consequently reducing the residues on the ground. Accordingly, the contribution of organic matter to improve soil physical properties may take longer. In the long term, the accumulation of OM helps to reduce soil bulk density in no-tillage (Tormena et al., 2002).
Macroporosity values found were lower in the pasture, CT2, NT4, and in NT8 than in the forest area (Table 2). Total porosity was significantly lower in all systems mentioned above in relation to the forest in the 0.05 - 0.1 m layer. Microporosity was similar in all soil tillage systems studied. The microporosity is strongly influenced by soil texture and organic carbon concentration, and slightly modified by the bulk density increase caused by machinery traffic or by animal trampling (Silva & Kay, 1997).
Costa et al. (2003), who found lower total porosity in a conventionally tiled area after 21 years in relation to no-tillage in a clayey Oxisol. Araújo et al. (2004b) stated that the macroporosity or air-filled pore space at the potential of -0.006 MPa is a measure related to the oxygen diffusion rate in soil. Aside from the forest area, macroporosity was below 0.1 m3 m-3, which is considered limiting to a good root development (Vomicil & Flocker, 1961).
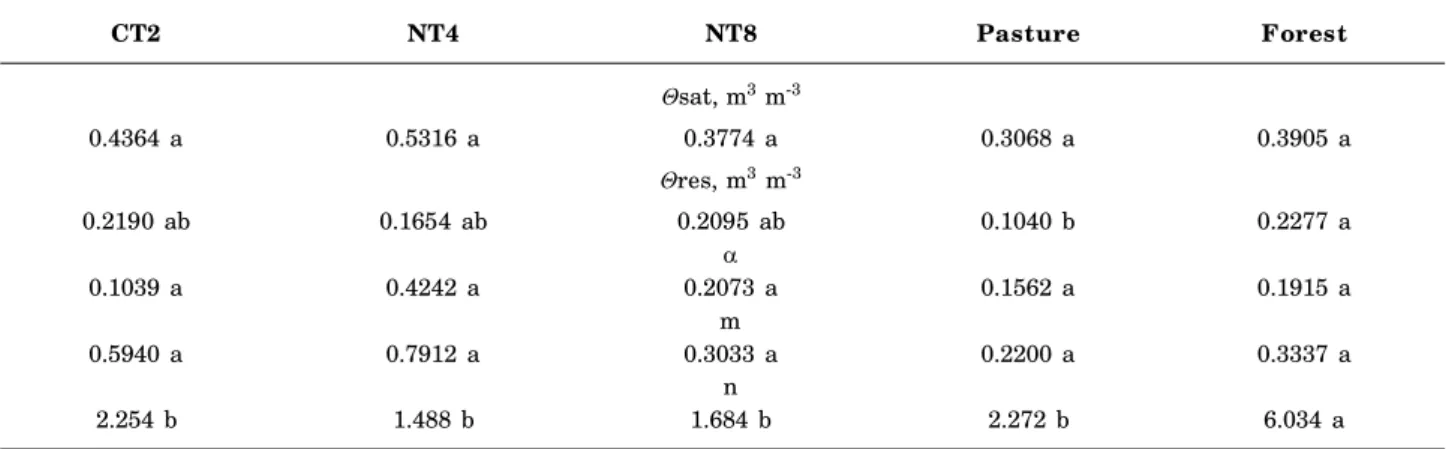
The values of moisture saturation ( sat) did not differ statistically between the systems studied. The residual moisture ( res) was highest in the forest area, but did not differ statistically from that of CT2, NT4 and NT8. The greater water-retention capacity at high potentials in the forest may be related to the OM content (Table 3). The higher value of the parameter
n (6.034) of the equation of van Genuchten (1980) observed in the forest area indicates a better soil structure (Dexter, 2004a).
The n values for CT2, NT4 and NT8 did not differ between systems and indicate that the pore size distribution, considering the applied potential, may be similar, which can be verified by equivalent amounts of macro and microporosity (Table 2). Machado (2006) evaluated the physical quality of an Oxisol in Maringa, Paraná, in a crop and a fallow area with 200 and 180 g kg-1 clay, respectively, and
noted lower water retention in these areas of former native forest. This suggests that when mulch is withdrawn from any system of soil use that involves the use of machines, there is a loss of structural pores with a reduction in the pore space that retains water at higher potential.
The total porosity and macroporosity were linearly adjusted as a function of the S index in all management systems (Table 4). The correlation coefficients of the equations of macroporosity were above 0.70 in the forest area and CT2, which can be a good indicator of the structural quality of these areas. The same results were observed by Stone et al. (2002) for an Oxisol under cerrado vegetation and Andrade & Stone (2009), for several soil classes of the cerrado.
The S index suggested by Dexter (2004a) as limiting is 0.035 for some classes of European soils, but for the soils of the Brazilian Cerrado, Andrade & Stone (2009) suggests a value of 0.045. Thus, applying the S of 0.045 in the equations for adjustment of total porosity (Table 4), the total porosity ranged from 0.39 to 0.55 m3 m-3 in the conventional and no-tillage management systems. The latter was very close to 0.53 m3 m-3, as reported by Andrade & Stone (2009) for clay soils. However, when replacing the S value 0.035 in the porosity equation, the porosity values range from 0.37
Layer CT 2 NT 8 NT 4 Pasture Forest CV
m Bulk density, Mg m-3 %
0-0.05 1.19 b 1.20 b 1.17 bc 1.48 a 1.06 c 7.88
0.05-0.10 1.22 b 1.21b 1.20 bc 1.45 a 1.14 c 6.49
0.10-0.20 1.13 c 1.12 c 1.18 bc 1.42 a 1.21 b 8.09
Macropores, m3 m-3
0-0.05 0.052 b 0.07 b 0.075 b 0.054 b 0.142 a 26.85
0.05-0.10 0.052 b 0.054 b 0.071 b 0.080 b 0.160 a 38.36
0.10-0.20 0.065 b 0.113 a 0.075 b 0.069 b 0.150a 44.41
Micropores, m3 m-3
0-0.05 0.434a 0.420 a 0.430 a 0.445 a 0.364 b 25.36
0.05-0.10 0.457 a 0.452 a 0.430 a 0.426 a 0.390 a 21.60
0.10-0.20 0.470 a 0.415 a 0.425 a 0.366 b 0.380 b 22.76
Total porosity, m3 m-3
0-0.05 0.486 b 0.490 ab 0.490 ab 0.499 a 0.506 a 5.87
0.05-0.10 0.509 b 0.506 b 0.501 b 0.506 b 0.550 a 8.29
0.10-0.20 0.535 a 0.528 ab 0.480 b 0.435 b 0.530 ab 5.94
Organic Matter, g kg-1
0-0.05 31.69 b 27.42 b 25.92 b 28.09 b 39.86 a 12.25
0.05-0.10 25.8 bc 31.35 ab 21.62 c 21.32 c 33.09 a 17.16
0.10-0.20 21.80 ab 28.34 a 17.17 b 17.3 b 22.91 ab 27.09
Table 2. Mean values of soil bulk density (BD), macroporosity, microporosity, and total porosity in the areas of conventional tillage for two years, (CT2), no-tillage for eight years (NT8) and no-tillage for four years (NT4), pasture, and forest, and their coefficients of variation
to 0.52 m3 m-3 in the same systems. These values are within the total porosity ranges which are not limiting to crop development, according to Kiehl (1979).
There were significant differences in the S index (p <0.05) in all layers and in the average values of the same index in the areas (Figures 1 and 2). The highest S indices were obtained in the forest area in all layers studied and CT2 did not differ from that in the 0-0.10 m layer, probably due to the recent soil tilling. Machado (2006) and Aguiar (2008) found similar results in an Oxisol under forest and in an Ultisol, respectively, the latter being compared to an area with agroforestry.
On NT4, NT8 and pasture, the decrease of the structural quality of these areas was evidenced by the low S indices, although most values were still higher than the root growth-limiting threshold of plants determined by Dexter (2004a).
The S index at depths of 0.05 and 0.1 m, in the overall mean of the CT2 area, did not differ from forest (Figures 1 and 2), which may be related to the time of land use. This area came to be used for grain production recently and was little exposed to mechanical operations so far.
In NT4 and NT8 lower S indices were found, but not significant compared to the pasture for all assessed layers and the means of the areas (Figures 1 and 2), reaching values close to the thresholds proposed by Dexter (2004a). This is evidence of the decrease in the soil physical quality of these areas with no-tillage and pasture. The no-tillage system is based on the concept of maintaining a soil cover and avoiding tillage, as control measures against erosion and for crop sustainability (Sá et al., 2004). The long-term use of this system in very clayey soils, as in this study, has led to the formation of compacted layers that prevent a good root development. Tormena et al. (2008) found
CT2 NT4 NT8 Pasture Forest
sat, m3 m-3
0.4364 a 0.5316 a 0.3774 a 0.3068 a 0.3905 a
res, m3 m-3
0.2190 ab 0.1654 ab 0.2095 ab 0.1040 b 0.2277 a
0.1039 a 0.4242 a 0.2073 a 0.1562 a 0.1915 a
m
0.5940 a 0.7912 a 0.3033 a 0.2200 a 0.3337 a
n
2.254 b 1.488 b 1.684 b 2.272 b 6.034 a
Table 3. Mean values of moisture saturation, residual moisture and the parameters of the van Genuchten equation (1980) in the areas of conventional tillage for two years (CT2), no-tillage for four years (NT4) and no-tillage for eight years (NT8), pasture, and forest
(1) Means of the areas followed by the same letter did not differ from each other by the Tukey test at 5 % (n=105).
Soil management TP (m3 m-3) MP (m3 m-3)
NT8 TP= 15.518S - 0.1471 MP = 2.486S - 0.0379
(r2 = 0.521*) (r2 = 0.626*)
NT4 TP = 8.1851S + 0.1281 MP= 3.1393S - 0.0465
( r2= 0.533*) (r2 = 0.589*)
CT2 TP = 1.5199S + 0.3248 MP = 0.5616S + 0.0173
(r2 = 0.508*) (r2 = 0.760*)
Pasture TP = 4.9211S+ 0.2459 MP= 3.3415S + 0.0029
(r2 = 0.508*) (r2 = 0.627*)
Forest TP= 2.0674S + 0.3739 MP= 1.3068S - 0.0023
(r2 = 0.592*) (r2 = 0.744*)
Table 4. Adjustment equations of macroporosity (MP) and total porosity (TP) as a function of the S index in the areas under no-tillage for eight years (NT8), no-tillage for four years (NT4), conventional tillage for two years (CT2), pasture, and forest
that more than 72 % of the samples of an Oxisol under conventional tillage showed values of S> 0.035, and for no-tillage 55 % of the samples. These results demonstrate the great potential of the S index to identify variations in the soil quality of different tillage systems (Tormena et al., 2008). Noventa et al. (2006) reported higher S indices in no-tillage soil with oats, due to the thin and aggressive root system that creates a series of long and thin channels resulting in better functionality to the soil structure.
In the forest area, the S values were highest, BD lowest and OM soil content highest. This indicates that the management systems closest to natural conditions or that maintain a stable ON content in soil with low BD probably allow higher S values, confirming the results obtained by Silva (2008) and Machado (2006).
There was positive relationship between OM contents and the S index, and a negative correlation between the S index and BD (Figures 3 and 4). Substituting the value of S = 0.035 on the Y axis in the equation of the straight line, the OM contents will be 18.73 g kg-1 on the X axis, but if S is 0.045,
Figure 1. S index values in the areas of two years conventional tillage (CT2 years), four years no-tillage (NT4), forest, grassland and eigth years no-tillage (NT8), in three layers, of an Oxisol. The horizontal line refers to the critical S index (Dexter, 2004a). ± standard deviation. The letters compare the layers of the areas by the Tukey test at 5 %.
Figure 2. Mean values of the S index for no-tillage areas for two years (CT2) no-tillage for four years (NT4) no-tillage for eight years (NT8), and pasture and native vegetation, soil. The horizontal line refers to the critical S index (Dexter, 2004). ± standard deviation. The letters compare areas by the Tukey test at 5 %.
Figure 4. Index S as a function of OM contents in some soil management systems. (n = 105; * the adjusted model is significant at p <0.05 by the F test).
this value rises to 25.4 g kg-1, independent of the management, i.e., OM contents below 18.73 g kg-1 may impair the soil quality under the conditions studied (Figure 4). Streck et al. (2008) fitted an exponentially increasing model for clayey soils of southern Brazil; they reported that for a soil with 4.7 % OM, the curve intersects the critical S point. Dexter (2004a) stipulated a limit of 12 g kg-1 of ON in temperate soils. Loveland & Webb (2003) claimed that most soil scientists assume a value of 3.4 % OM as critical for soils in temperate regions.
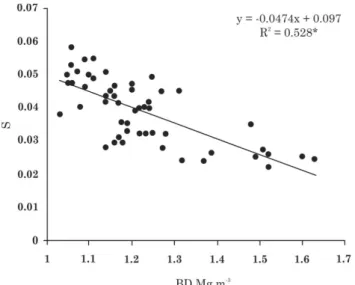
BD values above 1.30 t m-3 can affect root growth of the crops (Figure 4). The critical density of 1.27 t m-3, determined by the S index, was sufficient to limit root growth in a no-tillage Oxisol because the microstructure was affected (Cavalieri et al., 2009).
The reduction of the S index is directly associated with the increase in BD, and positively correlated with soil organic carbon (Dexter, 2004a). Considering the average value of the use and management systems studied, BD can explain 53 % of the variation of S, suggesting that regardless of the agricultural use of the soil, BD increases led to a reduction of S.
Regardless of the soil use and management, most S values exceeded the plant growth threshold. However, in no-tillage areas, where the management of the ground cover (straw) increases the OM content, the S indices may further increase.
The adjustment of the S index as a function of BD and soil ON for the soil under study enables monitoring of the soil quality under different management systems and proved to be an excellent indicator of the evaluated conditions.
CONCLUSIONS
1. Soil bulk density was highest in the 0.05 - 0.1 m layer in conventional and no-tillage systems and in the pasture compaction was observed at a depth of 0.05 m only.
2. The properties macroporosity and total porosity in the soil management and pasture systems were negatively affected, compared to the forest, whereas microporosity remained similar.
3. The relationships between the S index, bulk density and organic matter clearly indicated alterations in the soil physical quality of the conventional and no-tillage systems studied.
LITERATURE CITED
ANDRADE, R.S. & STONE, F. Índice S como indicador da qualidade física de solos do cerrado brasileiro. R. Bras. Eng. Agríc. Amb., 13:382-388, 2009.
AGUIAR, M.I. Qualidade física do solo em sistemas agroflorestais. Viçosa, MG, Universidade Federal de Viçosa, 2008. 76p. (Tese de Mestrado)
ARAÚJO, E.A.; LANI, J.L.; AMARAL, E.F. & GUERRA, A. Uso da terra e propriedades físicas e químicas de Argissolo Amarelo distrófico na Amazônia Ocidental. R. Bras. Ci. Solo, 28:307-315, 2004a.
ARAÚJO, M.A.; TORMENA, C.A.; INOU, T.T. & COSTA, A.C.S. Efeitos da escarificação na qualidade física de um Latossolo vermelho distroférrico após treze anos de semeadura direta. R. Bras. Ci. Solo, 28:495-504, 2004b.
ARAÚJO, M.A.; TORMENA, C.A. & SILVA, A.P. Propriedades físicas de um Latossolo Vermelho distrófico cultivado e sob mata nativa. R. Bras. Ci. Solo, 28:337-345, 2004c. BERTOL, I.; BEUTLER, J.F.; LEITE, D. & BATISDELA, O.
Propriedades físicas de um Cambissolo Húmico afetadas pelo tipo de manejo do solo. Sci. Agric., 58:555-560, 2001. BRASIL. Ministério das Minas e Energia. Secretaria-geral. Projeto RADAMBRASIL, folha SD. 24, Pará; Geologia, geomorfologia, pedologia, vegetação e uso potencial da terra. Rio de Janeiro, 1981.
CAVALIERI, K.M.V.; SILVA, A.P.; TORMENA, C.A.; LEÃO, T.P.; DEXTER, A.R. & HAKANSSON, I. Long-term effects of no-tillage on dynamic soil physical properties in Rhodic Ferrasol in Paraná, Brazil. Soil Tillage Res., 103:158-164, 2009.
CAMARA, R.K. & KLEIN, V.A. Propriedades físico-hídricas do solo sob plantio direto e rendimento da soja. Ci. Rural, 58:813-819, 2005.
COLET, M.J. Alteração de atributos físicos de um solo, sob pastagem degradada, submetido à escarificação. Campinas, Universidade de Campinas, Faculdade de Engenharia Agrícola, 2006. p.79. (Tese de Mestrado) COSTA, F.S.; ALBUQUERQUE, J.A.; BAYER, C.; FONTOURA,
S.M.V. & WOBETO, C. Propriedades físicas de um Latossolo Bruno afetadas pelos sistemas de plantio direto e preparo convencional. R. Bras. Ci. Solo, 27:527-535, 2003.
DEXTER, A.R. Soil physical quality. Part I. Theory, effects of soil texture, density and organic matter and effects on root growth. Geoderma, 120:201-214, 2004a.
DEXTER, A.R. Soil physical quality. Part II. Friability, tillage, tilth and hard-setting. Geoderma, 120:215-225, 2004b. DEXTER, A.R. Soil physical quality. Part III. Unsaturated
hydraulic conductivity and general conclusions about S-theory. Geoderma, 120:227-239, 2004c.
DIAS FILHO, M.B. Degradação de pastagens: Processo, causas e estratégias de recuperação. 3.ed. Belém, Embrapa Amazônia Oriental, 2007. p.152.
EMPRESA BRASILEIRA DE PESQUISA AGROPECUÁRIA -EMBRAPA. Serviço Nacional de Levantamento e Conservação do Solo. Manual de métodos de análise de
solo. 2.ed. Rio de Janeiro, 2006. 212p.
FIGUEREDO, C.C.; RAMOS, M.L.G. & TOSTES, R. Propriedades físicas e matéria orgânica de um Latossolo Vermelho sob sistemas de manejo e cerrado nativo. J. Biosci., 24:24-30, 2008.
HORN, R.; DOMZAL, H.; SLOWINSKA-JURKIEWICZ, A. & OUWERKERK, C. Soil compaction processes and their effects on the structure of arable soils and the enviroment. Soil Tillage Res., 35:23-36, 1995.
KARLEN, D.L.; MAUSBACH, M.J.; DORAN, J.W.; CLINE, R.G.; HARRIS, R.F. & SCHUMAN, G.E. Soil quality: A concept, definition, and framework for evaluation (A guest editorial). Soil Sci. Soc. Am. J., 61:4-10, 1997.
KIEHL, E.J. Manual de edafologia: Relações solo-planta. Piracicaba, Agronômica Ceres, 1979. p.264.
KLUTE, A. Methods of soil analysis. Part 1. 2.ed. Madison, Soil Science Society of America, 1986. p.687-732.
LOVELAND, P. & WEBB, J. Is there a critical level of organic matter in the agricultural soils of temperate regions: A review, Soil Tillage Res., 70:1-18, 2003.
MACHADO, J.L. Qualidade física de solo em distintos sistemas de uso e manejo quantificado pelo índice S. Maringá, Universidade Estadual de Maringá, 2006. 45p. (Tese de Mestrado)
MULLER, M.M.L.; GUIMARÃES, M.F.; DESJARDINS, T. & MARTINS, P.F.S. Degradação de pastagens na Região Amazônica: Propriedades físicas do solo e crescimento de raízes. Pesq. Agric. Bras., 36:1409-1418, 2001.
NOVENTA, A.N.; MACHADO, J.L.; TORMENA, C.A. & ROSSI JR., W. Índice S de um Latossolo Vermelho Distroférrirco sob plantio direto. In: REUNIÃO BRASILEIRA DE MANEJO E CONSERVAÇÃO DO SOLO E DA ÁGUA, 2006, Aracaju. Anais... Aracaju, 2006. CD ROM
OLIVEIRA, E.; MEDEIROS, G.B.; MARUN, F.; OLIVEIRA, J.C.; SÁ, J.P.G.; COLOZZI, F.A.; KRANZ, W.M.; SILVA Jr., N.F.; ABRAHÃO, J.J.S.; GUERINI, V.L. & MARTIN, G.L. Recuperação de pastagens no noroeste do Paraná: Bases para o plantio direto e integração lavoura e pecuária. 1a.versão. Londrina, IAPAR, 2000. 96p. (IAPAR. Informe de Pesquisa, 134)
REICHERT, J.M.; REINERT, D.J. & BRAIDA, J.A. Qualidade dos solos e sustentabilidade de sistemas agrícolas. Ci. Amb., 27:29-48, 2003.
RODRIGUES, T.E.; VALENTE, M.A.; GAMA, J.R.N.F.; OLIVEIRA JUNIOR, R.C.; SANTOS, P.L. & SILVA, J.L. Zoneamento Agroecológico do município de Paragominas, Estado do Pará. Belém, Embrapa Amazônia Oriental, 2002. 64p. (Boletim Técnico)
SÁ, J.C.M.; CERRI, C.C.; PICCOLO, M.C.; FEIGL, B.J.; BUCKNER, J.; FORNARI, A.; SÁ, M.F.M.; SEGUY, L.; BOUZINAC, S. & VENZKE FILHO, S.P. O plantio direto como base de produção. R. Plantio Direto, 84:45-61, 2004.
SAS Institute. SAS/STAT procedure guide for personal computer. 5.ed. Cary, 1999.
SILVA, R.C. Contribuições do levantamento de solos à caracterização dos sistemas naturais e ambientais na região de Paragominas-Pará. Belém, Faculdade de Ciências Agrárias do Pará, 1997. 107p. (Tese de Mestrado) SILVA, G.L. Qualidade física de um Luvissolo cultivado com sistemas agroflorestais e convencional no semi-árido cearense. Fortaleza, Universidade Federal do Ceará, 2008. 70p. (Tese de Mestrado)
SILVA, A.P. & KAY, B.D. Estimating the least limiting water range of soils from properties and management. Soil Sci. Soc. Am. J., 61:877-883, 1997.
STONE, L.F.; GUIMARÃES, C.M. & MOREIRA, J.A.A. Compactação do solo na cultura do feijoeiro. I: Efeitos nas propriedades físico-hídricas do solo. R. Bras. Eng. Agric. Amb., 6:207-212, 2002.
STRECK, C.A.; REINERT, D.J.; REICHERT, J.M. & HORN, R. Relações do parâmetro s para algumas propriedades físicas de solos do sul do Brasil. R. Bras. Ci. Solo, 32:2603-2612, 2008. (Número Especial)
TORMENA, C.A.; BARBOSA, M.C.; COSTA, A.C.S. & GONÇALVES, A.C.A. Densidade, porosidade e resistência à penetração em um Latossolo cultivado sob diferentes sistemas de preparo do solo. Sci. Agric., 59:795-801, 2002.
TORMENA, C.A.; SILVA, A.P.; IMHOFF, S.D.C. & DEXTER, A.R. Quantification of the soil physical quality of a tropical Oxisol using the S index. Sci. Agric., 65:56-60, 2008. WALKLEY, A. & BLACK, I.A. An examination of the Degtjareff
method for determining soil organic matter and a proposed modification of the chromic acid titration method. Soil Sci., v.37 p.29-38, 1934.
van GENUCHTEN, M.T. A closed-form equation for predicting the hydraulic conductibility of unsaturated soils. Soil Sci. Soc. Am. J., 44:892-898, 1980.
VIEIRA, L.S. Manual de ciência do solo com ênfase em solos tropicais. 2.ed. São Paulo, Agronômica Ceres, 1988. VORNOCIL, J.A. & FLOCKER, W.J. Effects of soil compaction