Universidade do Minho
Escola de Engenharia
Cristina Maria dos Santos Moreira da Silva Sylla
TUIs vs. GUIs: Comparing the Learning
Benefits for Kindergarten Children
Tese de Mestrado
Tecnologias e Sistemas de Informação
Mestrado em Tecnologia e Arte Digital
Trabalho efectuado sob a orientação dos Professores
Professor Doutor Pedro Sérgio Oliveira Branco
Professora Doutora Clara Maria Gil Pereira Coutinho
Cristina Maria dos Santos Moreira da Silva Sylla
TUIs vs. GUIs: Comparing the Learning
Benefits for Kindergarten Children
Universidade do Minho
ACKNOWLEDGEMENTS
_____________________________________________________________
The Master Course in Technology and Digital Art was a profound learning experience for me, I am grateful for the opportunity of working in such an exciting and inspiring atmosphere, learning new technologies and working with friends, colleagues and teachers in engaging and interesting projects. Thank you to Heduino Rodrigues, we worked together in de development of the interfaces.
I would like to express my thanks and appreciation to Prof. Dr. Pedro Branco for his excellent guidance, commitment, and availability being a mentor and a friend. Thank you to Prof. Dra. Clara Coutinho for her support, encouragement and friendship. Thank you too to Prof. Dra. Eduarda Coquet for helping me understanding children’s drawings.
Thank you to my family for their love and support during this time.
I also would like to thank Colégio Teresiano and Colégio D. Diogo in Braga, the kindergarten teachers Andreia Oliveira e Rosália Henriques, the parents and all the children for their willingness in helping us conducting this study.
I would also like to express my thanks to the authors and co-authors for their kindly permission of using their images.
ABSTRACT
_____________________________________________________________ In recent years numerous examples of tangible interfaces have been
developed targeting the educational domain, however their impact on learning is not clear when compared to educational software based on a graphical user interface. Most evaluation studies on the benefits of tangible interfaces for learning are rather informal and there are very few empirical studies comparing tangible and graphical interfaces. The evaluation
methodology of technology for very young children, 4 to 5 years old, poses some additional challenges given their limited ability of verbal or written expression; the majority of assessment methods are generally suitable for use with older children.
In an effort to better understand the learning impact of a tangible interface we conducted a comparison study between a tangible and a graphical user interface for teaching kindergarten children about good oral hygiene. The study was carried with two groups of children aged 4 to 5 years.
Questionnaires to parents, children drawings’ and interviews were used for data collection and analysis, and revealed important indicators about children’s involvement and preferences on the interfaces. The
questionnaires showed a remarkable change of attitude towards tooth brushing for the children that interacted with the tangible interface; particularly children’s motivation increased significantly. Children drawings’ were used to assess children’s degree of involvement with the interfaces. The drawings from the children that interacted with the tangible interface were very complete and detailed suggesting that children felt actively involved with the experience.
Regarding the methodology used, drawing intervention seems to be a
promising method to work with pre-literate children; however it is advisable to use it together with other methods, since the evaluation of drawings is rather subjective and can depend on various internal and external factors. The results suggest that the tangible interface was capable of a stronger engagement and impact on children.
RESUMO
_____________________________________________________________
Nos últimos anos têm sido desenvolvidos inúmeros exemplos de interfaces tangíveis visando o domínio educativo; no entanto o seu impacto na
aprendizagem não é ainda claro quando comparado com software educativo baseado em interfaces gráficas. Os estudos comparativos sobre os benefícios da utilização das interfaces tangíveis versus interfaces gráficas são quase inexistentes, sendo que a maioria é bastante informal. A metodologia de avaliação com crianças dos 4 aos 5 anos de idade coloca desafios adicionais devido à sua limitada capacidade de expressão verbal e escrita; para além disso grande parte dos métodos de avaliação é geralmente adequada a crianças mais velhas.
Com o intuito de compreender melhor o impacto das interfaces tangíveis na aprendizagem, foi realizado um estudo comparativo entre uma interface tangível e uma interface gráfica, desenvolvidas com o intuito de sensibilizar as crianças para uma boa higiene oral. O estudo foi realizado com dois grupos de crianças com idades compreendidas entre os 4 e os 5 anos. A recolha e análise de dados foi realizada através de questionários
distribuídos aos pais das crianças, desenhos feitos pelas crianças após a sua interacção com as interfaces, assim como entrevistas; revelando-se
indicadores importantes sobre a experiência das crianças e as suas preferências acerca das interfaces. Os questionários mostraram uma mudança notável de atitude em relação à lavagem dos dentes, no grupo de crianças que interagiu com a interface tangível; particularmente a motivação aumentou significativamente. Os desenhos do grupo de crianças referido revelaram-se muito detalhados e completos sugerindo que as crianças se sentiram activamente envolvidas na experiência.
Relativamente à metodologia utilizada, a análise dos desenhos mostrou ser um método promissor para trabalhar com crianças desta faixa etária, no entanto, é aconselhável utilizá-lo juntamente com outros métodos, dado que a interpretação dos desenhos é bastante subjectiva podendo depender de vários factores internos e externos. Os resultados do estudo sugerem que a interface tangível possibilita um envolvimento mais forte das crianças.
CONTENTS
____________________________________________________________ ABSTRACT ____________________________________________________________ iv RESUMO ______________________________________________________________ v LIST OF FIGURES ____________________________________________________ viii LIST OF TABLES ______________________________________________________ x CHAPTER 1Introduction _________________________________________________11 1.1 MOTIVATION _______________________________________________________11 1.2 APPROACH _________________________________________________________11 1.3 SUMMARY OF CONTRIBUITIONS _____________________________________12 1.4 THESIS ORGANISATION _____________________________________________13
CHAPTER 2 Drawing and cognitive development ____________________________15
2.1 INTRODUCTION _____________________________________________________15 2.2 THE STAGE THEORY ________________________________________________16 2.2.1 THE BEGINNING OF DRAWING _________________________________ 17 2.2.2 THE FIRST REPRESENTATIONS _________________________________ 18 2.2.3 SPACE IN THE PRESCHEMATIC STAGE (4-7) _____________________ 20 2.2.4 THE USE OF COLOUR IN THE PRESCHEMATIC STAGE (4-7) _______ 21 2.3 DRAWING AS A NARRATIVE PROCESS ________________________________22
CHAPTER 3 Physical educational interfaces _________________________________25
3.1 GIFTS AS A FIRST APPROACH TO TANGIBLE INTERFACES ______________25 3.2 LEARNING WITH DIGITAL TANGIBLE INTERFACES ____________________25 3.2.1 EXAMPLES OF EDUCATIONAL TANGIBLE INTERFACES __________ 28
CHAPTER 4 Evaluating technology for and with young children ________________37
4.1 HISTORICAL OVERVIEW _____________________________________________37 4.1.1 THE VISUAL ANALOGUE SCALE ________________________________ 38 4.1.2 THE STICKY-LADDER RATING SCALE___________________________ 38 4.1.3 THE FUN TOOLKIT_____________________________________________ 39 4.1.4 THE THINK ALOUD METHOD ___________________________________ 42 4.1.5 THE TALK ALOUD METHOD ____________________________________ 42 4.1.6 PEER TUTORING ______________________________________________ 42 4.1.7 DRAWING INTERVENTION _____________________________________ 43
CHAPTER 5 Comparing TUIs vs. GUIs_________ ____________________________47
5.1 INTRODUCTION _____________________________________________________47 5.2 TWO INTERFACES FOR TEACHING ORAL HYGIENE ____________________47 5.3 METHODOLOGY ____________________________________________________50 5.3.1 QUESTIONNAIRES _____________________________________________ 50
5.3.2 DRAWING INTERVENTION _____________________________________ 50 5.3.3 INTERVIEWS __________________________________________________ 51 5.4 COLLECTING CHILDREN’S ATTITUDES TOWARDS ORAL HYGIENE _____52 5.5 FIRST INTERACTION WITH THE INTERFACES __________________________53
5.5.1 DID CHILDREN’S BEHAVIOUR TOWARDS ORAL HYGIENE
CHANGED AFTER THE INTERACTION? ___________________________ 54 5.6 ANALYSIS OF THE QUESTIONNAIRES _________________________________54 5.6.1 QUALITATIVE RESULTS _______________________________________ 56 5.7 DRAWING INTERVENTION AS AN EVALUATION METHOD _________ 58 5.8 FOLLOW UP ________________________________________________________63 5.9 SECOND PHASE – EXCHANGING THE INTERFACES _____________________65 5.10 DO GRAPHICAL INTERFACES LOSE THEIR INTEREST AFTER
INTERACTING WITH TANGIBLE ONES? ______________________________66 5.11 OVERALL COMPARISON OF DRAWINGS TUIs vs. GUIs _________________69 5.12 TALKING WITH THE CHILDREN ABOUT THEIR EXPERIENCES __________69 5.13 DISCUSSION _______________________________________________________70 5.14 SHORTCOMINGS AND LIMITATIONS OF THE WORK ___________________74 CHAPTER 6 Conclusions and future work____________________________ 75 6.1 FUTURE WORK ____________________________________________________76 REFERENCES ________________________________________________________77
APPENDIX I QUESTIONNAIRE 85
APPENDIX II QUESTIONNAIRE RESULTS 86
LIST OF FIGURES
_____________________________________________________________ FIGURE 3-1 The Topobo system and an animal built with Topobo, reproduced from
(Raffle, Parkes and Ishii 2004). _________________________________________29 FIGURE 3-2 Top and Bottom of curlybot, reproduced from (Frei et al. 2000). _________29 FIGURE 3-3 TellTale Prototype, reproduced from (Ananny 2001).__________________30 FIGURE 3-4 Children creating an interactive story with Jabberstamp, reproduced from
(Raffle et al. 2007). __________________________________________________31 FIGURE 3-5 Exploring different patterns of an object (Ryokai, Marti and Ishii 2004),
reproduced from http://web.media.mit.edu/~kimiko/iobrush/). _________________31 FIGURE 3-6 Robotic construction with two built-in Crickets, which communicate with one
another to synchronize their motion, reproduced from (Resnick et al. 1998). ______32 FIGURE 3-7 The BitBall, reproduced from (Resnick et al. 1998). ___________________33 FIGURE 3-8 A necklace of Programmable Beads, reproduced from (Resnick et al. 1998).
__________________________________________________________________33 FIGURE 3-9 System Blocks simulating water flow through a bathtub, reproduced from
(Zuckerman 2004). __________________________________________________34 FIGURE 3-10 Thinking Tags, reproduced from (Resnick et al. 1998). _______________34 FIGURE 4-1The Wong-Baker FACES Pain Rating Scale, reproduced from (Wong on Web
Archive). __________________________________________________________38 FIGURE 4-2 The sticky-ladder rating scale, reproduced from (Airey et al. 2002). ______39 FIGURE 4-3 The Funometer – before and after completion, reproduced from (Read,
MacFarlane, and Casey 2002). _________________________________________40 FIGURE 4-4 The smileyometer, reproduced from (Read, MacFarlane, and Casey 2002). _40 FIGURE 4-5 A completed Fun Sorter with only one construct, reproduced from (Read and
MacFarlane 2006). ___________________________________________________41 FIGURE 4-6 A Completed Again - Again table, reproduced from (Read and MacFarlane
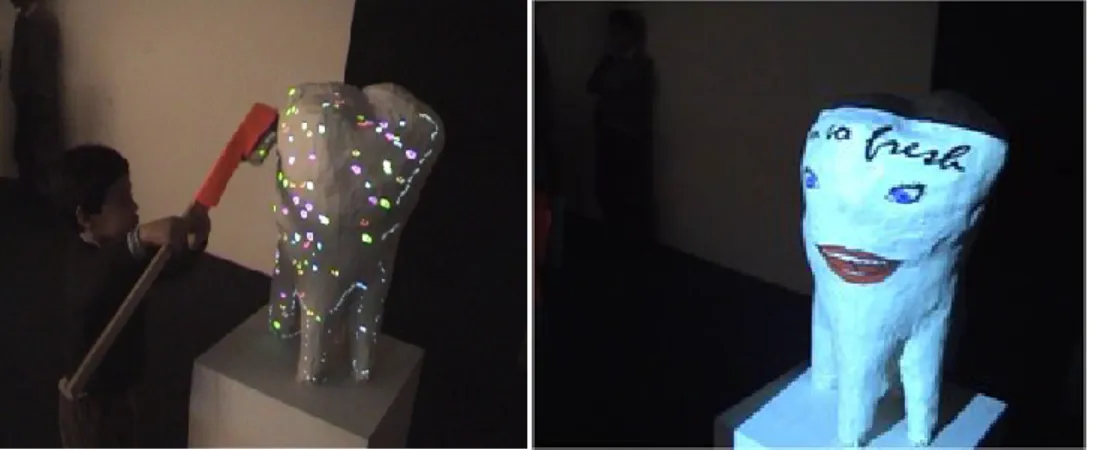
2006). _____________________________________________________________41 FIGURE 5-1 Two screenshots of the graphical interface. __________________________48 FIGURE 5-2 A child interacting with the tangible interface and the cleaned tooth. ______48 FIGURE 5-3The system setup. ______________________________________________49 FIGURE 5-4 System alignment and calibration. _________________________________49 FIGURE 5-5 Children from group A interacting with the tangible interface and children
from group B interacting with the graphical interface. _______________________53 FIGURE 5-6 Example of children’s drawings about the experience with the tangible
interface. __________________________________________________________61 FIGURE 5-7 Example of children’s drawings about the experience with the tangible
interface. __________________________________________________________61 FIGURE 5-8 A drawing showing the tooth with the germs and the cleaned tooth. ______62
FIGURE 5-9 Drawing from a child that interacted with the graphical interface. ________62 FIGURE 5-10 Drawing from a child that interacted with the graphical interface. _______63 FIGURE 5-11 Drawing from a child that interacted with the graphical interface. _______63 FIGURE 5-12 Children from group A and from group B drawing what they still
remembered. _______________________________________________________64 FIGURE 5-13 Drawing showing the graphical interface and elements of nature. _______67 FIGURE 5-14 Drawing showing the graphical interface and elements of nature. _______68 FIGURE 5-15 A drawing showing the tangible tooth (blue) and the family. ___________68 FIGURE 5-16 Example of children’s drawing showing themselves holding the brush. ___71 FIGURE 5-17 Example of children’s drawing showing themselves holding the brush. ___71 FIGURE 5-18 Example of children’s drawing showing themselves, the other children and
the surrounding scenery. ______________________________________________72 FIGURE 5-19 Example of children’s drawing showing themselves, the other children and
the surrounding scenery. ______________________________________________72 FIGURE 5-20 Example of children’s drawing showing themselves, the other children and
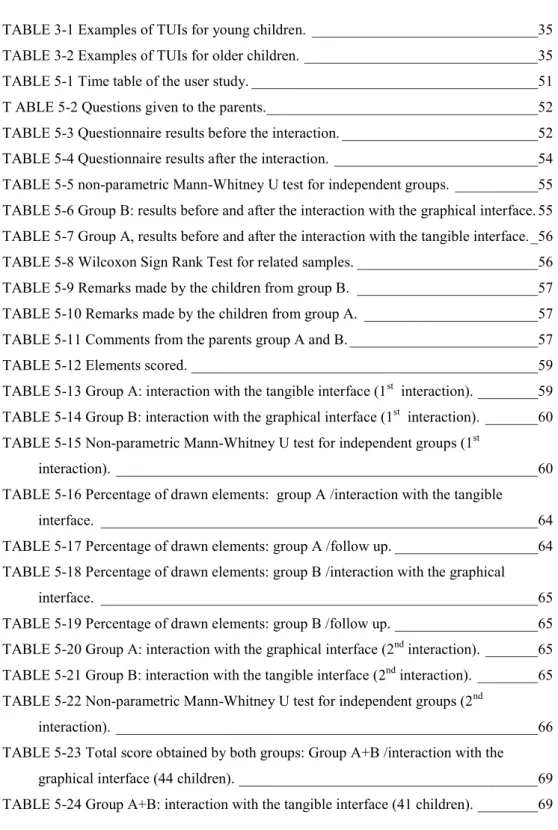
LIST OF TABLES
______________________________________________________________ TABLE 3-1 Examples of TUIs for young children. ______________________________35 TABLE 3-2 Examples of TUIs for older children. _______________________________35 TABLE 5-1 Time table of the user study. ______________________________________51 T ABLE 5-2 Questions given to the parents.____________________________________52 TABLE 5-3 Questionnaire results before the interaction. __________________________52 TABLE 5-4 Questionnaire results after the interaction. ___________________________54 TABLE 5-5 non-parametric Mann-Whitney U test for independent groups. ___________55 TABLE 5-6 Group B: results before and after the interaction with the graphical interface. 55 TABLE 5-7 Group A, results before and after the interaction with the tangible interface. _56 TABLE 5-8 Wilcoxon Sign Rank Test for related samples. ________________________56 TABLE 5-9 Remarks made by the children from group B. ________________________57 TABLE 5-10 Remarks made by the children from group A. _______________________57 TABLE 5-11 Comments from the parents group A and B. _________________________57 TABLE 5-12 Elements scored. ______________________________________________59 TABLE 5-13 Group A: interaction with the tangible interface (1st interaction). ________59 TABLE 5-14 Group B: interaction with the graphical interface (1st interaction). _______60 TABLE 5-15 Non-parametric Mann-Whitney U test for independent groups (1st
interaction). ________________________________________________________60 TABLE 5-16 Percentage of drawn elements: group A /interaction with the tangible
interface. __________________________________________________________64 TABLE 5-17 Percentage of drawn elements: group A /follow up. ___________________64 TABLE 5-18 Percentage of drawn elements: group B /interaction with the graphical
interface. __________________________________________________________65 TABLE 5-19 Percentage of drawn elements: group B /follow up. ___________________65 TABLE 5-20 Group A: interaction with the graphical interface (2nd interaction). _______65 TABLE 5-21 Group B: interaction with the tangible interface (2nd interaction). ________65 TABLE 5-22 Non-parametric Mann-Whitney U test for independent groups (2nd
interaction). ________________________________________________________66 TABLE 5-23 Total score obtained by both groups: Group A+B /interaction with the
graphical interface (44 children). ________________________________________69 TABLE 5-24 Group A+B: interaction with the tangible interface (41 children). ________69
CHAPTER 1
Introduction
1.1 MOTIVATION
____________________________________________________
Tangible interfaces, a new paradigm of interaction with digital information, free users from keyboards, mouse and displays; instead the users interact with physical objects as interfaces to computer systems and software. While this area has evolved as a field of research exploring a new paradigm in human-computer interaction, technology development and its low cost, has allowed the first steps in the integration of such technology in the process of education. This new systems are less machine-centered, instead more user and task-centered, thus offering new opportunities for different types of public to interact with digital contents, which is especially relevant for young children. The interaction with digital information through direct manipulation, allows children to simulate and create new experiences and perception of the world; thus providing children from an early age a more experimental, participatory, and active involvement with a wide range of learning contents.1.2 APPROACH
____________________________________________________
In the field of education, tangible interfaces open new opportunities for making abstract contents graspable and perhaps more understandable for children (Zuckerman, Arida and Resnick 2005). Numerous examples of tangible interfaces have been developed in recent years targeting the educational domain, despite those developments it is not clear their impact on learning when compared to educational software employing the traditional graphical user interfaces (Marshall 2007). In order to meet this issue we conducted a comparison study between a tangible and a graphical
Introduction
user interface, for teaching children about oral hygiene. The research was conducted with two groups of kindergarten children aged 4 to 5 years. To better understand the learning impact of the tangible interface we started by developing two similar interfaces one being a tangible and the other a graphical one, for teaching kindergarten children about good oral hygiene. Given that children at this age still lack the ability to clearly express their thoughts and impressions about their experiences, three different
methodologies were used for data collection and analysis. First children’s attitudes towards tooth brushing were assessed by asking their parents to answer a questionnaire. In order to evaluate if there were any changes in children’s attitudes towards tooth brushing, some weeks after the interaction with the interfaces the parents were asked again to fulfill a similar
questionnaire. Children’s drawings were used after the interaction to assess their degree of involvement with the interfaces and finally the children were interviewed about their preferences.
1.3 SUMMARY OF CONTRIBUITIONS
____________________________________________________
Usability studies with young children are still a wide research field.
Especially studies conducted with children between 4 and 5 years of age are infrequent, and most methods used with children are not suitable to assess children’s opinion at this age group. In addition, there are very few empirical studies comparing tangible and graphical interfaces (Fails et al. 2005), the study presented here intents to be a contribution in this area. Drawing Intervention, one of the methods used in this study, is an
innovative approach to young children’s technology evaluation that consists of asking the children to make a drawing of their experience after
interacting with the technology. It seems to be a promising method to work with pre-literate children. The Child Computer Interaction group (ChiCI group) also published studies applying this methodology, as far as we know, they were carried with children older than 4 years of age.
Introduction
The result of this research suggests that tangible interfaces provide children a richer and more involving experience than traditional graphical interfaces with consequent impact on learning.
1.4 THESIS ORGANISATION
____________________________________________________
The content of the remaining chapters are summarized below.
Chapter 2 presents Luquet’s Drawing Stage Theory, and Lowenfel’d Theory of Artistic Development, discussing how children’s development is reflected in their visual representations. That theory supports the development of the Drawing Intervention method used.
Chapter 3 discusses the use of educational interfaces and gives an overview of tangible educational interfaces developed for children.
Chapter 4 presents an overview of different usability methods used to access children’s opinions about technology.
Chapter 5 presents a comparative study between a GUI and a TUI for teaching children about oral hygiene.
CHAPTER 2
Drawing and cognitive development
Children’s drawings are frequently the result of combinations of different types of knowledge encoded in systems about which we still know little.
—— Matthews 2003:211-12.
2.1 INTRODUCTION
____________________________________________________
In this chapter we will discuss the pioneering work of Georges Luquet, his theory of children's Drawing Stages; Lowenfeld’s Stages in ArtisticDevelopment; as well as more recent research such as the work of Eduarda Coquet, and John Matthews. This discussion is relevant for the analysis of the drawings which is one of the evaluation methodologies used. The methodology will be presented later in Chapter 5.
The first studies of children's drawings were published in the last two decades of the 19th century. Georges - Henri Luquet is the author of one of the first and most influential works, whose theories still continue to
influence psychologists and educators today. Luquet’s (1927) extremely thorough and detailed longitudinal studies of children’s drawings were based on the analyses of over 1700 drawings made by his daughter Simone from the age of 3 years that he collected over a period of ten years.
Lowenfeld was a Viennese art educator; in 1938 he came to America, becoming prominent with the publication of Creative and Mental Growth (1947), which became an influential text book in American Art Education. His concepts are still influent, specially his visual-haptic theory (Smith 1989, Matthews 2003). In this work we will refer to the 6th edition of Creative and Mental Growth, an influential book where Lowenfeld’s theories were updated, including actualized research and its implications, at the time of the publication (Lowenfeld and Brittain 1975).
Drawing and Cognitive Development
Coquet has realized a detailed study on the forms of representation that children use to represent graphic narratives. In the whole her study analyses 1461 drawings from 4 to 11 years old children (Coquet 1995, 2005).
Matthews is an artist and an art educator. He realized longitudinal studies over a period of over 10 years of his children’s and latter his grandchildren’s drawings, as well as studies realized with English and Asian kindergarten children. His work provides valuable information about young children visual representations, taking in account psychomotor, aesthetic and cognitive aspects of drawing development.
2.2 THE STAGE THEORY
____________________________________________________
A central aspect of Luquet's work is the Stage Theory. These classification is closely related to Piaget’s stages of cognitive development1 (Piaget 1959), being an indicator of the overall development of the children, not only of their art.
Luquet (1927) considered four different drawing stages: Fortuitous Realism, from 2 to 4; Failed Realism, from 4 to 7; Intellectual Realism, from 7 to 9; and Visual Realism, beginning at 9 years of age.
The author considered that the boundaries between the different stages were not static and would vary from child to child.
Lowenfeld considered that there is a progression throughout children’s drawing development but it is difficult to say when one stage ends and the other begins. He identified six stages in artistic development: the Scribbling
Stage, from about 2 until 4; the Preschematic Stage, from 4 to 7; the
Schematic Stage from 7 to 9; the stage of Dawning Realism from about 9 to
12; the Pseudo-Naturalistic Stage, from 12 to 14 and the Period of
Decision during adolescence.
1 Piaget calls the first developmental stage the Sensory-motor stage, ranging from birth to two years of age, with
little or no capacity for symbolic representation; it follows the Preoperational stage that goes until about seven, characterized by the development of language, symbolic thought and self-centeredness. The stage of concrete operations goes from seven to eleven, in this period children can think logically but not abstractly. This is followed by the stage of Formal operations.
Drawing and Cognitive Development
Lowenfeld defines Stages as typical midpoints of child’s development,
fusing into one another as children reorganize their thinking competences
and develop new relationships with the world around them, indicating the general characteristics of the children at a certain period of their lives (Lowenfeld and Brittain 1975:50).
Matthews, on the other hand, defends that there are no stages in children’s drawing development; he sees it as a dynamic continuum process which undergoes transformations that are closed linked to co-operating,
perceptual, and motor systems.
Unlike the idea that the observation of the environment is reflected in the drawings, Matthews argues that children start to notice shapes in their environment because they first found them in their drawings. ―In a real sense, visual reality takes shape on the drawing surface.‖ (Matthews 2003: 109).
2.2.1 THE BEGINNING OF DRAWING
Children’s drawings are unique, personal, visual languages (Matthews 2003:152). At about two years of age and until four, children begin to experiment the materials and explore their body motion, making random marks on paper; with time children gradually gain control over their
scribbles and these become more and more organized. Lowenfeld calls this period Scribbling Stage. According to Luquet’s terminology it is the period of Fortuitous Realism, since he believed to be by accident that the children looking at their random marks noticed a resemblance to something real; for instance a circle would become a head. Matthews sees all children’s
mark-making as intentional, being the result of complex representational and
expressive modes; by watching the lines and shapes they have drawn children discover new ways of representation. With time this mark-making develops to marking strategies that although reflecting natural movements of children’s body, cannot be seen as just thoughtless, mechanical
Drawing and Cognitive Development
2.2.2 THE FIRST REPRESENTATIONS
The period, when children begin consciously to draw forms that have a relationship to their environment, marks the beginning of graphic
communication (Lowenfeld and Brittain 1975:155).
According to Lowenfeld’s terminology children’s second drawing stage is called the Preschematic; it starts at about four years of age and goes until around 7. We will present this stage in more detail, as it is the stage where the children addressed in our research are included.
It is during this period that children make the first attempts to represent their environment, consciously creating forms that have a relationship to the world around them; their drawings reflect how children perceive the reality. Lowenfeld sees drawing as a process that children use to signify and
reconstruct the world around them. This exploration of the environment has a strong sensory component. The way children represent things show how they understand them, and that changes with time as they become more aware of the world around them:
Perception means more than just the awareness of the visual appearance of objects; it includes the use of all the senses, such as kinesthetic or auditory experiences.
—— Lowenfeld and Brittain 1975:168.
The more involved the child becomes in the art activity, the more he identifies with what he is doing, the more he is actively using his senses, the more the project is really his own, the more meaning it has for him.
—— Lowenfeld and Brittain 1975:176.
Luquet called this period Failed Realism, since children’s representations in this stage do not correspond to the way objects look like in reality. This designation goes back to his differentiation between the way adults and children perceive the reality. Luquet speaks of adult and children realism. For the children realism means that the drawing contains all the elements of the object, even the invisible ones, he calls this form of representation
intellectual realism. For the adult, realism, means that the object is
represented in perspective and what is visible depends on the viewpoint, Luquet calls this visual realism.
Drawing and Cognitive Development
According to the author children’s intellectual realism is the result of an
internal model that they have of the objects they represent. Children do not
see the same details as an adult; they see them only to the extent that they interest them (Luquet 1927:94). Since children have a great power of abstraction, what does not matter for them is as if it would not exist; thus what children draw had a preponderant weight in their mind:
the represented object is one that at the moment of the representation occupied an exclusive or preponderant place in the mind of the drawer2.
—— Luquet 1927:17.
Children do not draw the details that they find unnecessary or secondary, but they tend to draw all the details even the invisible ones if they believe that these are essential for the representation of the object (for instance, the child draws the head underneath the hat) (Luquet 1927:98).
Matthews considers that children are not interested in realistic
representation, since it would interfere with their conception of the structure and characteristics of the object (Matthews 2003:97).
Lowenfeld shares the same view, unlike adults, children do not want to copy their environment, not for lack of ability but because they seem to be
satisfied with the way they represent these objects. Instead their drawings show the way children understand the world around them. What children draw at this age is always in relation to them, since at this stage they are very self-centered and understand the world in terms of themselves (Piaget 1959). This means that drawing is much more involving than a mere visual representation, the children themselves become involved in their drawings, being at the same time a spectator and an actor (Lowenfeld and Brittain 1975:51).
According to the authors the first representation is usually a human figure, apparently the representation of the child them self. This first
representations of the human figure is reduced to the head and legs; the head is where eating and speaking takes place (Lowenfeld and Brittain 1975:156)
it is where the sense of sight, hearing, and tasting are located3; the legs on
2Translated from the original by the author.
Drawing and Cognitive Development
the other hand allow locomotion, being a factor of gained independence (Coquet 1995:91). These first representations should not be seen as immature since they are an abstraction from complex stimuli and an
indicator of an ordered thought progress (Lowenfeld and Brittain 1975:157).
As children go older their drawings continue to change, according to their priorities. As already mentioned, we shall not dwell on these stages since they fall outside the scope of our investigation. We will just briefly
summarize their characteristics. According to the Stage theory by the age of 7 and until around 9 children enter the third stage, characterized by
intellectual realism in Luquet’s terminology. Lowenfeld calls this the Schematic stage; it is when children develop a definite form concept; using
their drawings in a descriptive way to represent the environment. At this stage the objects are represented in a row across the bottom of the page (Lowenfeld and Brittain 1975:48).
Luquet’s fourth and last stage from 9 years of age is called visual realism; it is when children are able to reach realistic representations of objects. Lowenfeld calls this stage Dawning Realism, going 9 nine to about 11 years of age. At this stage the drawings still symbolize more than represent the objects but they are more detailed and no longer placed in a row at the bottom of the page. Lowenfeld’s stages in artistic development include two additional stages: the Pseudo- naturalistic Stage, from 12 to 14; and the Period of decision during adolescence.
2.2.3 SPACE IN THE PRESCHEMATIC STAGE (4-7)
Children’s notion of space is very different from the one of an adult and that is reflected in children’s drawings. At this stage of development children are self-centered, they conceive space in relation to themselves and their own body, as of revolving around the child; they do not yet establish
relationships between the objects (Lowenfeld and Brittain1975:161). Children draw everything that is part of their experience, and what is open to their perception (Luquet 1927:15-16). The importance that children give to the details of a particular object often depends on the importance they
Drawing and Cognitive Development
attach to their role and their function (Luquet 1927:99); this importance given to the details determines the place that they have in the drawing:
the child does not see the same details as an adult: better, his eyes see them, but his mind only understands them to the extent that they interest him and in proportion to the importance that he attributes to them.
The relative importance given by the child to the different elements of an object determines the place that they occupy in his drawings4.
—— Luquet 1927:94.
Sometimes the exaggeration of a detail reflects the importance it has for the children. Children’s drawings are the result of their decisions about which information should go in their representations, and these priorities change with age and the context (Matthews 2003:162).
2.2.4 THE USE OF COLOUR IN THE PRESCHEMATIC STAGE (4-7)
According to Luquet, children can use color in a realistic way or completely random and that can occur separately or in the same draw.
Lowenfeld points out that the use of color often has little relationship with the drawn objects; it may be influenced by psychological reasons and
personal preferences. Children can choose their favorite color to color things or persons that they like, independently of the real color of the things they represent. The choice of a color can also have practical reasons, maybe the children choose the pencils that are better sharpened, or a new one, or they may prefer thicker pencils because they are easier to handle, and so on... Lawler and Lawler 5(1965) carried a study with kindergarten children of 4 years of age. The children choose yellow to color a happy picture, and they colored the same picture brown after having heard a sad story about it. Children’s psychological reasons and individual preferences make it difficult to interpret their color choices.
4Tranlated from the original by the author.
Drawing and Cognitive Development
2.3. DRAWING AS A NARRATIVE PROCESS
____________________________________________________
Luquet identified 3 distinct forms that children use to narrate an event through drawing: the Symbolic type, the Epinal type and the Successive type. In the Symbolic type the children draw a single moment from a story, the one that they probably consider the most important and it stands as a symbol of the entire story. This form of narrative is widely used among children, especially among children under 7 years of age. Children’s potential
retention of the narrative is very short, thus they represent only the action or the moment that most impressed them (Coquet 2000:36). Coquet calls this type of representation single image, although the child represents only a
single image she considers that it is not always symbolic (Coquet 2000:52).
The single image is defined by the author as any drawn image that relates a single moment of the narrative. This representation can be complete, including all elements and characters of a narrative moment. It can also be
synthetic, representing only certain elements or characters in a narrative
moment (Coquet 2000:54). In the single image:
the child clarifies, at once, the reader, about what seems to her to be the moment or the set of elements most important of the story to retain.
—— Coquet 2000:207.
The author concluded that most children under 7 years of age focus their representations at the initial moment of the story.
In the Epinal type, used by older children, the story is represented by several images each one corresponding to a different moment in the story.
In the Successive type the child brings together different moments of the story (Epinal) in a single drawing (Symbolic).
To conclude we can say that children’s drawings represent the way they understand the word around them; this is not just a visual process, but it includes all their senses. As we have seen children draw everything that is part of their experience and open to their perception. Children’s drawings are the result of a close connection between emotion and reality. Children do not draw what they see; instead they draw what they know that exists and
Drawing and Cognitive Development
want to transmit. The importance that children give to the different elements in their drawings has to do with personal and individual criteria that children mentally build, whereby affectivity and emotion are the main factors
(Coquet 1995).
Evaluation through drawing seems to be an appropriate method, to evaluate children’s experience with the interfaces. Drawings are much more than just a visual representation, the children themselves become involved in their drawings, being simultaneously a spectator and an actor (Lowenfeld and Brittain 1975). Given the previous points we can say that the drawings that children do after the interaction with the interfaces provide important information about the impact that the interfaces had on them. An
information that children would otherwise have difficulty in transmitting since, at this age, children are still not able to express themselves through writing, and they still have some limitations in expressing their thoughts through words.
CHAPTER 3
Physical educational interfaces
3.1 GIFTS AS A FIRST APPROACH TO TANGIBLE INTERFACES
____________________________________________________
The importance of using physical objects for the development of the child has been extensively studied. Papert (1980) calls for a new perspective in education research focused on creating the conditions under which intellectual models can take root.
One of the first innovative pedagogical approaches with manipulatives was carried by Friedrich Froebel who created the world´s first kindergarten 1837 in Germany. Froebel developed a collection of 20 physical objects, such as balls, strings, sticks and blocks, called gifts. The gifts allowed children to create forms which can be found in nature and in their daily lives and were used to help teaching arithmetic, geometry and reading (Brosterman 1997). Each gift was designed with the purpose of making the concept accessible and capable of being manipulated by the children.
Maria Montessori developed Froebel’s gifts and created materials for older children; based on that approach she develop a pedagogical teaching method called Montessori Method (Montessori 1912). This method, where
manipulatives play a central role, has inspired a network of schools spread over the world.
3.2 LEARNING WITH DIGITAL TANGIBLE INTERFACES
____________________________________________________
Tangible Interfaces, a new paradigm of interaction with digital information, employ physical objects, surfaces, and spaces as tangible embodiments of digital information (Ishii and Ullmer 1997). In an educational context they are also called Digital Manipulatives, a new generation of computationally enhanced manipulative materials that enable children to interact with digital
Physical educational interfaces
information(Resnick et al. 1998). In the following, both terms will be used referring to the same kind of interaction with digital information. Tangible interfaces pretend to be simple to use and facilitate the understanding of many complex processes. They go back to the notion of Froebel´s gifts taking advantage of the technology; allowing for richer experiences to be developed, expanding the range of concepts that children can understand and dramatically improving accessibility to younger children (Zuckerman, Arida and Resnick 2005). Resnick compares the interfaces developed by his research group, such as Mindstorms and Crickets, to Froebel's Gifts of the 21st century (Resnick 2007).
The pedagogical theories supporting the use of tangible interfaces are provided by a constructionist view of education. An approach supported by Seymour Papert (1980) who sees the child as a constructor. Learning is not a simple matter of transmitting information, but rather an active process, where children build knowledge through learning by doing and by direct, immediate and concrete experiences.
According to constructivism children need materials to explore the world around them in order to construct knowledge. Papert compares the children to builders that, like all builders, need materials for their mental
constructions. Therefore the vital importance of the learning tools, because children, as builders, do not build out of nothing. It is only by interacting with the objects that they build their knowledge, and it is this interaction that allows children to internalize knowledge. Papert refers many of the learning difficulties’ to the lack of suitable materials that make the concept simple and concrete and therefore meaningful.
One of the characteristics of tangible interfaces is precisely that they make abstract concepts concrete and simple; they promote team work,
communication and exchange of experiences, as well as stimulating sensory perception such as touch, sight and hearing, thus facilitating content
retention (Zuckerman, Arida and Resnick 2005). Traditional educational materials such as Cuisenaire Rods6 and Pattern Blocks are used in
6 Cuisenaire Rods, were named after his creator, George Cuisenaire (1891-1976), a Belgian primary school
teacher, and are used to teach mathematical and language concepts. The rods are wooden blocks of different size and color.
Physical educational interfaces
kindergartens to explore mathematical concepts such as number, size, and shape. Tangible interfaces, though, have the capacity to go behind these traditional materials allowing children to manipulate and to simulate; to develop hypotheses and experience them, thus creating experiences that cannot be shaped by wooden blocks.
At the same time, tangible interfaces bring together the tradition of games and playful activities commonly used in educational activities at
kindergarten with the new interactive technological solutions that promote a more experimental, participatory and active involvement; merging the best of computer pedagogic software and traditional learning materials. Resnick refers the importance of interacting with the right materials, which promotes a creative thinking spiral; by doing so children:
imagine what they want to do, create a project based on their ideas, play with their creations, share their ideas and creations with others, and reflect on their experiences.
—— Resnick 2007.
A process that prepares children for the Creative Society, where people
continuously need to discover new creative solutions to solve unexpected problems, where knowledge alone is no longer enough (Resnick 2007). Based on these ideas there has been in the past two decades a growing interest in developing tangible interfaces to support children education, in that context also known as digital manipulatives (Resnick et al. 1998). Groups like the Lifelong Kindergarten7 at MIT Media Laboratory or the MIT Tangible Media Group8, among others, have developed a series of tangible interfaces for children.
Inspired by Froebel and Montessori, Zuckerman (2005) proposes the following classification for manipulatives: Froebel-inspired Manipulatives (FiMs), manipulatives that enable modeling of objects and structures of the real world; and Montessori-inspired Manipulatives (MiMs) that enable
7 http://llk.media.mit.edu/ 8 http://tangible.media.mit.edu/
Physical educational interfaces
modeling of abstract concepts such as the representation of numerical proportions, and relationships between quantities.
Marshall (2007) gives a good overview about what has been done in the area of learning with tangible interfaces providing an analytic framework of six perspectives: typical learning domains, learning activity, integration of representations, concreteness and sensory-directness, effects of physicality and possible learning benefits. Although he questions that many tangible interfaces offer more cognitive advantages for learning over traditional graphical interfaces he admits that exploratory and expressive activities might be particularly well supported by tangible interfaces. Through an exploratory process of discovery the learners interact with an existing model of the world trying to understand the underlying mechanisms; whereby the model can reflect the learners own experiences and his existing level of
understanding, or in the other hand conflict with it, which can lead to a
process of reflection and consequent learning. In expressive activities the learners can give physical form and materialize their ideas thus making them concrete and clear having the possibility of reflecting upon how accurate their models are in their representation by comparing them to the real world (Marshall 2007).
3.2.1 EXAMPLES OF EDUCATIONAL TANGIBLE INTERFACES Topobo (Raffle, Parkes and Ishii 2004) is an example for expressive learning (fig. 3-1). It is a 3D building system with kinetic memory able to record and play physical movements. The physical input and output of the movement is made in real time. Topobo combines passive and active
components, which can be fit together to form models of animals, geometric or abstract shapes. It allows children to build their toys and associate them with movements that they then play. Children can compare the movements of their constructions with their own movements or from various animals, making it easier for children from the age of 4-5 years old to learn concepts of movement and locomotion. Topobo is already being commercialized.
Physical educational interfaces
FIGURE 3-1 The Topobo system and an animal built with Topobo, reproduced from (Raffle, Parkes and Ishii 2004).
In 2006 the same researchers from the MIT Tangible Media Group (Raffle,
Yip and Ishii 2006) developed Robot Topobo a controller that allows users to store and reproduce up to four recordings created with Topobo, which can then be played using a joystick controller. The system allows reversing the sequence of movements, change the speed and its extent.
One of the first TUIs developed for young children, from 4 years of age, was Curlybot (Frei et al.2000) (fig. 3-2), an autonomous two-wheeled vehicle with embedded electronics that can record the way it is moved on a flat surface and afterwards play that movement in an absolutely accurate mode and repeatedly. The interface is very simple allowing children to create complex movements, whereby they learn concepts of movement, space and repetition as well as about points of origin, direction and magnitude.
Physical educational interfaces
A domain that has also been addressed by tangible interfaces is the
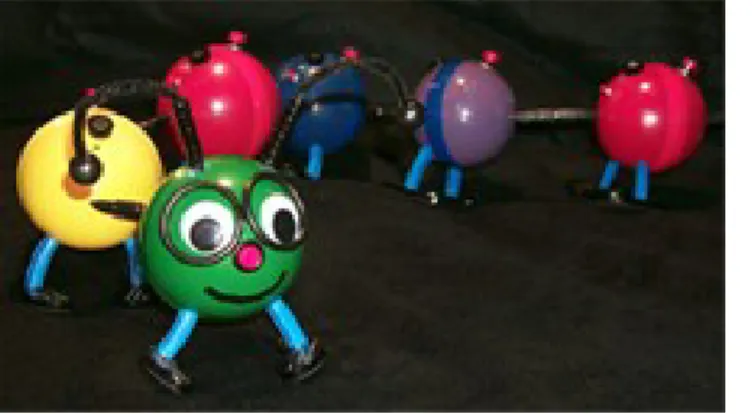
narrative. TellTale (Ananny 2001) (fig. 3-3) is an example of a collaborative interface that aims to support the language development by encouraging children, through storytelling, to develop oral language skills that are important for the development of literacy. It gives children control over the structure and content of their verbal exteriorization. The interface resembles a worm with the body consisting of five pieces and a colored head. Children can record audio into each part of the body, and hear it by pressing a button. The pieces are independent of each other, can be randomly sorted and rearranged, or a new story can be created at any time. TellTalle can be used by one or several children simultaneously, allowing a group experience that can be very motivating for the development of the language.
FIGURE 3-3 TellTale Prototype, reproduced from (Ananny 2001).
Another interface that targets the narrative domain is the Jabberstamp (Raffle et al. 2007) (fig. 3-4), an interactive tangible interface that aims to help developing children's literacy by enhancing their creativity, the ability to develop stories, and capacity of communication. The interface allows children, from the age of 4 and older to add sounds and voices to their drawings. To use the Jabberstamp children make drawings, collages or paintings on normal paper, placed on a Wacom tablet9; by pressing a special rubber stamp on the sheet they can record sounds in their drawings. Using a small trumpet, a device created by the authors, children can hear the stories they created. The authors found that children integrated direct speech (speech of the characters), indirect speech (presentation of the characters),
9http://www.wacom.com/index.html
Physical educational interfaces
provided additional contextual information (narrator), besides enriching their stories with ambient sounds and sounds they created and invented.
FIGURE 3-4 Children creating an interactive story with Jabberstamp, reproduced from (Raffle et al. 2007).
An example of a Tangible Interface to promote children’s creativity is the I/O brush (Ryokai, Marti and Ishii 2004) (fig. 3-5), a brush that allows children from 4 years of age to explore colors, textures and materials from their daily life. Like a brush it captures patterns of the world allowing children to paint with them. The I/O brush has the appearance of a physical paintbrush but has a small webcam embedded with light and touch sensors. It allows children to take samples of color, textures or patterns, which are present in their personal objects and their environment and use these elements to create their own paintings.
FIGURE 3-5 Exploring different patterns of an object (Ryokai, Marti and Ishii 2004), reproduced from http://web.media.mit.edu/~kimiko/iobrush/).
Several other educational tangible interfaces have been developed for primary school children and older; we will shortly refer some of these interfaces.
Physical educational interfaces
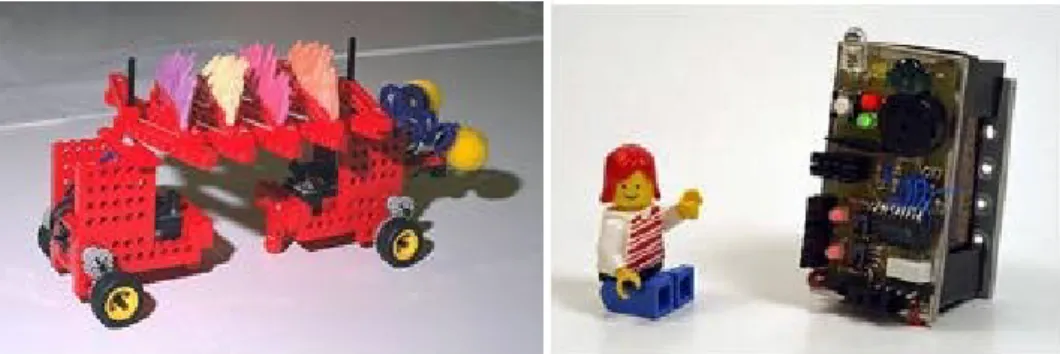
A group well known for his work in this area is the Lifelong Kindergarten group at MIT. The group developed a family of programmable bricks, which led to the development of the ―LEGO Mindstorms‖ product, a robotic construction kit. Crickets (Resnick et al. 1998) (fig. 3-6) are a more recent version in the programmable bricks family. They are small Programmable Bricks, containing a Microchip PIC processor and are capable of two-way infrared communications. Children can use Crickets to create robotic constructions that interact with one another. This helps children learning general communication principles. Crickets have been used with
elementary-school children, as a mean of incentivizing them to science activities.
FIGURE 3-6 Robotic construction with two built-in Crickets, which communicate with one another to synchronize their motion, reproduced from (Resnick et al. 1998).
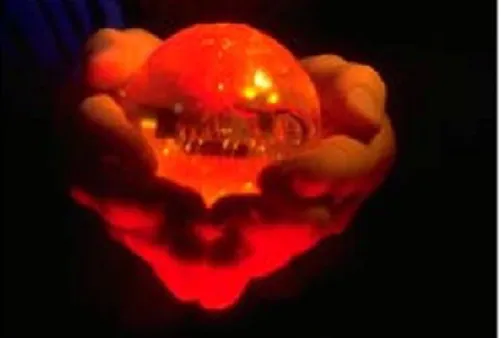
The BitBall (Resnick et al. 1998) (fig. 3-7) is a transparent, rubbery ball with a Cricket, an accelerometer, and colored LEDs embedded inside. It can be programmed by children to change its lights according to acceleration or deceleration. For instance children can program the BitBall on a computer, to turn on its LEDs based on its motion; or to flash its light according to its acceleration or deceleration, or the Ball can begin to flash if there is no acceleration. The Cricket allows the BitBall to receive infrared signals. Thus children can than send their program to the BitBall via infrared, as well program them to communicate with other electronic devices. BitBalls can also be used to store data such as acceleration. The handle of the ball can lead to deeper understanding of kinematics.
Physical educational interfaces
FIGURE 3-7 The BitBall, reproduced from (Resnick et al. 1998).
Programmable Beads (Resnick et al. 1998) (fig. 3-8) are used to create dynamic patterns. Each Programmable Bead has a microprocessor and a LED, it communicates with the neighboring beads by inductive coupling. Depending how they are combined the Beads produce different dynamic patterns of light.
FIGURE 3-8 A necklace of Programmable Beads, reproduced from (Resnick et al. 1998).
Beginners can create their necklaces by stringing together pre-programmed beads and observe the dynamic patterns that arise from the interactions. More advanced users can write new programs and download them into the Beads. Beads can help children exploring and understanding probabilistic behaviors.
System Blocks (Zuckerman 2004) (fig. 3-9) is a physical interface that children can explore to learn about dynamic systems. It is composed by a set of computationally enhanced blocks with embedded electronics. System Blocks can be used to learn complex concepts of system dynamics and causalities. These concepts include stocks and flows, linear dynamics, and positive feedback (Zuckerman 2004). It can be used with 5th and 6th graders.
Physical educational interfaces
FIGURE 3-9 System Blocks simulating water flow through a bathtub, reproduced from (Zuckerman 2004).
Thinking Tags (Resnick et al. 1998) (fig. 3-10) were inspired in traditional badges, through embedded electronics they can communicate via infrared with one another and change its displays according to those
communications. Thinking Tags have been used in educational applications with pre-college students, especially by engaging students in playing simulations. For example, Thinking Tags were used to simulate the spread of an epidemic disease, with an electronic virus jumping from one student's Thinking Tag to another. Students were challenged to develop theories to explain the spread of the virus.
Physical educational interfaces
Table (3-1) presents an overview of some educational tangible interfaces that address children from 4 years of age.
TABLE 3-1 Examples of TUIs for young children.
TUI Learning domains
Topobo Concepts of movement and locomotion
Curlybot Concepts of movement, space and repetition as well as points of origin, direction and magnitude.
TellTale Children’s literacy, creativity, ability to develop stories, and capacity of communication, language development.
Jabberstamp Children’s literacy, creativity, ability to develop stories, and capacity of communication, language development.
I/O brush Exploration of colors, textures and materials.
Table (3-2) presents some examples of educational tangible interfaces that address older children.
TABLE 3-2 Examples of TUIs for older children.
TUI Learning domains
Crickets General communication principles, development of science activities. BitBall Deeper understanding of kinematics.
Beads Exploration and understanding of probabilistic behaviors. Thinking
Tags Social network simulations System
Blocks
CHAPTER 4
Evaluating technology for and with young children
4.1 HISTORICAL OVERVIEW
____________________________________________________
In parallel with the development of new interfaces for children, there has been, in the last 12 years, a growing interest on the evaluation of interactive technology for children. Special emphasis is given to the work of Hanna, Risden and Alexander (1997). Despite the growing interest in this field, most evaluation studies of the benefits of tangible interfaces for learning are rather informal (Marshall 2007) and there are very few empirical studies comparing tangible and graphical interfaces. One of these studies was carried by Fails et al. (2005) with children aged 4 to 5 years old comparing a tangible and a graphical version of a Hazard Room Game that teaches children about environmental health dangers. The results of the study suggest that the physicality of the tangible interface has advantages over the graphical interface in terms of learning outcomes.
Jensen and Skov (2005) conducted an extensive survey of research methods in paper publications, reviewing 150 papers on children’s technology design; their results show a strong focus on engineering of products and on evaluation of developed products; they also found out that most research is conducted in natural setting environments with strong focus on field studies. The evaluation methodology with children 4 to 5 years old, poses some additional challenges given their limited ability of verbal or written expression. In addition the majority of assessment methods are generally suitable for use with older children. For a good overview of evaluation methods used with children, see Markopoulos, Read, Macfarlane and Höysniemi (2008).
In the next section we will discuss some of the evaluation methods that have been used with children.
Evaluating technology for and with young children
4.1.1 THE VISUAL ANALOGUE SCALE
One of the methods that have been adapted for children is the Visual
Analogue Scale (VAS), a psychometric response scale which can be used to measure the level of agreement with a statement by indicating a position along a continuous line between two end-points. Wong and Baker adapted the (VAS) creating the Wong-Baker FACES Pain Rating Scale (fig. 4-1), a visual analogue scale to access pain in children. The scale presents a series of faces ranging from sad to happy. It was originally developed to evaluate children’s pain, due to the difficulties of young children in understanding how to use a traditional scale.
FIGURE 4-1The Wong-Baker FACES Pain Rating Scale, reproduced from (Wong on Web Archive). The scale is extensively used in research and clinical practice with children for the assessment of pain and it has also been used to rate preference and other feelings.
Some researchers find the scale appropriate to be used with children older than 7 (Shields et al. 2003). Other researchers, nevertheless, think that it can be used with younger children, although if children are evaluating software or hardware products younger children tend to choose the highest score (Read MacFarlane and Casey 2002).
4.1.2 THE STICKY-LADDER RATING SCALE
In a study on children’s use of electronic toys and related software, Airey et al. (2002) developed a scale (fig. 4-2), to be used with children 4 to 6 years old. The scale consists of a tangible object that children can handle to express their opinions, by sticking the objects to a Velcro ladder, according
Evaluating technology for and with young children
FIGURE 4-2 The sticky-ladder rating scale, reproduced from (Airey et al. 2002).
The method was found suitable for that age rank since children did not have to deal with difficult vocabulary or instructions; however the authors claim that further research has still to be done to validate the method.
4.1.3 THE FUN TOOLKIT
Janet Read and Stuart MacFarlane have extensively investigated the measurement of the fun component as a method of evaluating children’s preferences. They defined three dimensions of fun: Expectations,
Engagement, and Endurability (Read and MacFarlane 2000). The Fun Toolkit is a set of tools by Read, MacFarlane and Casey (2002) specially designed to measure children’s opinions about technology. The Toolkit is composed of four tools: a Funometer, a Smileyometer, a Fun Sorter, and an Again-Again table. The tools are intended to be very simple and clear using pictures and only essential vocabulary.
The Funometer (fig. 4-3) is a variation of a tool developed by Risdan, Hanna and Kanerva (1997) consisting of a vertical scale with a smiley face on the top and a sad one on the bottom joined together by a vertical ruler. Children can draw a vertical line inside the ruler showing the amount of fun they had. The Funometer can be used even by very young children 3 and 4 years old (Markopoulos et al. 2008); but it seems to be more useful to be used with older children (Read, MacFarlane and Casey 2002).
Evaluating technology for and with young children
FIGURE 4-3 The Funometer – before and after completion, reproduced from (Read, MacFarlane, and Casey 2002).
The Smileyometer (fig. 4-4), a Likert type scale adopted for children, is a variation of the Funometer designed with the participation of children; it has five faces that go from awful to brilliant. Children mark the face that better suites their preference; since the faces are labeled, the Smileyometer gives extra information when used with children that can read.
FIGURE 4-4 The smileyometer, reproduced from (Read, MacFarlane, and Casey 2002).
Research on the Funometer (Read MacFarlane and Casey 2002,
MacFarlane, Sim and Horton 2005, Read and MacFarlane 2006) showed
that the Smileyometer is of limited value when used alone with very young children as they tend to choose the highest score. Kam (2007) in a study evaluating mobile gaming with children in Indian, aged 6 to 7 years old, found out that children tended to always pick brilliant and very good, because these emoticons were esthetically more appealing to them than frowns.
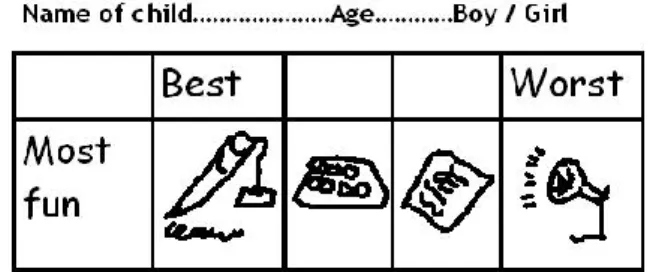
The Fun Sorter (fig. 4-5) is used to measure different types of things, such as fun, likes and dislikes or grade of difficulty. The tool consists of a grid with activities or things to be rated. Children are asked to rank these in order to their preferences. The Fun Sorter seems to work better when comparing a small numbers of activities. This method can also be used with younger
Evaluating technology for and with young children
children, if only one construct is used and picture cards instead of words.
Older children can write their preferences. Very important is that the children understand what they shall evaluate, thus being necessary to use simple words (Read, MacFarlane and Casey 2002).
FIGURE 4-5 A completed Fun Sorter with only one construct, reproduced from (Read and MacFarlane 2006).
The Again-Again table (fig. 4-6) can be used to measure endurability, based on the Pollyanna principle that people are more likely to remember things that they liked to do, and the belief that people would like to do things again that were fun (Read, MacFarlane and Casey 2002).
The table consists of a grid with the activities listed on the left, and it has three columns on the right. Children mark their answers to the question
would you like to do it again? in different columns with yes, maybe and no
according to their opinion.
Evaluating technology for and with young children
4.1.4 THE THINK ALOUD METHOD
Other usability testing methods such as the Think Aloud method, where children verbalize their thoughts while interacting with a product, are appropriated to be used with children 8 to 14 years old. Younger children may have difficulties in expressing themselves clearly through words (Donker and Markopoulos 2002). Donker and Markopoulos (2002) found out that children have difficulty, or don’t like to speak while exploring the technology. They had to be constantly encouraged in order to keep
verbalizing their thoughts; however by thinking aloud children provide much more relevant information about their interaction than if they are asked specific questions.
Children’s capacity of verbalizing their thoughts depends not only on their language skills but also on children’s experience in talking to adults; on the other hand, as logical reasoning and abstract thinking are not yet fully developed in children, they might have difficulties doing multiple tasks and abstract task formulations (Markopoulos and Bekker 2002), and this is specially truth for children 4 to 5 years old.
4.1.5 THE TALK ALOUD METHOD
Talk Aloud (Donker and Reitsma 2004) is a variation of the Think Aloud method where children are instructed but not prompted to talk about what they are doing during their interaction. In a study carried with kindergarten children 6 to 7 years old, the authors found the children very quiet, even though they had been asked to verbalize their thoughts. Nonetheless the few comments that children made were very useful, identifying important problems about the software, and giving opinions about the design.
4.1.6 PEER TUTORING
One method specially designed to assess children’s opinions is the Peer Tutoring method (Höysniemi, Hamalainen and Turkki 2002) whereby one child teaches another how to use a product. This test undergoes two phases, first the tutor child becomes familiar with the product and learns how to use it, and then in a second session, the tutor teaches a tutee child how to use it. The method allows checking to what extent the child giving the instructions
Evaluating technology for and with young children
understood the functioning of the product and is able to convey it to his peer.
van Kesteren et al. (2003) carried a study about children's ability to provide verbal comments in usability evaluation sessions applying six evaluation methods to test an interactive toy with children aged 6 and 7 years old. They concluded that children are able to verbalize their thoughts during usability evaluation, but the results depend on the method used and on children’s personality. The most comments were provided using the Active
Intervention method, where children are asked questions while interacting with the technology, the Think Aloud method showed that children were able to provide useful comments during their intervention and managed to explain their peer the functioning of the tested product when using Peer Tutoring.
4.1.7 DRAWING INTERVENTION
Making drawings gives young children opportunities to represent intricate personal narratives and use them to communicate with significant others in their lives.
—— Anning and Ring 2004:116.
A new evaluation method is Drawing Intervention (Xu, Mazzone, and MacFarlane 2006, Xu, Read and Sheehan 2008, Xu et al. 2009). Drawing is one of the essential activities undertaken at kindergarten, it is often used as a method to appraise the degree of what children have learned after a
particular activity, and it has shown to be useful and generally worthy of credibility (Coquet 2000). Drawing allows children to represent their thoughts, feelings and interpretation of their lived or imagined experiences. Children retain visual elements and details that they are able to draw; however, they may have greater difficulties if they have to describe these elements in spoken or written words. Despite the difficulty in evaluating drawings they may give important additional knowledge about children, complementing other quantitative and qualitative data thus providing a method of self expression that verbal measures may not allow (Malkiewicz 1994).