Vol.56, n.2: pp. 213-221, March-April 2013
ISSN 1516-8913 Printed in Brazil BRAZILIAN ARCHIVES OF BIOLOGY AND TECHNOLOGY A N I N T E R N A T I O N A L J O U R N A L
Analysis of Seven STR Human
loci
for Paternity Testing by
Microchip Electrophoresis
Karina Fraige
1, Regiane Fátima Travensolo
1and Emanuel Carrilho
1,2*1Instituto de Química de São Carlos; Universidade de São Paulo; São Carlos - SP - Brasil. 2Instituto Nacional de
Ciência e Tecnologia de Bioanalítica; Campinas - SP - Brasil
ABSTRACT
The aim of this work was to evaluate two paternity cases by microchip electrophoresis and the validation of the methodology by comparison of the results with those obtained in a commercial genetic analyzer. It was observed that when working with tetranucleotide regions, in which the minimal difference between the alleles was only four base pairs, the commercial microchip system did not present the resolution and repeatability needed. Nevertheless, the relative standard deviation was between 0 and 1.2% and the fragments detected were within the expected size ranges as described in the literature.
Key words: Bioanalyzer 2100, paternity testing, polymerase chain reaction, short tandem repeats
*Author for correspondence: [email protected]
INTRODUCTION
Paternity testing by DNA analysis is one of the 20th century’s most notable advances in the forensic area. The application of DNA typing is increasing in medical laboratories, and one of the most widely used technique is the polymerase chain reaction (PCR) analysis of short tandem repeat (STR) loci (Alford et al. 1994; Sacchetti et al. 1999). The STR loci are polymorphic markers consisting of a variable number of tandem repeats ranging from two to six nucleotides, which are easily amplified by the PCR. They offer a number of advantages over previously used methods, including the ability to obtain results from the degraded samples and extremely small amounts of DNA. Thirteen STR markers were selected in November 1997 to form the core of FBI Laboratory´s Combined DNA Index System (CODIS). They are CSF1PO, FGA, TH01, TPOX, VWA, D3S1358, D5S818, D7S820, D8S1179,
D13S317, D16S539, D18S51 and D21S11 loci from the human genome (Butler, 2001).
equipment was evaluated for the paternity test. Consistent results were obtained with respect to the sizing and signal quantification on a well-to-well, chip-to-chip, and day-to-day basis, using the PCR fragments and commercially available plasmid digests. Four protocols were used to load the chip wells, with minor modifications of the manufacturer’s recommendations. With both, the purified and unpurified PCR products, the relative standard deviation (RSD) for signal quantification was 4.0 – 5.4% and for the sizing results, these were lower than 1% for all the chips, with no results differing from the expected size by more than nine base pair (bp). The cross-contamination between the wells was investigated and no contamination was observed. The ability of sizing the samples with multiple DNA fragments was evaluated by the analysis of commercial plasmid digests, with the RSD for sizing the fragments ranging from ≤2.1 – 8.0% and for DNA sizing quantification from ≤6.7 – 7.0%. This system was capable of substituting the conventional CE in sizing and quantification of DNA fragments in many samples (Panaro et al. 2000).
A qualitative method of genotyping involved using the Agilent 2100 Bioanalyzer for the separation of PCR products amplified from STR loci selected from the tetrameric CODIS STR loci and the method was applied to paternity tests. The results were validated in a capillary electrophoresis system and were in agreement in all the cases. This instrument is a rapid and inexpensive alternative for analysis of STR PCR products in comparative analysis, due to the high level of reproducibility of intra-chip and inter-chip sizes; absolute allele identification, however, was not achieved because the resolution of the system was 5 bp. The method worked well for the uniplex and multiplex systems, but failed in discriminate tetrameric CSF1PO alleles in which the products were greater than 300 bp, suggesting that this locus was less informative for genotyping on the Bioanalyzer because its size range was not within the more selective range of the instrument. It was concluded that the Bioanalyzer was appropriate for the application in small sets of forensic samples, but a large number of them would be more appropriately analyzed by the CE because of the multiplexed reactions and increased sample capacity (Kupfer et al. 2006).
In this work, the amplification of the DNA by PCR was studied with seven sets of primers corresponding to seven standardized and legally
accepted regions in paternity tests (D21S11, Penta E, D18S51, TH01, CSF1PO, D7S820 and D13S317). The extraction of DNA and conditions of PCR reactions were optimized with monitoring by the slab gel electrophoresis. Two paternity cases were evaluated by the microchip electrophoresis in an Agilent 2100 Bioanalyzer with the validation of the method carried out by comparing the results with those from a commercial sequencer (MegaBACE™ 500 Genetic Analyzer).
MATERIALS AND METHODS
Sampling
Saliva samples are a potentially useful source of genomic DNA for genetic studies and can be collected in a painless and non-invasive manner (Ng et al. 2004). Because of this convenience, saliva was used instead of blood for optimization of DNA extraction and PCR conditions. The samples were obtained from four individuals. Prior to obtaining the samples, the mouth of each individual was rinsed with filtered water for about 10 s and the water was discarded. After 5 min, the saliva that accumulated in each individual’s mouth was collected in sterile polypropylene tubes that were stored at -20 °C until DNA extraction. The DNA were obtained from the blood samples in two paternity cases as a donation from the DNA Consult (São Carlos, SP, Brazil), a certified paternity laboratory for case-study comparison.
DNA extraction
transferred to a new tube with an equal volume of absolute ethanol (-20 °C), and 80 µL of 3 M sodium acetate buffer (pH 5.96) were added to precipitate the DNA. The tubes were stored at -20 °C for 5 h. After centrifugation at 12,000 × g and 4 °C for 10 min, the supernatant was discarded and 50 µL sterile water was added to resuspend the pellet. The extraction process was repeated, the pellet was dried in a vacuum centrifuge (Centrivap Concentrator, Labconco Corp.) at 35 °C for 10 min, re-suspended in 80 µL of sterile water and quantified in an UV-Vis
U-2800 spectrophotometer (Hitachi) at 260 nm. The DNA from blood was extracted by DNA Consult personnel with Brazol (LGC Biotecnologia) according to the protocol from the manufacturer.
Amplification of STR loci
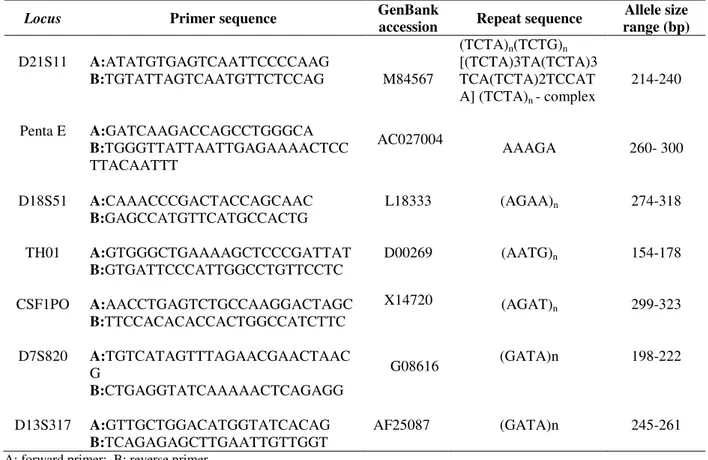
Primers were synthesized by the Erviegas Instrumental Cirúrgico Ltda, according to the sequences described in the literature. The studied loci and their primer sequences are listed in Table 1.
Table 1 - Characteristics of the studied loci: primer sequences, GenBank accession number, repeat sequence, allele sizes.
Locus Primer sequence GenBank
accession Repeat sequence
Allele size range (bp)
D21S11 A:ATATGTGAGTCAATTCCCCAAG
B:TGTATTAGTCAATGTTCTCCAG M84567
(TCTA)n(TCTG)n
[(TCTA)3TA(TCTA)3 TCA(TCTA)2TCCAT A] (TCTA)n - complex
214-240
Penta E A:GATCAAGACCAGCCTGGGCA
B:TGGGTTATTAATTGAGAAAACTCC TTACAATTT
AC027004
AAAGA 260- 300
D18S51 A:CAAACCCGACTACCAGCAAC
B:GAGCCATGTTCATGCCACTG
L18333 (AGAA)n 274-318
TH01 A:GTGGGCTGAAAAGCTCCCGATTAT
B:GTGATTCCCATTGGCCTGTTCCTC
D00269 (AATG)n 154-178
CSF1PO A:AACCTGAGTCTGCCAAGGACTAGC
B:TTCCACACACCACTGGCCATCTTC
X14720 (AGAT)n 299-323
D7S820 A:TGTCATAGTTTAGAACGAACTAAC G
B:CTGAGGTATCAAAAACTCAGAGG
G08616 (GATA)n 198-222
D13S317 A:GTTGCTGGACATGGTATCACAG
B:TCAGAGAGCTTGAATTGTTGGT
AF25087 (GATA)n 245-261
A: forward primer; B: reverse primer
Six of them were from the 13 CODIS core STR loci and one, Penta E, was discovered and characterized by the Promega scientists in an effort to find a locus with high variability and a low amount of stutter product formation (Bacher and Schumm 1998; Schumm and Bacher 2001) and although not officially required, it has been widely used in the commercial STR kits.
Preliminary testing was performed to optimize the reactions for the primers and template concentration. The conditions selected for the
95 °C for 10 min, 94 °C for 1 min, optimized annealing temperature for each primer pair for 1 min, 72 °C for 1 min for 34 cycles, with a final extension at 72 °C for 30 min.
The amplifications of K562 control DNA (Promega) were made with each primer according to the optimized PCR protocol. All the products were analyzed by electrophoresis in 2% (w/v) agarose gel in 1 × TAE buffer containing 0.5
µg/mL ethidium bromide for the quality control. The sizes of the amplicons were compared with a 25 bp DNA ladder (Invitrogen). The fragments obtained with the best conditions were analyzed in microchip electrophoresis in the Bioanalyzer 2100 (Agilent Technologies).
Microchip and capillary electrophoresis
The analysis of a 1-µL aliquot of each amplification product was performed by the microchip electrophorersis, in a 2100 Bioanalyzer using Agilent biosizing™ software (Version A.02.12) and DNA 1000 Labchip™ kits (Agilent Technologies). This equipment sizes and quantifies 12 samples on a disposable microchip in approximately 30 min. Each glass microchip held 16 wells: three for loading the gel-dye mixture, 12 for the samples and one for a molecular size ladder (Panaro et al. 2000; Funnes-Huacca et al. 2004). The gel-dye mixture consists of a linear polymer and a fluorescent intercalating dye. The marker mixture consists of a buffer with lower and upper molecular size markers, which the software uses as reference for sizing the fragments (Funnes-Huacca et al. 2004). The chips were prepared according to the manufacturer’s instructions: the microchannels were filled pipetting 9 µL of the gel-dye mixture into the appropriate well and then pressure was applied. Two additional wells were filled with 9 µL gel-dye mixture. The sample and ladder wells were filled with 5 µL marker mixture before adding 1 µL of DNA ladder or sample to the their wells. The chip was vortexed and placed in the equipment for the analysis. The Bioanalyzer displays data as both the migration time plots and virtual gels are generated by the computer. The temperature, voltage, pH and buffer properties were automatically set by the instrument and were not varied. The repeatability of sizing each fragment from different wells was evaluated using a 25 bp DNA ladder (Invitrogen), and each sample was analyzed in triplicate. The results were compared with those resulting from the capillary electrophoresis, supplied by the certified
laboratory, which was performed in a MegaBACE™ 500 Genetic Analyzer (GE Healthcare). The amplification and labeling of the PCR products for capillary electrophoresis were done using the PowerPlex™ 16 System (Promega). The analyses were made according to the manufacturer’s method and the data were treated by the MegaBACE Genetic Profiler™ software, which indicated the size of each fragment and the corresponding allele. Both the methods, i.e., the primer system and the certified method produced the fragments of different sizes because the primer sequences of the PowerPlex™ 16 System were not the same as the primers used. The sizes were, however in accordance with those found in the literature based on the position of priming.
RESULTS AND DISCUSSION
Optimization of PCR conditions
The phenol-chloroform method used for the extraction of DNA from the saliva yielded the samples with high purity and concentrations, although some modifications of the original protocol, such as reduction in incubation times, were required. Each extraction was performed in duplicates.
PCR is currently recognized as a method of choice for the paternity testing because it requires small amounts of starting DNA template, is highly reproducible, and is relatively insensitive to the degradation for the amplicon sizes. PCR, thus, provides a reliable and independent method to confirm the identification of the sample (Kupfer et al. 2006). The conditions for the PCR were optimized using the DNA from the saliva samples, and the same conditions were applied to the DNA extracted from the blood samples, supplied by a certified paternity laboratory, yielding the same results, i.e., i) good quality of DNA extracted, and ii) optimized PCR cycling conditions.
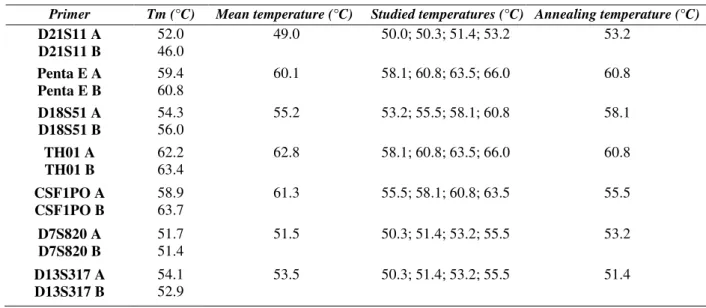
influences the specificity (template sequence) and stability of DNA-DNA hydrogen bonds. Four temperatures around these values were studied as presented in Table 2, which was possible because
of the use of a temperature gradient thermocycler. The conditions were evaluated in agarose gel electrophoresis prior to the analysis in the Bioanalyzer (data not shown).
Table 2 - Melting and annealing temperatures used for each primer pair.
All the temperatures tested provided an amplification of DNA for all the primers in this study. The annealing temperatures were chosen so that no (or minimal) bands of primer-dimmer were present, or the amplification yielded were pure bands. At lower temperatures, the formation of dimmers could be observed for D21S11 and D18S51. For Penta E, the separation of the fragments into two bands was observed. The same was observed for the CSF1PO at 55.5 °C, a fact not observed at lower temperatures and typical of heterozygote individuals. The comparison of the 25 bp DNA ladder with the produced amplicons indicated that the sizes of these PCR products were in accordance with the expected values.
Microchip electrophoresis
An Agilent 2100 Bioanalyzer was used for the electrophoresis and analysis of the PCR samples as a less expensive and faster alternative to the capillary electrophoresis genetic analyzer systems used in the paternity testing. In this study, the performance of the instrument to separate six tetranucleotide STR PCR products and one pentanucleotide PCR product (all without any purification process before the analysis) was tested. The kit used in this study was the DNA 1000 Labchip™ because of its 15 – 1500 bp range,
the minimum available for the manufacturer, was suitable for the PCR fragments. However, the certified resolution was five basepairs, when at least four should be desirable because of the tetrameric alleles. The repeatability of fragment sizing for this instrument was evaluated by the analysis of a commercial 25 bp DNA ladder containing 11 fragments. Table 3 presents the results obtained for each control, as well as the expected size of each fragment, and the values of relative standard deviation (RSD). The RSD of the well-to-well sizing values for the replicates of the 25 bp DNA ladder ranged from 3.0 to 4.3% over three replicates in a single chip, and the differences between the expected and the obtained values were from 0.4 and 3.5%, indicating good reproducibility and accuracy. The results showed that for larger fragments, the values of the size decreased from first to last wells, which could be observed in the well 12, the last analyzed. Results from the wells 4 and 8 presented higher values than expected, while the well 12 presented lower values than expected.
The RSD of 4.3% was not significant when evaluated for 50 bp fragments, but became significant as the size of the fragment increased. The optimized PCR conditions were applied to the amplification of K562 DNA control along with the
Primer Tm (°C) Mean temperature (°C) Studied temperatures (°C) Annealing temperature (°C)
D21S11 A D21S11 B
52.0 46.0
49.0 50.0; 50.3; 51.4; 53.2 53.2
Penta E A Penta E B
59.4 60.8
60.1 58.1; 60.8; 63.5; 66.0 60.8
D18S51 A D18S51 B
54.3 56.0
55.2 53.2; 55.5; 58.1; 60.8 58.1
TH01 A TH01 B
62.2 63.4
62.8 58.1; 60.8; 63.5; 66.0 60.8
CSF1PO A CSF1PO B
58.9 63.7
61.3 55.5; 58.1; 60.8; 63.5 55.5
D7S820 A D7S820 B
51.7 51.4
51.5 50.3; 51.4; 53.2; 55.5 53.2
D13S317 A D13S317 B
54.1 52.9
seven pairs of primers and analyzed by the microchip electrophoresis. Results of sizing from the microchip electrophoresis were compared with those obtained in the capillary electrophoresis for
allelic standards and for two authentic paternity cases. The number of each allele was correlated by the MegaBACE software (Table 4).
Table 3 – Assessing sizing accuracy and precision for fragments 50 – 350 bp of a 25 bp DNA ladder in three different wells of a chip.
Size (bp)
Well # Mean
(bp)
RSD (%)
Error (%)
4 8 12
50 52 52 49 51 3.4 2.0
75 79 79 75 78 3.0 3.5
100 104 104 98 102 3.4 2.0
125 131 129 122 127 3.7 1.9
150 155 153 144 151 3.9 0.4
175 182 180 168 177 4.3 0.9
200 208 206 193 202 4.0 1.2
225 235 232 218 228 4.0 1.5
250 260 257 242 253 3.8 1.2
275 286 283 266 278 3.9 1.2
300 311 307 289 302 3.9 0.8
325 338 334 313 328 4.1 1.0
350 364 360 339 354 3.8 1.2
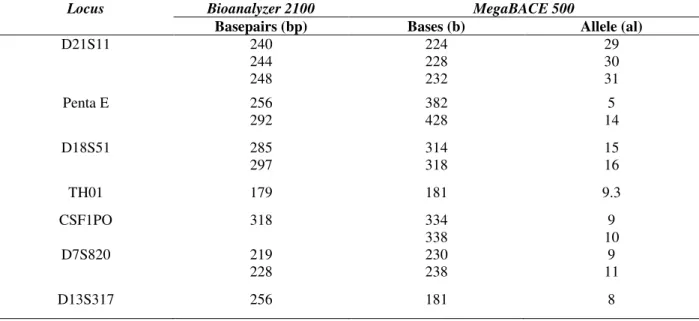
Table 4 - Correlation of fragment sizing in basepairs (bp) from Bioanalyzer 2100 and from MegaBACE 500, and allele number (al) from MegaBACE 500, for K562 DNA control.
Locus Bioanalyzer 2100 MegaBACE 500
Basepairs (bp) Bases (b) Allele (al)
D21S11 240
244 248
224 228 232
29 30 31
Penta E 256
292
382 428
5 14
D18S51 285
297
314 318
15 16
TH01 179 181 9.3
CSF1PO 318 334
338
9 10
D7S820 219
228
230 238
9 11
D13S317 256 181 8
As expected, the sizes of the amplicons determined by both platforms were different because the pairs of the primers used in this comparison were not the same. Additionally, the DNA molecules run in denatured single-stranded form (ssDNA) in MegaBACE and native double-stranded form (dsDNA) in the Bioanalyzer. When DNA was separated in its single standard form, an increase in the selectivity and resolution was observed compared to the separation of that
to be distinguished by the Bioanalyzer software. According to Kupfer et al. (2006), the poor resolution of these alleles was probably due to the larger sizes of the CSF1PO PCR products. Moreover, it could be attributed to the fact that the resolution of Bioanalyzer 2100 was 5 bp, which was limiting for adequate separation of the fragments differing by only one allele in this case, i.e., a difference of 4 bp.
The results of two paternity cases were also obtained in the microchip and capillary
electrophoresis, with the PCR conditions described previously, and compared in Table 5. Similar to the analysis of K562 control DNA, there were the cases in which only one fragment was quantified by the microchip software, while two were quantified in the capillary electrophoresis owing to the lack of the resolution. Similar results were observed for the CSF1PO in K562 control and for the alleles with smaller fragments, indicating poor resolution for the fragments differing by one allele independent of the size of the fragments.
Table 5 - Results of fragment sizing in two paternity cases in microchip electrophoresis (base pairs - bp) and capillary electrophoresis (bp and allele - al).
Paternity Case #1
Locus Microchip electrophoresis Capillary electrophoresis
AF (bp) C (bp) M (bp) AF (bp) AF (al) C (bp) C (al) M (bp) M (al)
D21S11 238 241 238 241 240 243 221 225 28 29 221 225 28 29 225 228 29 30
Penta E 272 288 288 296 270 297 398 418 9 12 418 428 12 14 393 428 7 14
D18S51 283 284 285 308 312
13 14
312 14 312 316
14 15
TH01 164 178 163 177 162 171 166 182 6 9.3 166 182 6 9.3 166 174 6 8
CSF1PO 316 324
315 324
316 338 346 10 12 338 346 10 12
338 10
D7S820 218 236
222 235
222 231 247 9 13 235 247 10 13
235 10
D13S317 270 268 267 274
198 12 198 12 170 198
6 12
Paternity Case #2
Locus Microchip electrophoresis Capillary electrophoresis
AF (bp) C (bp) M (bp) AF (bp) AF (al) C (bp) C (al) M (bp) M (al)
D21S11 240 261
244 261
242 225 242 29 33.2 229 242 30 33.2 225 228 29 30
Penta E 258 267
258 293
296 383 393 5 7 383 428 5 14 428 433 14 15
D18S51 273 291 292 302 293 302 304 328 12 18 328 340 18 21 328 340 18 21
TH01 166 166 165 166 170 6 7 166 170 6 7 166 170 6 7
CSF1PO 317 326
317 325
323 338 346 10 12 338 346 10 12 342 346 11 12
D7S820 222 234 222 226 222 226 231 243 9 12 231 235 9 10 231 235 9 10
D13S317 270 273
273 273 194 198
11 12
198 12 198 12
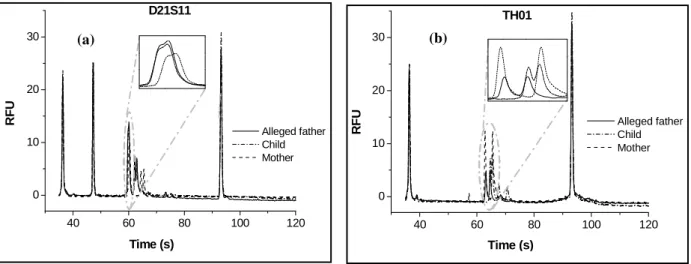
The electropherograms produced by the separation of loci TH01 and D21S11 in one paternity case are presented in Figure 1. They were overlapped for the ease of visualization of the corresponding bands from the child and those that were inherited from each parent. The manual examination of TH01 electropherograms showed resolved doublets for each individual (alleged father, child, and mother), allowing the fragment sizing and comparison, attributing the paternity to this alleged father. The electropherograms of D21S11, however, showed partially resolved doublets, making the fragment sizing and the comparison among the individuals more difficult, i.e., the
paternity investigation. Nevertheless, the Bioanalyzer could be more assertively used for the elimination of the paternity, if a different allele peak was detected among the three samples. Such event was statistically favored if large number of loci was used. The composition of the alleles from the son/daughter in a paternity case functions as leverage since each pair of the bands must be present; one comes from the mother and other comes from the father. The situation is different when applied to the personal identification, such as in the forensic cases, since there is no double point for the comparison.
Figure 1 - Overlays of electropherograms of loci D21S11 (a) and TH01 (b) for paternity case # 1. PCR was performed using conditions described in the text with sample of alleged father, mother, and child. The data analysis was carried out in Bionalyzer software. The sizes of the TH01 suggest an inclusion of paternity while the D21S11 showed partially resolved doublets, which makes fragment sizing and comparison between individuals difficult.
Considering the result of capillary electrophoresis for the seven analyzed loci, it was possible to include the alleged father as the father of the children in two cases, with 99.981% and 99.993% for the case 1 and 2, respectively. However, at least twelve loci have been investigated in order to validate these results legally.
In this work, the PCR conditions for the DNA amplification were optimized and established for seven STR loci used in the paternity tests. An evaluation of the conditions studied was analyzed by agarose gel electrophoresis and the best conditions were applied to the analysis of PCR products by the microchip electrophoresis, which was used to evaluate two paternity cases. The
results were compared with those obtained in a dedicated genetic analyzer. Although the fragment sizing presented results in the expected ranges, the Bioanalyzer did not present the necessary accuracy and resolution for the genotype testing when the tetranucleotide regions were being investigated. This limitation was intrinsically associated with the lower separation resolution for the double stranded DNA molecules. The RSD for the sizing was below 1.2%, which could be tolerated in many cases, but was restrictive for the analysis of tetranucleotide region. For example, such value suggested errors of 4 bp, which could erroneously, exclude or include an individual as a father by one allele difference. The analysis, however, did not
40 60 80 100 120
0 10 20 30
R
F
U
Time (s) D21S11
Alleged father Child Mother
(a)
40 60 80 100 120
0 10 20 30
Alleged father Child Mother TH01
R
F
U
Time (s)
rely solely on the results of a single allele and the final score was accounted for all the alleles. In order to improve the reliability of the commercial microchip electrophoresis for paternity testing, new primers and, ultimately, new allelic fragment sizes, should be designed.
The use of the Bioanalyzer for positive indication of paternity or identification of the individuals requires an extensive data analysis and knowledge-based obtained with the typical behavior of each allele throughout the separation range. The lack of resolution has to be taken into account in the probabilistic analysis with weighing for the possibility of identity and possibility of n ± 1 allele, i.e., the non-resolution of a one-tetranucleotide difference. For the exclusion of paternity, whoever, the method could be capable statistically of providing enough resolution to eliminate unequivocally one individual.
ACKNOWLEDGEMENTS
The authors would like to thank the FAPESP (Fundação de Amparo à Pesquisa do Estado de São Paulo) for the financial support, DNA Consult for the donation of samples and results, and Agilent Technologies for the donation of the Bioanalyzer 2100.
REFERENCES
Alford RL, Hammond HA, Coto I, Caskey CT. Rapid and efficient resolution of parentage by amplification of short tandem repeats. Am J Hum Genet. 1994; 55: 190-5.
Bacher J, Schumm JW. Profiles in DNA, Promega Corporation. Wisconsin: Madison; 1998.
Butler JM. Forensic DNA Typing: Biology and Technology behind STR markers. London: Academic Press; 2001.
Butler JM., Buel E, Crivallente F, McCord BR. Forensic DNA typing by capillary electrophoresis using the ABI Prism 310 and 3100 genetic analyzers for STR analysis. Electrophoresis. 2004; 25: 1397-1412.
Funes-Huacca ME, Regitano LCA, Mueller O, Carrilho E. Semiquantitative determination of Alicyclobacillus acidoterrestris in orange juice by reverse-transcriptase polymerase chain reaction and capillary electrophoresis – laser induced fluorescence using microchip technology. Electrophoresis. 2004; 25: 3860-64.
Innis MA, Gelfand DH, Sninsky JJM, Whiti TJ. PCR protocols: a guide to methods and applications. San Diego: Academic Press; 1990.
Kupfer DM, Huggins M, Cassidy B, Vu N. A Rapid and Inexpensive PCR-Based STR Genotyping Method for Identifying Forensic Specimens, Final Report DOT/FAA/AM-06/14; 2006. Available from: http://www.faa.gov/library/reports/medical/oamtechre ports/index.cfm
Moretti TR, Baumstark AL, Defenbaugh DA, Keys KM, Smerick JB, Budowle B. Validation of short tandem repeats (STRs) for forensic usage: performance testing of fluorescent multiplex STR systems and analysis of authentic and simulated forensic samples. J Forensic Sci. 2001; 46: 647-60. Ng DPK, Koh D, Choo SGL, Ng V, Fu Q. Effect of
storage conditions on the extraction of PCR-quality genomic DNA from saliva. Clin Chim Acta, 2004; 343: 191–4.
Nutini AL, Mariottini A, Giunti L, Torricelli F, Ricci U. Double incompatibility at human alpha fibrinogen and penta E loci in paternity testing. Croat Med J. 2003; 44: 342-6.
Panaro NJ, Yuen PK, Sakazume T, Fortina P, Kricka LJ, Wilding P. Evaluation of DNA fragment sizing and quantification by the Agilent 2100 Bioanalyzer. Clin Chem. 2000; 46:1851-53.
Ricci U, Sani I, Klintschar M, Cerri N, De Ferrari F, Uzielli MLG. Identification of forensic samples by using an infrared-based automatic DNA sequencer. Croat MedJ. 2003; 44: 299-305.
Sacchetti L, Calcagno G, Coto I, Tinto N, Vuttariello E, Salvatore F. Efficiency of two different nine-loci short tandem repeat systems for DNA typing purposes. Clin Chem. 1999; 45: 178-83.
Schumm JW, Bacher JW. Materials and methods for identifying and analyzing intermediate tandem repeat DNA markers. U.S. Patent 6,238,863; 2001.
van der Schans MJ, Kuypers AWHM, Kloosterman AD, Janssen HJT, Everaerts FM. Comparison of resolution of double-stranded and single-stranded DNA in capillary electrophoresis. J Chromatogr A. 1997; 772:255-64.
Walsh DJ, Corey AC, Cotton RW, Forman L, Herrin GL, Word CJ, Garner DD. Isolation of deoxyribonucleic acid (DNA) from saliva and forensic science samples containing saliva. J Forensic Sci. 1992; 37: 387-95.