Predição do risco de erosão hídrica em florestas de eucalipto
Mayesse Aparecida da Silva1, Marx Leandro Naves Silva2, Nilton Curi2,
Anna Hoffmann Oliveira2, Junior Cesar Avanzi3, Lloyd Darrell Norton4
ABSTRACT
Eucalyptus plantations are normally found in vulnerable ecosystems such as steep slope, soil with low natural fertility and lands that were degraded by agriculture. The objective of this study was to obtain Universal Soil Loss Equation (USLE) factors and
use them to estimate water erosion risk in regions with eucalyptus planted. The USLE factors were obtained in field plots under natural
rainfall in the Rio Doce Basin, MG, Brazil, and the model applied to assess erosion risk using USLE in a Geographic Information System. The study area showed rainfall-runoff erosivity values from 10,721 to 10,642 MJ mm ha-1 h-1 yr-1. Some soils (Latosols)
had very low erodibility values (2.0 x 10⁻⁴ and 1.0 x 10⁻⁴t h MJ-1 mm-1), the topographic factor ranged from 0.03 to 10.57 and crop
and management factor values obtained for native forest, eucalyptus and planted pasture were 0.09, 0.12 and 0.22, respectively. Water erosion risk estimates for current land use indicated that the areas where should receive more attention were mainly areas with greater topographic factors and those with Cambisols. Planning of forestry activities in this region should consider implementation of other conservation practices beyond those already used, reducing areas with a greater risk of soil erosion and increasing areas with very low risk.
Index terms: USLE factors, soil loss tolerance, conservation practices, forest management.
RESUMO
Normalmente, os plantios florestais com eucalipto encontram-se inseridos em ecossistemas sensíveis como relevo acidentado, solos com baixa fertilidade natural e antigas áreas agrícolas degradadas. Objetivou-se neste estudo, obter os fatores da equação universal de perdas de solo (USLE) e, por meio dela, estimar o risco de erosão hídrica em regiões florestadas com eucalipto simulando alguns cenários. Os fatores da USLE foram obtidos em parcelas instaladas no campo, sob chuva natural, na Bacia do Rio Doce, MG, Brasil e aplicados para avaliar o risco de erosão, usando a USLE no Sistema de Informações Geográficas. A área
do estudo apresentou valores de erosividade variando de 10.721 a 10.642 MJ mm ha-1 h-1 ano-1. Alguns solos (Latossolos) tiveram
baixos valores de erodibilidade (2,0 x 10⁻⁴ e 1,0 x 10⁻⁴ t h MJ-1 mm-1), o fator topográfico variou de 0,03 a 10,57 e o fator cobertura e manejo obtidos para floresta nativa, eucaliptos e pastagem plantada foram 0,09, 0,12 e 0,22, respectivamente. O risco estimado de erosão hídrica no uso atual indicou que a áreas que devem receber mais atenção foram, principalmente, as áreas com maior fator topográfico e áreas de Cambissolo. O planejamento das atividades florestais nessas regiões deve considerar a implantação de outras práticas conservacionistas, além das já utilizadas, reduzindo as áreas de maiores riscos a erosão do solo e aumentando as áreas de
risco muito baixo nas áreas de Cambissolo.
Termos para indexação: Fatores da USLE, tolerância de perdas de solo, práticas conservacionistas, manejo florestal.
1International Center for Tropical Agriculture/CIAT – Recta Cali-Palmira – Km 17 – Palmira – Valle del Cauca – Colombia – [email protected] 2Universidade Federal de Lavras/UFLA – Departamento de Ciências do Solo/DCS – Lavras – MG – Brasil
3Empresa Brasileira de Pesquisa Agropecuária/Embrapa – Centro Nacional de Pesquisa em Pesca – Aquicultura e Sistemas Agrícolas – Palmas – TO – Brasil 4Agricultural Research Service – United States Department of Agriculture – West Lafayette – Indiana – USA
Received in november 18, 2013 and approved in february 24, 2014 INTRODUCTION
Eucalyptus plantations are normally found in vulnerable ecosystems that are susceptible to human disturbances such as steep slope, low natural soil fertility and lands that were degraded by agriculture long time ago. These factors, along with soil management, mechanical harvesting, forest roads construction and maintenance, and erosive potential in a region, are mainly responsible for eucalyptus productivity reduction and alteration of
water quantity and quality caused by water erosion. On
average, 30% of sediment lost by water erosion reaches
Water erosion modeling has been used to help identify land use with more or less water erosion risk and understand the erosion mechanisms and its causes and effects. There are various models, and the most used throughout the world is the Universal Soil Loss Equation (USLE), which is an empirical model developed by Wischmeier and Smith (1978). The USLE predict soil loss using factors that consider the effect of rain, soil, slope steepness and length, land use and conservation practices that are adopted. Since USLE is an empirical method, it depends on local information where it is to be applied and its accuracy will depend on how accurately
the factors were developed. Other important information
that contributes to soil management planning is soil loss tolerance. It will indicate if the management of soil for determined cultivation is providing soil loss greater than soil loss tolerance, which will result in soil degradation.
With the rise of computer technology, many studies have been developed integrating USLE factors into a Geographic Information System (GIS) (Mati et
al., 2000; Srinivas et al., 2002; Tomazoni; Guimarães,
2005; Erdogan; Erpul; Bayramin, 2007; Ozcan et al., 2008; Bahadur, 2009, Avanzi et al. 2013). This allows
the use of USLE to be increased for development and extrapolation of useful information and identifying lands of greater erosion risk as well as in determination of the best use of conservation practices for a given area. Thus, the objective of this study was to determine the USLE factors, integrate them into a GIS environment and predict water erosion risk for eucalyptus plantations and others scenarios (simulating the land use changes) in two regions within the Rio Doce Basin on Minas Gerais State, Brazil.
MATERIALS AND METHODS
The study area and soil description
The study areas are located in two towns: Belo
Oriente (R1), 42° 26’ 58” W and 19° 15’ 30” S, and Guanhães (R2), 42° 51’ 08” W and 18° 50’ 00” S. Both
are located in the Rio Doce Basin on Minas Gerais State, Brazil, covering 21 km2 and 10 km2 for R1 and R2,
respectively (Figure 1).
Figure 1 – Location of Belo Oriente (R1) and Guanhães (R2) showing the soil map of the two representative regions
The original ecosystem in Rio Doce Basin was
Atlantic Forest, which was replaced, mainly by pastures
and later into eucalyptus plantations. The climate of the
R1 is Aw, tropical with dry winter and a rainy season in the summer according to the Köppen classification system, with average temperatures ranging from 22° C to 27° C, and highest of 32° C, and lowest of 18° C. Average
annual rainfall varies from 701 to 1,500 mm and the average elevation is 300 m. R2 has a Cwa type climate, dry winter and rainy summer, according to the Köppen
classification system, with average temperature ranging from 18° C to 22° C. Average annual rainfall is 1,181 mm
and average elevation is 850 m. The main soil classes in
the two regions were classified as very clay dystrophic Red Yellow Latosol - LVA (Oxisol), clay typical dystrophic Red Latosol - LV (Oxisol), and very clay typical dystrophic Tb
Haplic Cambisol - CX (Inceptisol) (Cenibra, 2001). Table 1 shows the main properties of these soils.
maps, soil maps, land use maps, field studies, and the
results of other relevant studies.
Integration of USLE into a GIS environment was established by converting the factors to the raster/grid format. The scenarios proposed were: contour-planted eucalyptus (current land use); non-contour-planted eucalyptus (alternative management in planted forest); maximum erosion potential (maximum possible erosion considering no plant cover or conservation practices
– bare soil); reference system (native forest – Atlantic
Forest); planted pasture (main land use in the region as an alternative to eucalyptus plantations). USLE can be expressed by the following equation (Wishmeier; Smith, 1978):
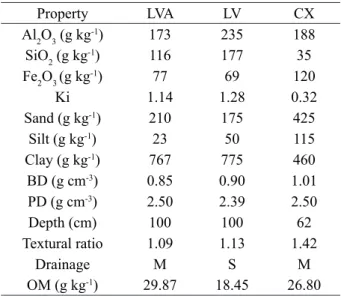
Table 1 – Mineralogical, physical and chemical properties, at a depth of 0-20 cm, from Red Latosol (LV), Red Yellow Latosol (LVA) and Cambisol (CX) soils.
Property LVA LV CX
Al2O3 (g kg
-1) 173 235 188
SiO2 (g kg
-1) 116 177 35
Fe2O3 (g kg-1) 77 69 120
Ki 1.14 1.28 0.32
Sand (g kg-1) 210 175 425
Silt (g kg-1) 23 50 115
Clay (g kg-1) 767 775 460
BD (g cm-3) 0.85 0.90 1.01
PD (g cm-3) 2.50 2.39 2.50
Depth (cm) 100 100 62
Textural ratio 1.09 1.13 1.42
Drainage M S M
OM (g kg-1) 29.87 18.45 26.80
BD: bulk density, PD: particle density, OM: organic matter, M: moderate, S: slow, Ki: SiO2/Al2O3 molecular ratio, Textural ratio: clay B horizon/clay A horizon.
Water erosion risk estimate
Water erosion risk estimate and mapping for the different scenarios in R1 and R2 was carried out using the Universal Soil Loss Equation (USLE) in a Geographic
Information System (GIS). All factors used in the USLE
were calculated for both regions using local data. They were obtained from meteorological stations, topographic
A=R.K.LS.C.P (1)
Where: A is the average annual soil loss in t ha-1, R is
average annual rainfall-runoff erosivity factor in MJ mm ha-1 h-1 yr-1, K represents the soil erodibility factor in t h
MJ-1 mm-1, LS corresponds to slope length (dimension
less) and slope steepness (dimension less) factors; C is the cover management factor (dimension less); and P is the support practice factor (dimension less).
USLE factors
The USLE factors were obtained using local data by monitoring soil and water loss, under natural rainfall, in field plots (4 x 24 m) according Wischmeier and Smith (1978). The land use systems studied in these two regions use contour planting (the current land use) and non-contour-planted eucalyptus (alternative management in planted forest) with no tillage (minimum cultivation), 3.0 x 3.3 m spacing between trees dug 0.3 x 0.3 x 0.3 m pits. Three other systems were analyzed in addition to
these systems: reference system (native forest-Atlantic
Forest), common regional land use (pasture planted with Brachiaria sp.) and maximum soil erosion potential (bare soil). When needed, weeding was carried out on the erosion plot to expose bare soil and to control spontaneous plants. More information can be found in Silva et al. (2011). The method used to obtain each of the USLE factors is described below.
per storm using pluviograph records collected between January 2005 and December 2008 with 5 min of interval. The sum of R factor per storm during a year is the R factor for that year and the average between all years studied is the R factor for that region. R factor for each storm was determined by the product of the total energy for a storm
and the storm’s maximum 30 min intensity (Wischmeier;
Smith, 1978):
down the slope, and kept free of vegetation. When all these conditions are met and the slope is 9%, LS, C and P
are equal 1 (one) and K equals A/R (Wischmeier; Smith, 1978). However, for this study the field plots were installed in slopes of 32.5 % for LVA and 17.6 % for LV requiring
adjusts for soil loss in function of slope. Thus, the LS
factor was calculated, for LVA and LV, according equation
5 (Bertoni; Lombardi Neto; Benati Junior, 1975) and all soil loss values determined for the conditions described above were adjusted for LS equal 1 (one) for that the K factor could be determined.
R = EI30 (2)
Where: R is storm rainfall-runoff erosivity factor in MJ mm ha-1h-1storm-1, E is total energy for a storm in MJ
ha-1 mm-1 and I
30 is storm’s maximum 30 min intensity
in mm h-1.
Storm energy (E) was determined for each erosive storm according De Maria (1994) (storms of less 10 mm and separated from other rain periods by more 6 h were not included) and each interval (5 min) (Foster et al., 1981):
E = 0.119 + 0.0873logI (3)
Where: E is kinetic energy in MJ ha-1 mm-1 and I is intensity
for each interval in mm h-1.
However, for modeling erosion is recommended R factor for at least 20 years of data collection for that all climatic variations that occur could be captured. This issue can be resolved using nonlinear regressions between R
factor determined by equation 2 and Fournier coefficient
to apply into historical rainfall records and calculating new R factor (RFournier). The Fournier coefficient was calculated using daily rainfall data (pluviometric records), accumulated for both regions by Hidroweb database of
the Brazilian National Water Agency (ANA) on website
(http://hidroweb.ana.gov.br) as proposed by Fournier (1956):
Rc = p2.P-1 (4)
Where: Rc is the rain coefficient (mm), p is the average
monthly rainfall (mm) and P is the average annual rainfall (mm).
Soil erodibility factor (K factor): K factor represents the susceptibility of the soil to undergo detachment and transport by the combined erosive action
of rain and water flow (runoff). To determine Latosols (LV and LVA) K factor, soil loss was obtained for a field
plots (4 x 24 m), under natural rainfall, tilled up and
LS = L0.5.100-1(1.36 + 0.975S + 0.1385S2) (5)
Where: LS is the topographic factor of USLE
(dimensionless) fitted for the conditions of the field plots,
L is the slope length (m) and S the slope steepness of the terrain (%).
Soil erodibility value of 0.0355 t h MJ-1 mm-1 was
adopted for Cambisol (CX) as found by Silva et al. (2009) and the map for K factor was created by reclassifying the soil map in raster/grid format (Figure 1) according the K factor values determined.
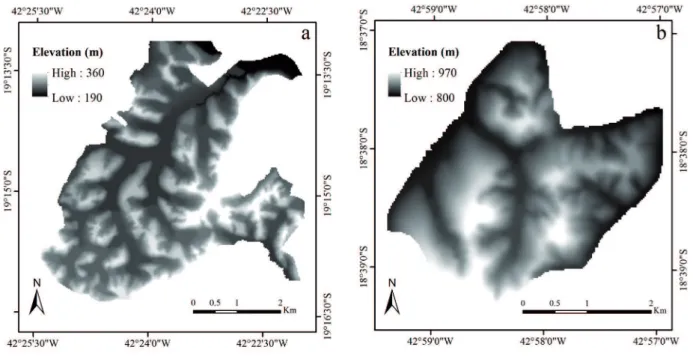
Topographic factor (LS factor): This factor reflects
the effects of topography on soil loss caused by water
erosion. A Digital Elevation Model (DEM), with 24 m resolution based on the size of the field plots (Figure 2a,b),
was used to calculate the LS factor. Better LS factor was obtained by Bhattarai and Dutta (2007) when these authors
used a resolution close to the size of the USLE field plots to
create the DEM. Slope length factor (L) was obtained using equation 6 (Renard et al., 1997; Bhattarai; Dutta, 2007).
L = (λ/22.13)m (6)
Where: λ is the field slope length (24 m) and m is the slope length exponent. Slope length exponent m is related to the
ratio β of rill erosion (caused by flow) to interrill erosion
(mainly caused by raindrop impact) by the following equation (McColl et al., 1989).
m = β/(β + 1) (7)
β = (sinθ/0.0896)/[3(sinθ)0.8 + 0.56] (8)
Where: β is the quotient of rill erosion and interrill erosion and θ is angle slope (degrees). The slope
Crop and management factor (C factor): This
factor reflects the effects of crop and soil management
practices on water erosion rates and is the most frequently used factor when comparing impacts related to crop and management and for conservation practice planning (Renard et al., 1997). The C factor represents the expected relationship between soil loss in a planted area in given conditions and the corresponding soil loss from a terrain continuously left without vegetation (Wischmeier; Smith,
1978). In this study, data generated from field plots (plots
with bare soil, eucalyptus, planted pasture and native forest) with natural rainfall were used to establish the soil loss ratio (SLR). Development stages for eucalyptus were established as a function of years of the experiment in addition to comparing it to native forest and planted pasture at the current stage. SLR was calculated as in Wischmeier and Smith (1978) using equation 11.
The C factor was calculated using equation 12 (Renard et al., 1997).
S = 10.8sinθ + 0.03 for θ < 9 % (9)
S = 16.8sinθ - 0.5 for θ ≥ 9 % (10)
Figure 2 – Digital elevation model developed for the R1 (a) and R2 (b).
SLR = SLc/SLr (11)
Where: SLR is the soil loss ratio, SLc is the soil loss from
a specific cropping/management and SLr is the soil loss
for bare soil (t ha-1 yr-1).
C = (SLR1EI1 + SLR2EI2 +… SLRnEIn)/EIt (12)
Where: C is the cover management factor, EIi is rainfall-runoff erosivity at each growth stage and EIt is total rainfall-runoff erosivity in the period.
The map of C factor was generated from reclassifying the current land use map (Figure 3a, b).
Support practice factor (P factor): This is the relationship between expected soil loss using some support practice and soil loss when the crop is planted up and downslope (Bertoni; Lombardi Neto, 2005). P equal 0.1 was used in the reference system, P equal 0.5 for contour-planted eucalyptus and P equal 1.0 for the other scenarios as in Bertoni and Lombardi Neto (2005).
Soil loss tolerance
Soil loss tolerance reflects the maximum level
of soil erosion that will permit a high level of crop
productivity to be sustained economically and indefinitely
(Wischmeier; Smith, 1978). It is a hard parameter to
define due the difficult to determine the soil formation
ratios. For this reason, soil properties that reflect
indirectly the soil formation rates are used to define the
In this study, soil loss tolerance was estimated using the method proposed by Smith and Stamey (1964) and the method proposed by Lombardi Neto and Bertoni (1975) and Galindo and Margolis (1989). The methods proposed, take into consideration effective soil depth, textural relationship between the horizontal sub-surface and surface, permeability and level of organic matter (Table 1). The average value was obtained from the results determined by both methods.
RESULTS AND DISCUSSION USLE factors
R factor was first determined for period of 2005 until
2008 (Figure 4). The annual R factor was 12,495 MJ mm ha-1 h-1 yr-1 for R1 and 8,643 MJ mm ha-1 h-1 yr-1 for R2. The
average monthly R factor was greater during the wet season, which starts on November and ends on March, contributing with approximately 90% of total rainfall-runoff erosivity for the study period. However, higher rainfall does not mean higher R factor due to the principal agent responsible for higher R factor is the intensity and not only the amount of
rainfall. The Rio Doce Basin’s region is affected, during
the wet season by atmospheric circulation phenomena
influenced by the predominance of convective systems
associated with heating continental and by Convergence
Zone of the South Atlantic (Silva et al., 2010; Silva et al., 2011). As result, these regions receive rainfall at higher
intensities and consequently present higher erosion risks due to higher rainfall-runoff erosivity values.
The nonlinear regression equations generated from R factor using pluviographic records and Fournier
coefficients were: RFournier=215.40×Rc
0.65 (R2=0.89) for
R1 and RFournier=123.34×Rc0.74 (R2=0.95) for R2. These
equations allowed R factor values to be obtained for the historical rainfall records of R1 and R2.
The RFournier ranged from: 4,949 MJ mm ha-1 h-1
yr-1 to 13,105 MJ mm ha-1 h-1 yr-1 and from 4,553MJ mm
ha-1 h-1 yr-1 to 11,900 MJ mm ha-1 h-1 yr-1 for R1 and R2,
respectively. The lower values for the two regions were related to the dry season and the greatest values for the wet season, agreeing with the results for period between 2005 and 2008 and others studies carried out in Brazil,
such as Aquino et al. (2012), Silva et al. (2010), Oliveira
et al. (2009) and Bazzano, Eltz and Cassol (2007). The average annual rainfall-runoff erosivity value used in USLE model was 10,721 MJ mm ha-1 h-1 yr-1 for R1 and
10,642 MJ mm ha-1 h-1 yr-1 for R2. Despite the values
being very high according to the classification of Foster
et al. (1981).
The soil erodibility (K factor) for the study period was 2.0 x 10⁻⁴ and 1.0 x 10⁻⁴t h MJ-1 mm-1 for LVA and
LV, respectively. These erodibility values are classified as
low according Foster et al. (1981). In general, Latosols are soils that have low erodibility because of their high level of weathering and higher levels of iron and aluminum oxides, which give the soils good structure. Latosols of this region have structure between blocks and granular, which
provides them good water infiltration and good degree of
consistency between aggregates, that help substantially
reduce erosion, which is certainly related to the low erodibility value of these soils (Resende, 1985). However, when runoff does occur the small blocks or granules can easily be transported by water due to these Latosols are very easily eroded when kept without vegetation, and are easily dissected as a result of surface horizon loss
by erosion. Tomazoni and Guimarães (2005) also verify
that the Latosols in southeast Parana, Brazil, have low K factor when compared to undeveloped soil because of their advanced weathered state which gives more depth, better physical properties and better water erosion resistance.
LS factor ranged from 0.03 to 10.21 and 0.03 to 10.57 for R1 and R2, respectively (Figure 5a, b). The LS
factor reflects the influence of topography (length and steepness of the slope) in water erosion. At a certain slope
length, even in soils with good vegetation cover, the shear energy of the runoff can exceed the critical shear stress of the soil allowing the transport of sediment (Bertol; Cogo; Levien, 1997). This was observed by Denardin, Faganello and Sattler (2008) which related that just a good land cover provided by tillage cropping system could be not enough to reduce erosion, requiring implementation of conservation practices that provide the fragmentation of length slope to effective reduction of water erosion.
Crop and management factor (C factor) values obtained for native forest, eucalyptus and planted pasture were 0.09, 0.12 and 0.22. The C factor for planted pasture was lower than that obtained by Bertoni; Lombardi Neto (2005), with a value of 0.40. The C factor for eucalyptus
was lower than that obtained by Martins et al. (2010) of 0.30. The native forest was greater than determined by Martins et al. (2010) of 0.02. The greater the plant coverage of soil, the erosion risk is lower due to the interception of rain and surface runoff between plants by the crowns of trees and litter, differing between plants in function of architecture, spacing and living patterns.
Water erosion risk estimate
The water erosion risk estimate for contour-planted eucalyptus for R1 and R2 was distributed into
five classes ranging from very low to very high (Figure 6a, b). According USLE for the R1 and R2, the areas that
should draw more attention among the soil classes were the Haplic Cambisol (CX) since the greatest losses were observed in this class, showing the vulnerability of this
soil class to water erosion (Avanzi et al. 2013).
Cambisols in Minas Gerais State are normally geographically associated with Latosols and they may
be formed by C horizon of Latosols which had the A and
B horizons removed by water erosion (Resende, 1985). Furthermore, Cambisols are shallow (Table 1), more kaolinitic soils, block structured with low permeability, making them more susceptible to water erosion (Silva et al., 2005), while Latosols are deeper and have a more granular structure favored by aluminum oxides present as gibbsite in the clay fraction that offers more aggregation, resulting in high permeability and greater erosion resistance (Silva et al., 1998).
Latosols (LVA and LV) behaved similarly in regards to water erosion, that is, LVA and LV had risk
ranging from very low to low. For Latosols, the LS factor mainly determined soil loss, and areas with greater LS had greater soil erosion risk. For Cambisols, the LS factor along with high K factor were the main factors that gave this soil class greater erosion risk in these regions, where more attention should be given to land management. Greater soil loss in areas with greater LS factor was also observed by Erdogan, Erpul and Bayramin (2007) and Zhang et al. (2009).
The corresponding area to each erosion risk class for current land use and the proposed scenarios is shown
in figure 6a, b. According USLE, for R1 and R2, the
erosion potential scenario with planted pasture scenario
had greater coverage of its area classified as a very high
risk. The scenario reference system was the scenario of greater coverage at very low class followed by the contour-planted eucalyptus and non-contour-contour-planted eucalyptus.
A high percentage of the area with very high risk erosion
are due to the Cambisols areas for both regions being greater than Latosols, indicating the need to implement additional conservation practices in these critical areas. Groundcover offered by tree crowns and formation of litter acts directly and effectively in reducing water erosion, helping to dissipate kinetic energy in raindrops, decreasing disaggregation of soil particle and sealing the surface,
and increasing water infiltration. It also reduces the speed
of surface runoff and consequently its erosive potential (Sloneker; Moldenhauer, 1977; Cogo; Moldenhauer; Foster, 1984; Zhou et al., 2002; Cogo; Levien; Schwarz, 2003; Brito et al., 2005; Pires et al., 2006; Silva et al.,
2011; Oliveira et al., 2013; Avanzi et al., 2013).
When substitution of current land use (contour-planted eucalyptus) by non-contour-(contour-planted eucalyptus is simulated, we estimated that these two situations had similar erosion risks for R2 and R1 with a slight reduction for the very low class and a slight increase in moderate risk class (Figure 7). Substituting the current use (contour-planted eucalyptus) for (contour-planted pasture had slight reduction in the very low class and an increase in moderate risk class for R1 and R2 and the reduction of areas of very low risk was greatest in R1.
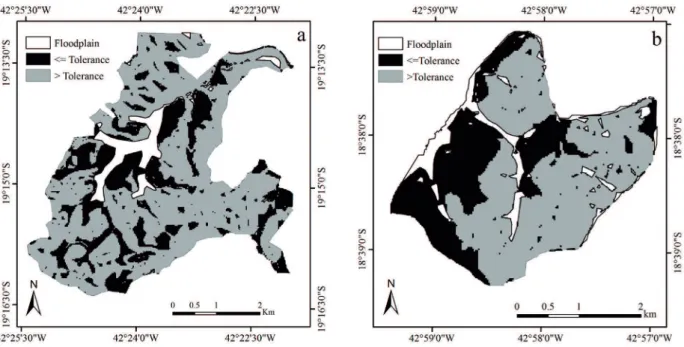
From the soil loss tolerance values obtained, which were 6, 8 and 9 t ha-1 yr-1 for CX, LVA and LV respectively,
it was possible to evaluate areas where estimated water erosion values where greater than the tolerance values (Figure 8a, b). The CX had the lowest value of tolerance due to their shallow depth, greater bulk density and greater textural ratio (Table 1). These factors limit the water
infiltration capacity of soil and promote runoff making it
more susceptible to water erosion similar to observations
of Bertol and Almeida (2000). Among the Latosols,
moderate drainage of LV soils makes it more tolerable
than LVA. Less drainage also affects the water infiltration
promoting the detachment of soil particles by runoff
generated by the lesser permeability. The low tolerance of CX associated with a greater K factor and slope, when
compared with LV and LVA, makes sediment losses in the
CX above the tolerable levels, which is 64 % for R1 and
71 % for R2. According to Resende (1985), Cambisols in
this region are very unstable and should be considered the environmental protection.
In this study, it can be seen that current conservation practices and a good groundcover obtained by eucalyptus are not enough to guarantee protection of the soil against
water erosion in the Cambisol areas. On the other hand,
land use in areas of Latosol associated with low erodibility is seen to be adequate considering that the two regions had critical R factor and LS factors. Planning of forestry
Figure 6 – Water erosion risk for current land use in the R1(a) and R2 (b).
activities in R1 and R2 should consider implementation of strong conservation practices, and above those has being currently used in order to reduce the area at greater risk and increase the area at low risk, mainly for the Cambisols.
Also, further research regards LS factor calculated from DEM is needed. Although the evolution of LS factor
(from manual methods to DEM based methods) can be considered an important change on soil erosion models it
still remain issues that should be solved (Oliveira et al.,
2013). Due to the limitations of the resolution, there could be areas with high erosion that are not represented. In this sense, it is needed more understanding regards DEM resolution to determine LS factor.
CONCLUSIONS
Both regions had high R factor (12,495 MJ mm ha-1 h-1 yr-1 for R1 and 8,643 MJ mm ha-1 h-1 yr-1 for R2)
and RFournier factor (10,721 MJ mm ha-1 h-1 yr-1 for R1 and
10,642 MJ mm ha-1 h-1 yr-1 for R2). Latosols had low K
factor values, 2.0 x 10⁻⁴ and 1.0 x 10⁻⁴t h MJ-1 mm-1 for
LVA and LV, respectively. LS factor ranged from 0.03 to
10.21 for R1 and 0.03 to 10.57 for R2 and C factor values obtained for native forest, eucalyptus and planted pasture were 0.09, 0.12 and 0.22, respectively.
Water erosion risk estimates in the current land use for both regions indicated that the areas that should have more attention are mainly related to areas with greater
LS factor and were Cambisols are present. The erosion potential scenario followed planted pasture scenario had
smaller coverage of its area classified as very high risk.
The scenario reference system was the scenario of greater coverage at very low class followed by the contour-planted eucalyptus and non-contour-planted eucalyptus.
ACKNOWLEDGEMENTS
The authors would like to thank the Brazilian Coordination for the Improvement of Higher Education
Personnel (CAPES) and the Brazilian National Council for Scientific and Technological Development (CNPq
- 471522/2012-0) for grants, as well as Celulose Nipo
Brasileira S.A. (CENIBRA S.A.) and its employees,
in special Fernando Palha Leite, for caring for the experimental area and data collection.
REFERENCES
AMARAL, A.J. et al. Redução da erosão hídrica em
três sistemas de manejo do solo em um Cambissolo
húmico da região do Planalto Sul-Catarinense.
Revista Brasileira de Ciência do Solo, 32(5):2145-2155, 2008.
AQUINO, R.F. et al. Spatial variability of the rainfall
erosivity in southern region of Minas Gerais state, Brazil. Ciência e Agrotecnologia. 36(5):533-542, 2012.
AVANZI, J.C.; SILVA, et al. Spatial distribution of
water erosion risk in a watershed with eucalyptus and
Atlantic forest. Ciência e Agrotecnologia, 37(5):427-434, 2013.
BAHADUR, K.C.K. Mapping soil erosion
susceptibility using remote sensing and GIS: a case of the Upper Nam Wa Watershed, Nan Province, Thailand. Environmental Geology, 57(3):695-705, 2009.
BAZZANO, M.G.P.; ELTZ, F.L.F.; CASSOL, E.A. Erosividade, coeficiente de chuva, padrões e período de retorno das chuvas de Quaraí, RS. Revista Brasileira de Ciência do Solo, 31(5):1205-1217, 2007.
BERTOL I.; COGO N.P.; LEVIEN R. Comprimento crítico de declive em sistemas e preparos
conservacionistas de solo. Revista Brasileira de Ciência do Solo, 21(1):139-148, 1997.
BERTOL, I.; ALMEIDA, J.A. Tolerância de perda de solo por erosão para os principais solos do estado
de Santa Catarina. Revista Brasileira de Ciência do Solo,24(3):657-668, 2000.
BERTONI, J.; LOMBARDI NETO, F. Conservação do solo.São Paulo: Ícone, 2005. 355p.
BERTONI, J.; LOMBARDI NETO, F.; BENATI JÚNIOR, R. Equação de perdas de solo, Campinas:
Instituto Agronômico, 1975. 25p. (Boletim Técnico, 21)
BEUTLER, J.F. et al. Perdas de solo e água num Latossolo Vermelho aluminoférrico submetido a diferentes sistemas de preparo e cultivo sob chuva natural. Revista Brasileira de Ciência do Solo, 27(3):509-517, 2003.
BHATTARAI, R.; DUTTA, D. Estimation of soil
erosion and sediment yield using GIS at catchment scale. Water Resources Management, 21(10):1635-1647, 2007.
BRITO, L.F. et al. Erosão hídrica de Latossolo
Vermelho muito argiloso relevo ondulado em área de
pós-plantio de eucalipto no Vale do Rio Doce, região
Centro Leste do Estado de Minas Gerais. Scientia Forestalis, 67(1):27-36, 2005.
CELULOSE NIPO-BRASILEIRA S.A. - CENIBRA. Levantamento semidetalhado de solos das regiões
do Rio Doce, Cocais, Sabinópolis e Virginópolis. Ipatinga, 2001. v.1, 101p.
COGO N.P.; LEVIEN R.; SCHWARZ R.A. Perdas de solo e água por erosão hídrica, influenciadas por métodos de preparo, classes de declive e níveis de
fertilidade do solo. Revista Brasileira de Ciência do Solo, 27(4):743-753, 2003.
COGO, N.P.; MOLDENHAUER, W.C.; FOSTER,
G.R. Soil loss reductions from conservation tillage practices. Soil Science Society of American Journal. 48(2):368-373, 1984.
CULLUM, R.F. et al. Runoff and soil loss form ultra-narrow row cotton plots with and without stiff-grass hedges. Soil Tillage and Research, 93(1):56-63, 2007.
DE MARIA, I.C. Cálculo da erosividade da chuva. In: INSTITUTO AGRONÔMICO DE CAMPINAS.
Manual de programas de processamento de dados de campo e de laboratório para fins de experimentação em conservação do solo. Campinas: IAC/SCS, 1994. Não paginado.
DENARDIN, J. E.; FAGANELLO, A.; SATTLER, A. Vertical Mulching: prática conservacionista
mitigadora de perdas por erosão hídrica em sistema
plantio direto. Passo Fundo: Embrapa Trigo, 2008. 11 p. html (Embrapa Trigo. Boletim de Pesquisa e
Desenvolvimento Online, 53). Disponível em: <http://
www.cnpt.embrapa.br/biblio/bp/p_bp53.htm>.
ERDOGAN, H.E.; ERPUL, G.; BAYRAMIN, I. Use
of USLE/GIS methodology for predicting soil loss in a semiarid agricultural watershed. Environmental Monitoring and Assessment, 131(1/3):153-161, 2007.
FOSTER, G.R. et al. Conversion of the universal
soil loss equation to SI units. Journal Soil Water Conservation, 36(6):355-359, 1981.
FOURNIER, F. The effect of climatic factors on soil
GALINDO, I.C.; MARGOLIS, E. Tolerância de perdas por erosão para os solos do estado de
Pernambuco. Revista Brasileira de Ciência do Solo, 13(1):95-100, 1989.
GUADAGNIN, J.C. et al. Perdas de solo, água e nitrogênio por erosão hídrica em diferentes sistemas
de manejo. Revista Brasileira de Ciência do Solo, 29(2):277-286, 2005.
HERNANI, L.C. et al. A erosão e seu impacto. In:
MANZATTO, C.V.; FREITAS JUNIOR, E.; PERES,
J.R.R. (Ed.). Uso agrícola dos solos brasileiros. Rio de Janeiro: Embrapa Solos, 2002. p.47-60.
LEVIEN, R.; COGO, N.P. Erosão na cultura do milho em sucessão à aveia preta e pousio descoberto, em preparo convencional e plantio direto, com tração
animal e tratorizada. Revista Brasileira de Ciência do Solo, 25(3):683-692, 2001.
LOMBARDI NETO, F.; BERTONI, J. Tolerância de perdas de terra para solos do estado de São Paulo.
Campinas: IAC, 1975. 12p. (BoletimTécnico, 28)
MARTINS, S.G. et al. Fator cobertura e manejo do solo e perdas de solo e água em cultivo de eucalipto e
em Mata Atlântica nos Tabuleiros Costeiros do estado do Espírito Santo. Scientia Forestalis, 38(87):517-526, 2010.
MATI, B.M. et al. Assessment of erosion hazard with the USLE and GIS: A case study of the Upper Ewaso Ng’ iro North basin of
Kenya. International Journal of Applied Earth Observation and Geoinformation, 2(2):78-86, 2000.
McCOOL, D.K.; BROWN, L.C.; FOSTER, G.R.
Revised slope steepness factor for the universal soil loss equation. Transactions of the ASAE, 30(5):1387-1396, 1987.
McCOOL, D.K. et al. Revised slope length factor for
the universal soil loss equation. Transactions of the ASAE, 32:1571-1576, 1989.
OLIVEIRA, A.H. et al. Water erosion in soils under
eucalyptus forest as affected by development stages and management systems. Ciência e Agrotecnologia, 37(1):159-169, 2013.
OLIVEIRA, F.P. et al. Potencial erosivo da chuva no Vale do Rio Doce, região Centro-Leste do Estado de Minas Gerais – Primeira aproximação. Ciência e Agrotecnologia, 33(6):1569-1577, 2009.
OLIVEIRA, A.H. et al. Development of topographic
factor modeling for application in soil erosion
models. In: SORIANO, M.C.H.Soil Processes and Current Trends in Quality Assessment. InTech, 2013, p. 111-138.
OZCAN, A.U. et al. Use of USLE/GIS technology
integrated with geostatistics to assess soil erosion risk in different land uses of Indagi Mountain Pass-Çankiri, Turkey. Environmental Geology, 53(8):1731-1741, 2008.
PIRES, L.S. et al. Erosão hídrica pós-plantio em florestas de eucalipto na região centro-leste de
Minas Gerais. Pesquisa Agropecuária Brasileira, 41(4):687-695, 2006.
RENARD, K.G. et al. Predicting soil erosion by water: a guide to conservation planning with the Revised Universal Soil Loss Equation (RUSLE).
[S.l.]: Government Printing Office, USDA, 1997.
RESENDE, M. Aplicações de conhecimentos pedológicos à conservação de solos. Informe Agropecuário, 11(128):3-18, 1985.
SEGANFREDO, M.L.; ELTZ, F.L.F.; BRUM, A.C.R. Perdas de solo, água e nutrientes por erosão
em sistemas de culturas em plantio direto. Revista Brasileira de Ciência do Solo, 21(2):287-291, 1997.
SILVA, M.A. et al. Avaliação e espacialização da erosividade da chuva no Vale do Rio Doce, região
Centro-Leste do Estado de Minas Gerais. Revista Brasileira de Ciência do Solo, 34(4):1029-1039, 2010.
SILVA, A.M. et al. Erosividade da chuva e
erodibilidade de Cambissolo e Latossolo na região de
Lavras, Sul de Minas Gerais. Revista Brasileira de Ciência do Solo, 33(6):1811-1820, 2009.
SILVA, M.A. et al. Sistemas de manejo em plantios florestais de eucalipto e perdas de solo e água na região do Vale do Rio Doce, MG. Revista Ciência Florestal, 21(4):765-776, 2011.
SILVA, M.L.N. et al. Estabilidade e resistência de
agregados de Latossolo Vermelho-Escuro cultivado
com sucessão milho-adubo verde. Pesquisa Agropecuária Brasileira, 33(1):97-103, 1998.
SLONEKER, L.L.; MOLDENHAUER, W.C. Measuring
amounts of crop residue remaining after tillage. Journal of Soil Water Conservation, 32(5):231-236, 1977.
SMITH R. M.; STAMEY W. L. How to establish
erosion tolerances. Journal of Soil Water Conservation, 19(3):110-111, 1964.
SRINIVAS, C.V. et al. Assessment of soil erosion
using remote sensing and GIS in Nagpur district, Maharashtra for prioritisation and delineation of
conservation units. Journal of the Indian Society of Remote Sensing, 30(4):197-212, 2002.
TOMAZONI, J.C.; GUIMARÃES, E. A sistematização dos fatores da EUPS em SIG para quantificação da erosão laminar na bacia do Rio Jirau. Revista Brasileira de Cartografia, 3(57):235-244, 2005.
WISCHMEIER, W.H.; SMITH, D.D. Predicting rainfall erosion losses: a guide to conservation
planning. Washington: USDA, 1978. 58p.
ZHANG, Y. et al. Integration of modified universal
soil loss equation (MUSLE) into a GIS framework to assess soil erosion risk. Land Degradation & Development, 20(84-91), 2009.
ZHOU, G.Y. et al. Hydrological impacts of