ABSTRACT: The objectives of this study were to determine the optimum plot size (Xo) and the number of replications to evaluate grain yield and verify the variability of Xo among oat cultivars. Thirty-two uniformity trials of 3 × 3 m were performed, being 8 from each cultivar (URS Charrua, URS Taura, URS Estampa, and URS Corona). Each uniformity trial was divided in 36 basic experimental units (BEU) of 0.5 × 0.5 m. Grain yield was determined in each BEU. The Xo was determined by the method of maximum curvature of the coefficient of variation model. Mean comparisons among cultivars were performed by the Scott-Knott test via bootstrap. The number of replications was calculated by an iterative process until convergence for experiments in completely randomized design (CRD) and randomized block
CRop pRoduCTion And MAnAgeMenT -
Article
Plot size and number of replications to evaluate
the grain yield in oat cultivars
André Lavezo, Alberto Cargnelutti Filho*, Cláudia Marques de Bem, Cláudia Burin, Jéssica Andiara Kleinpaul, Rafael Vieira Pezzini
Universidade Federal de Santa Maria - Centro de Ciências Rurais - Departamento de Fitotecnia - Santa Maria (RS), Brazil.
*Corresponding author: [email protected]
Received: Sept. 26, 2016 – Accepted: Dec. 6, 2016
design (RBD). Scenarios formed by i combinations (i = 3, 4, …, 50) treatments — with d least differences among treatment means to be detected as significant at 5% probability of type I error by Tukey test, expressed as a percentage of the overall experimental mean (d = 10%, 15%, 20%, 25%, 30%, 35%, 40%, and 45%) — were planned. The Xo of 1.57 m2 is enough to evaluate the grain yield in
these 4 oat cultivars. Four replications to evaluate grain yield with up to 50 treatments in the experimental designs of CRD and RBD are enough to identify significant differences among treatment means of 40.53% of the overall experimental mean, by Tukey test at 5% probability of type I error.
inTRoduCTion
Oat (Avena sativa L.) is the main winter grass grown in southern Brazil. Moreover, it is the fifth most cultivated cereal in Brazil, being placed among the 10 leading annual crops. Grain production during the 2014 agricultural year was 307,400 tonnes. The average yield was 2,000 kg∙ha−1 (Conab 2016).
Due to the relevance of oat cropping, several studies (Bortolini et al. 2005; Floss et al. 2007; Arlauskienė et al. 2011; Fontaneli et al. 2012; Guerreiro and Oliveira 2012; Meinerz et al. 2012; Siloriya et al. 2014; Zorovski et al. 2014; Hawerroth et al. 2015; Mantai et al. 2015) have been performed. These researches aimed to improve the knowledge and instigate increased grain yield. Researchers have used distinct plot size and number of replications in their experiments.
Researches analyzing grain yield have been developed with sizes of plot useful areas and number of replications of, respectively, 0.15 m2 and 3 (Meinerz et al. 2012), 2 m2 and 3 (Floss et al. 2007), 3 m2 and 4 (Mantai et al. 2015), 3 m2 and 4 (Hawerroth et al. 2015), 5 m2 and 6 (Guerreiro and Oliveira 2012), 10.5 m2 and 3 (Zorovski et al. 2014), 12 m2 and 4 (Siloriya et al. 2014), 12 m2 and 3 (Bortolini et al. 2005), 23.8 m2 and 4 (Fontaneli et al. 2012), and 30 m2 and 3 (Arlauskienė et al. 2011). Inadequate plot size and number of replications can increase the experimental error and the inferences regarding the treatments can be inaccurate (Banzatto and Kronka 2013). Thus, plot size and number of replicates can effectively reduce or increase the deleterious effects of the experimental error (Frazer et al. 2011).
In addition, the correct sizing of plot size and number is preponderant to obtain accurate results on the treatments under evaluation (Zald et al. 2014) and makes experimentation a decisive act to improve agricultural results in consequent crops (Maat 2011).
The optimum plot size (Xo) can be determined from data obtained in uniformity trials or blank experiments (trials without treatments) (Ramalho et al. 2012; Storck et al. 2016). The method of maximum curvature of the coefficient of variation model proposed by Paranaíba et al. (2009a) was considered adequate to obtain Xo in grass species such as rice (Paranaíba et al. 2009a) and wheat (Paranaíba et al. 2009b). In the literature consulted, the determination of the optimal plot size in white oats was not found. In this sense,
it is necessary to carry out research that addresses this estimation, and it is assumed that the plot size and the number of replications can be distinct among oat cultivars.
Thus, the objectives of this study were to determine Xo and the number of replications to evaluate grain yield and verify the variability of Xo among oat cultivars.
MATeRiAL And MeTHodS
Thirty-two uniformity trials were carried out with oat (Avena sativa L.) in Santa Maria, state of Rio Grande do Sul, located at lat 29°42′S, long 53°49′W and 95 m of altitude during the 2014 agricultural year. From these 32 uniformity trials, 8 were carried out with the cultivar URS Charrua, 8 with the cultivar URS Taura, 8 with the cultivar URS Estampa, and 8 with the cultivar URS Corona. The plant density was 350 plants∙m−2, sown by broadcasting on 28 April 2014. The basic fertilization was performed with 21 kg∙ha−1 of N, 88 kg∙ha−1 of P
2O5, and 88 kg∙ha −1 of K
2O. Subsequently, 2 topdressing fertilization of 45 kg∙ha−1 of N were performed. The cultural practices were carried out homogeneously throughout the experimental area.
Each uniformity trail with size of 3 × 3 m (9 m2) was divided in 36 basic experimental units (BEU) of 0.5 × 0.5 m (0.25 m2), forming a matrix with 6 rows and 6 columns. At 150 days after sowing, panicles were weighed in each BEU during the crop maturation. Following, a sample of 10 panicles per cultivar was randomly collected to perform threshing and estimation of grain proportion in relation to straw amount. Grain moisture was determined, the straw percentage was discounted through the grain/straw relation, and the weight of each BEU in grain yield (YLD) was estimated in g∙0.25 m−2 at 13% moisture.
following sequence was covered: beginning the pathway from the BEU located in row 1, column 1 to row 6, column 1, returning from row 6, column 2 until row 1, column 2, and so on until completing the pathway at BEU located in row 1, column 6.
Subsequently, Xo was determined by the method of maximum curvature of the coeffi cient of variation model (Paranaíba et al. 2009a) in each of the 32 trials, through the formula
in percentage, in the expression for the calculation of d, and isolating r, we have
where Xo is the plot size; ρ is the fi rst-order spatial auto-correlation coeffi cient; s2 is the variance; m is the mean.
Th e coeffi cient of variation in the optimum plot size (CVXo), in percentage, was determined by the formula
(1)
(2)
(3)
(4) Th us, 8 estimates of ρ, s2, m, CV, Xo, and CV
Xo were obtained for each cultivar. Th e mean comparison of these statistics among cultivars (n = 8 uniformity trials per cultivar) was performed by the Scott-Knott test by bootstrap analysis with 10,000 resampling at 5% probability. Th e bootstrap analysis was carried out from the already performed estimates of ρ, s2, m, CV, Xo, and CV
Xo, in which, for each estimate, the cultivars were compared in each sampling, which was accomplished 10,000 times, obtaining as a result the average of these resampling.
The least significant difference (d) of the Tukey test, expressed in percentage of the overall experimental mean, is estimated by the formula
where: qα(i;DFE)is the critical value of Tukey test at α level of probability (α = 0.05, in this study); i is the number of treatments; DFE is the number of error degrees of freedom, i.e., i(r − 1) for a completely randomized design (CRD) and (i − 1)(r − 1) for a randomized block design (RBD); MSE is the mean square error; r is the number of replications; m is the overall experimental mean.
Substituting the formula of the coeffi cient of experimental variation
(5)
Th e coeffi cient of experimental variation of this expression corresponds to CVXo and is expressed in percentage because it is the expected CV for the experiment with the determined Xo (Cargnelutti Filho et al. 2014b). From the greatest mean of CVXo from cultivars, r was determined by an iterative process through Equation 5 until convergence for experiments in CRD and RBD in scenarios formed by i combinations (i = 3, 4, …, 50) and d (d = 10%, 15%, 20%, 25%, 30%, 35%, 40%, and 45%). Statistical analyzes were performed using Microsoft ® Offi ce Excelapplication and
Sisvar® soft ware (Ferreira 2014).
ReSuLTS And diSCuSSion
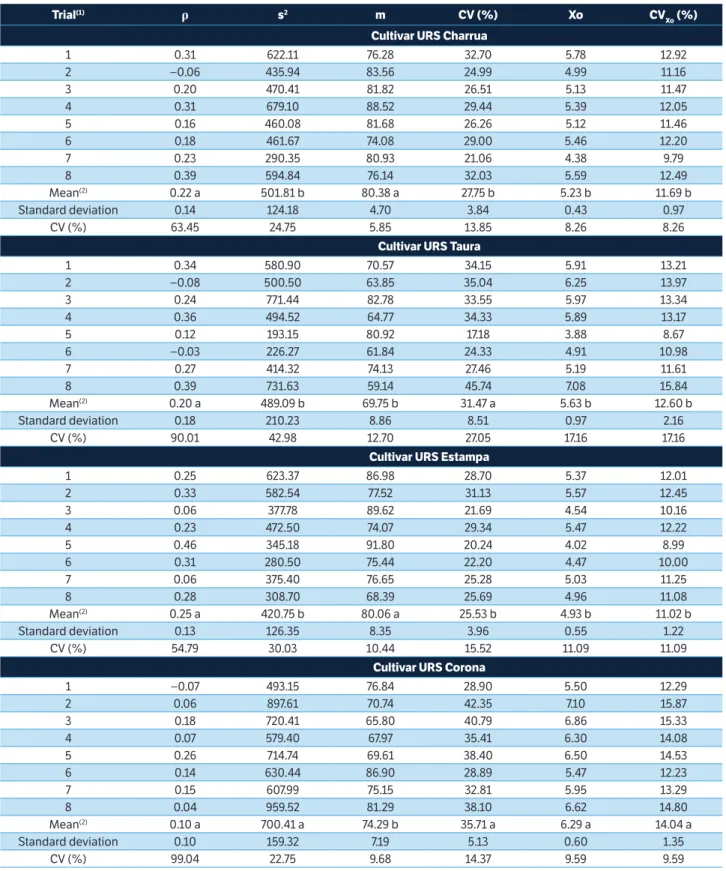
For oat (Avena sativa L.) grain yield data, there was variability in estimates of ρ, s2, m, CV, Xo, and CV
Xo (Table 1). Th e variability obtained among the trials in the estimation of each statistic fl uctuated between 5.85 and 63.45% for the cultivar URS Charrua, between 12.70 and 90.01% for the cultivar URS Taura, between 10.44 and 54.79% for the cultivar URS Estampa, and between 9.59 and 99.04% for the cultivar URS Corona (Table 1).
A wide variability of the statistics ρ, s2, m, CV, Xo, and CVXo among uniformity trials was also observed in black oat (Cargnelutti Filho et al. 2014a) and millet (Burin et al. 2015; Burin et al. 2016). Based on this variability, it can be inferred that the database of 32 uniformity trials (8 uniformity trials of each cultivar) is adequate for the estimation of Xo and number of replications because it contemplates distant variability scenarios.
Th e values of ρ did not diff er among cultivars by the Scott-Knott test (Table 1). However, diff erences were observed among cultivars for s2, m, and CV. Consequently, Xo and CVXo also differed (Table 1) because these statistics are calculated as a function of ρ, s2, and m in the method of maximum curvature of the coeffi cient of variation model (Paranaíba et al. 2009a).
Trial(1) ρ s2 m CV (%) Xo CV Xo (%)
Cultivar uRS Charrua
1 0.31 622.11 76.28 32.70 5.78 12.92
2 −0.06 435.94 83.56 24.99 4.99 11.16
3 0.20 470.41 81.82 26.51 5.13 11.47
4 0.31 679.10 88.52 29.44 5.39 12.05
5 0.16 460.08 81.68 26.26 5.12 11.46
6 0.18 461.67 74.08 29.00 5.46 12.20
7 0.23 290.35 80.93 21.06 4.38 9.79
8 0.39 594.84 76.14 32.03 5.59 12.49
Mean(2) 0.22 a 501.81 b 80.38 a 27.75 b 5.23 b 11.69 b
Standard deviation 0.14 124.18 4.70 3.84 0.43 0.97
CV (%) 63.45 24.75 5.85 13.85 8.26 8.26
Cultivar uRS Taura
1 0.34 580.90 70.57 34.15 5.91 13.21
2 −0.08 500.50 63.85 35.04 6.25 13.97
3 0.24 771.44 82.78 33.55 5.97 13.34
4 0.36 494.52 64.77 34.33 5.89 13.17
5 0.12 193.15 80.92 17.18 3.88 8.67
6 −0.03 226.27 61.84 24.33 4.91 10.98
7 0.27 414.32 74.13 27.46 5.19 11.61
8 0.39 731.63 59.14 45.74 7.08 15.84
Mean(2) 0.20 a 489.09 b 69.75 b 31.47 a 5.63 b 12.60 b
Standard deviation 0.18 210.23 8.86 8.51 0.97 2.16
CV (%) 90.01 42.98 12.70 27.05 17.16 17.16
Cultivar uRS estampa
1 0.25 623.37 86.98 28.70 5.37 12.01
2 0.33 582.54 77.52 31.13 5.57 12.45
3 0.06 377.78 89.62 21.69 4.54 10.16
4 0.23 472.50 74.07 29.34 5.47 12.22
5 0.46 345.18 91.80 20.24 4.02 8.99
6 0.31 280.50 75.44 22.20 4.47 10.00
7 0.06 375.40 76.65 25.28 5.03 11.25
8 0.28 308.70 68.39 25.69 4.96 11.08
Mean(2) 0.25 a 420.75 b 80.06 a 25.53 b 4.93 b 11.02 b
Standard deviation 0.13 126.35 8.35 3.96 0.55 1.22
CV (%) 54.79 30.03 10.44 15.52 11.09 11.09
Cultivar uRS Corona
1 −0.07 493.15 76.84 28.90 5.50 12.29
2 0.06 897.61 70.74 42.35 7.10 15.87
3 0.18 720.41 65.80 40.79 6.86 15.33
4 0.07 579.40 67.97 35.41 6.30 14.08
5 0.26 714.74 69.61 38.40 6.50 14.53
6 0.14 630.44 86.90 28.89 5.47 12.23
7 0.15 607.99 75.15 32.81 5.95 13.29
8 0.04 959.52 81.29 38.10 6.62 14.80
Mean(2) 0.10 a 700.41 a 74.29 b 35.71 a 6.29 a 14.04 a
Standard deviation 0.10 159.32 7.19 5.13 0.60 1.35
CV (%) 99.04 22.75 9.68 14.37 9.59 9.59
Table 1. First-order autocorrelation coefficient, variance, mean, coefficient of variation of the trial, optimum plot size (in number of BEU of 0.25 m2), and coefficient of variation in the optimum plot size for grain yield (g∙0.25 m−2) of 8 trials of the 4 oat cultivars (Avena sativa L.)
.
(((1)Each uniformity trial of 3 × 3 m (9 m2) size was divided in 36 basic experimental units of 0.5 × 0.5 m (0.25 m2), forming a matrix with 6 rows and 6 columns; (2)For each statistic (ρ, s2, m, CV, Xo, and CV
Xo), means not followed by the same letter in the column (mean comparison among cultivars) differ at 5% probability by the Scott-Knott test via bootstrap analysis with 10,000 resampling. ρ = First-order autocorrelation coefficient; s2 = Variance; m = Mean; CV = Coefficient of variation of the trial; Xo = Optimum plot size; CV
differing from the cultivars URS Taura (69.75 g∙0.25 m−2 or 2,790.0 kg∙ha−1) and URS Corona (74.29 g∙0.25 m−2 or 2,971.6 kg∙ha−1). An oat grain yield similar to that found in this study was obtained in Bortolini et al. (2005) with a maximum of 3,649 kg∙ha−1, in Floss et al. (2007) with a maximum of 3,318 kg∙ha−1, in Arlauskienė et al. (2011) with a maximum of 2,897 kg∙ha−1, in Meinerz et al. (2012) with a maximum of 2,385 kg∙ha−1, in Siloriya et al. (2014) with a maximum of 3,640 kg∙ha−1, and in Zorovski et al. (2014) with a maximum of 4,218.9 kg∙ha−1.
Nörnberg et al. (2014) evaluated the oat cultivars yield performance and obtained wide variability of grain yield response, i.e., between 173 and 4,978 kg∙ha−1, enabling to highlight the different responses obtained among the cultivars of this study. Thus, it is highlighted that, in general, the crop exhibited adequate development and great yield potential, reproducing real field conditions. This scenario of proper crop development and wide variability provides credibility to the database for dimensioning Xo and the number of replications.
The cultivars URS Taura and URS Corona obtained greater means of CV, with 31.47 and 35.71%, respectively, differing from the cultivars URS Charrua (27.75%) and URS Estampa (25.53%). Coefficients of variation of this magnitude are above the observed value of 11.97% in a study performed by Nörnberg et al. (2014) evaluating the oat cultivars yield performance. Further, they are above those obtained by Meinerz et al. (2012), with CV of 4.63%, when evaluating the yield performance of winter cereals. Also, they are above the values of 9 to 18% obtained in a study conducted by Fontaneli et al. (2012) on the crop-livestock integration system.
It should be emphasized that these high (27.75 and 25.53%) and very high (31.47 and 35.71) values of CV obtained in this study, as reported by Pimentel-Gomes (2009) in principle, may indicate low experimental precision in the conduction of uniformity trials. However, high CV in this study were obtained with BEU of 0.5 × 0.5 m (0.25 m2), which suggests that greater plot sizes should be planned to improve experimental accuracy. As mentioned by Smiderle et al. (2014) in the study of experimental plots size for the selection of common bean genotypes, the high estimates of CVs are acceptable due to the fact that usually the experiments carried out in the field present greater estimates for this statistic due to less experimental error control.
The mean of Xo (6.29 BEU or 1.57 m2) and CV
Xo (14.04%) of the 8 uniformity trials with the cultivar URS Corona were greater than the means of the trials with the cultivars URS Charrua (Xo = 5.23 BEU, CVXo = 11.69%), URS Taura (Xo = 5.63 BEU, CVXo = 12.60%), and URS Estampa (Xo = 4.93 BEU, CVXo = 11.02%) (Table 1). Therefore, in practice, facing this scenario of Xo variability between cultivars, an experimental design should be carried out from the larger plot size in order to ensure satisfactory precision. In Frazer et al. (2011), the authors mention that the plot size should be sufficient to minimize the experimental error and to account for all existing variability; in addition, the magnitude of the experimental error tends to decrease considerably with the plot size increase. Thus, it can be inferred that Xo to evaluate the oat grain yield is 6.29 BEU of 0.25 m2 (1.57 m2) and the CV value in this Xo is 14.04%. In the searched literature, Xo studies to evaluate the oat grain yield were not found to be compared with this research. Meanwhile, in crops belonging to the same family (Poaceae), such as the evaluation of wheat grain yield, Henriques Neto et al. (2004) defined, by the methods of maximum curvature, maximum modified curvature, comparison of variances, and the Hatheway method, Xo ranging between 1.6 and 2.4 m2 of useful area. For the measurement of sorghum grain yield, Lopes et al. (2005) established Xo = 3.2 m2 based on methods of maximum modified curvature, maximum curvature as a function of the variance, and the maximum curvature as a function of the coefficient of variation. In this context, it was found that estimates of Xo were different for the grain yield evaluation of those crops, being close to the values obtained in this study.
attention should be paid when using Xo in order to obtain accurate information of the treatments under evaluation. The comparison between the optimum size obtained in this study with plot sizes used in the aforementioned ones should be viewed with caution because there are differences in cultivars, plant densities, and crop management.
In CRD, concerning scenarios formed by combinations of i treatments (i = 3, 4, …, 50) and least differences among treatment means to be detected as significant at 5% probability of type I error by Tukey test, expressed in percentage of the overall experimental mean (d = 10%, 15%, 20%, 25%, 30%, 35%, 40%, and 45%), in order to
i 10% 15% 20% 25% 30% 35% 40% 45% 10% 15% 20% 25% 30% 35% 40% 45%
Completely randomized design Randomized block design
3 22.68 10.68 6.52 4.61 3.60 3.00 1.93 1.60 23.18 11.18 7.00 5.10 3.98 3.03 1.96 1.83
4 26.88 12.45 7.43 5.12 3.89 3.17 2.67 1.67 27.16 12.73 7.71 5.40 4.16 3.45 2.68 1.91
5 30.08 13.81 8.13 5.52 4.13 3.31 2.79 2.01 30.27 13.99 8.32 5.71 4.31 3.51 2.96 2.01
6 32.68 14.91 8.71 5.86 4.33 3.42 2.86 2.51 32.81 15.04 8.84 5.99 4.46 3.56 3.00 2.65
7 34.87 15.84 9.20 6.14 4.50 3.53 2.91 2.51 34.96 15.94 9.30 6.24 4.60 3.63 3.01 2.61
8 36.76 16.65 9.63 6.39 4.65 3.62 2.96 2.53 36.84 16.73 9.71 6.47 4.73 3.70 3.05 2.61
9 38.43 17.37 10.01 6.62 4.79 3.71 3.02 2.56 38.49 17.43 10.07 6.68 4.86 3.77 3.08 2.62
10 39.92 18.01 10.35 6.82 4.92 3.79 3.07 2.59 39.97 18.06 10.41 6.88 4.97 3.84 3.12 2.64
11 41.27 18.59 10.67 7.01 5.04 3.86 3.11 2.61 41.32 18.64 10.71 7.06 5.08 3.91 3.16 2.66
12 42.51 19.13 10.95 7.18 5.15 3.93 3.16 2.64 42.55 19.17 10.99 7.22 5.19 3.97 3.20 2.68
13 43.65 19.62 11.22 7.34 5.25 4.00 3.20 2.67 43.68 19.65 11.25 7.38 5.28 4.03 3.24 2.70
14 44.70 20.08 11.47 7.49 5.34 4.06 3.24 2.69 44.73 20.10 11.50 7.52 5.37 4.09 3.27 2.72
15 45.68 20.50 11.70 7.63 5.43 4.12 3.28 2.71 45.71 20.53 11.72 7.66 5.46 4.15 3.31 2.74
16 46.60 20.90 11.91 7.76 5.52 4.18 3.32 2.74 46.62 20.92 11.94 7.79 5.54 4.20 3.34 2.76
17 47.47 21.28 12.12 7.89 5.60 4.23 3.35 2.76 47.49 21.30 12.14 7.91 5.62 4.25 3.37 2.79
18 48.28 21.63 12.31 8.01 5.68 4.28 3.39 2.78 48.30 21.65 12.33 8.02 5.69 4.30 3.41 2.81
19 49.06 21.97 12.49 8.12 5.75 4.33 3.42 2.81 49.07 21.98 12.51 8.13 5.77 4.35 3.44 2.83
20 49.79 22.29 12.67 8.22 5.82 4.38 3.45 2.83 49.80 22.30 12.68 8.24 5.83 4.39 3.47 2.85
21 50.49 22.59 12.84 8.33 5.89 4.42 3.48 2.85 50.50 22.61 12.85 8.34 5.90 4.44 3.50 2.87
22 51.15 22.88 12.99 8.42 5.95 4.47 3.51 2.87 51.16 22.89 13.01 8.44 5.96 4.48 3.53 2.88
23 51.79 23.16 13.15 8.52 6.01 4.51 3.54 2.89 51.80 23.17 13.16 8.53 6.02 4.52 3.55 2.90
24 52.40 23.43 13.29 8.61 6.07 4.55 3.57 2.91 52.41 23.44 13.30 8.62 6.08 4.56 3.58 2.92
25 52.98 23.68 13.43 8.69 6.13 4.59 3.60 2.93 52.99 23.69 13.44 8.70 6.14 4.60 3.61 2.94
26 53.55 23.93 13.57 8.78 6.18 4.62 3.62 2.95 53.55 23.94 13.58 8.79 6.19 4.64 3.63 2.96
27 54.09 24.17 13.70 8.86 6.24 4.66 3.65 2.96 54.10 24.17 13.71 8.87 6.24 4.67 3.66 2.97
28 54.61 24.39 13.82 8.94 6.29 4.70 3.67 2.98 54.62 24.40 13.83 8.94 6.30 4.71 3.68 2.99
29 55.11 24.61 13.94 9.01 6.34 4.73 3.70 3.00 55.12 24.62 13.95 9.02 6.35 4.74 3.71 3.01
30 55.60 24.83 14.06 9.08 6.39 4.77 3.72 3.01 55.61 24.84 14.07 9.09 6.39 4.77 3.73 3.02
31 56.07 25.03 14.18 9.15 6.43 4.80 3.74 3.03 56.08 25.04 14.18 9.16 6.44 4.81 3.75 3.04
32 56.53 25.23 14.29 9.22 6.48 4.83 3.77 3.05 56.54 25.24 14.29 9.23 6.49 4.84 3.77 3.05
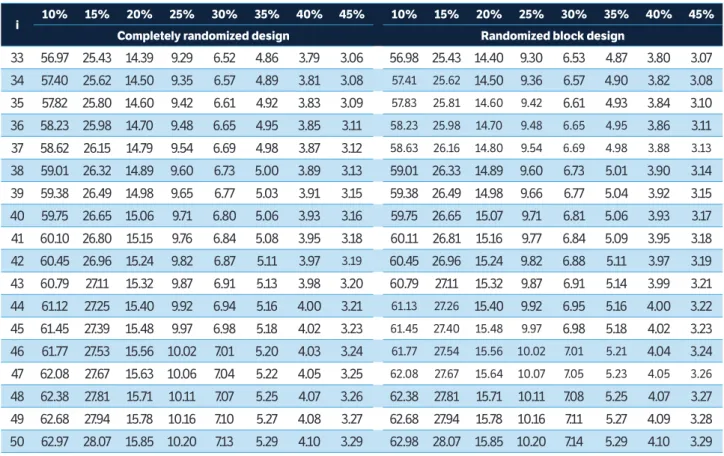
Table 2. Number of replications to evaluate oat (Avena sativa L.) grain yield in experiments in completely randomized design and randomized block design in scenarios formed by combinations of i treatments (i = 3, 4, …, 50) and d least differences between treatment means to be detected as significant at 5% probability of type I error by Tukey test, expressed in percentage of the overall experimental mean (d = 10%, 15%, 20%, 25%, 30%, 35%, 40%, and 45%) from the optimum plot size (Xo = 6.29 BEU or 1.57 m2) and coefficient of variation in the optimum
plot size (CVXo = 14.04%).
Table 2. Continuation...
i 10% 15% 20% 25% 30% 35% 40% 45% 10% 15% 20% 25% 30% 35% 40% 45%
Completely randomized design Randomized block design
33 56.97 25.43 14.39 9.29 6.52 4.86 3.79 3.06 56.98 25.43 14.40 9.30 6.53 4.87 3.80 3.07
34 57.40 25.62 14.50 9.35 6.57 4.89 3.81 3.08 57.41 25.62 14.50 9.36 6.57 4.90 3.82 3.08
35 57.82 25.80 14.60 9.42 6.61 4.92 3.83 3.09 57.83 25.81 14.60 9.42 6.61 4.93 3.84 3.10
36 58.23 25.98 14.70 9.48 6.65 4.95 3.85 3.11 58.23 25.98 14.70 9.48 6.65 4.95 3.86 3.11
37 58.62 26.15 14.79 9.54 6.69 4.98 3.87 3.12 58.63 26.16 14.80 9.54 6.69 4.98 3.88 3.13
38 59.01 26.32 14.89 9.60 6.73 5.00 3.89 3.13 59.01 26.33 14.89 9.60 6.73 5.01 3.90 3.14
39 59.38 26.49 14.98 9.65 6.77 5.03 3.91 3.15 59.38 26.49 14.98 9.66 6.77 5.04 3.92 3.15
40 59.75 26.65 15.06 9.71 6.80 5.06 3.93 3.16 59.75 26.65 15.07 9.71 6.81 5.06 3.93 3.17
41 60.10 26.80 15.15 9.76 6.84 5.08 3.95 3.18 60.11 26.81 15.16 9.77 6.84 5.09 3.95 3.18
42 60.45 26.96 15.24 9.82 6.87 5.11 3.97 3.19 60.45 26.96 15.24 9.82 6.88 5.11 3.97 3.19
43 60.79 27.11 15.32 9.87 6.91 5.13 3.98 3.20 60.79 27.11 15.32 9.87 6.91 5.14 3.99 3.21
44 61.12 27.25 15.40 9.92 6.94 5.16 4.00 3.21 61.13 27.26 15.40 9.92 6.95 5.16 4.00 3.22
45 61.45 27.39 15.48 9.97 6.98 5.18 4.02 3.23 61.45 27.40 15.48 9.97 6.98 5.18 4.02 3.23
46 61.77 27.53 15.56 10.02 7.01 5.20 4.03 3.24 61.77 27.54 15.56 10.02 7.01 5.21 4.04 3.24
47 62.08 27.67 15.63 10.06 7.04 5.22 4.05 3.25 62.08 27.67 15.64 10.07 7.05 5.23 4.05 3.26
48 62.38 27.81 15.71 10.11 7.07 5.25 4.07 3.26 62.38 27.81 15.71 10.11 7.08 5.25 4.07 3.27
49 62.68 27.94 15.78 10.16 7.10 5.27 4.08 3.27 62.68 27.94 15.78 10.16 7.11 5.27 4.09 3.28
50 62.97 28.07 15.85 10.20 7.13 5.29 4.10 3.29 62.98 28.07 15.85 10.20 7.14 5.29 4.10 3.29
evaluate the oat grain yield, the number of replications for experiments ranged from 3.60 (i = 3 and d = 30%) to 62.97 (i = 50 and d = 10%) (Table 2); in RBD, it was 3.98 (i = 3 and d = 30%) to 62.98 (i = 50 and d = 10%) (Table 2). Th erefore, in experiments with 50 treatments and greater experimental precision (d = 10%), the required number of replications is 62.98 (63 replications) for the measurement of oat grain yield in CRD and RBD. Hence, obtaining a precision of 10% (greater precision) is impractical due to the infeasibility of conducting experiments with this elevated number of replications. Based on the obtained plot size (Xo = 1.57 m2), the user of the information from this study can evaluate treatments combination, least differences between treatment means, and number of replications possible to be used (Table 2).
Fixing Xo, CVXo, and d with the increase in the number of treatments, the number of replications increases regardless of the experimental design (CRD or RBD) (Cargnelutti Filho et al. 2014a) (Table 2). Furthermore, the number of replications for RBD and CRD approximates with an increasing number of treatments. For fi xed values of Xo, CVXo, i, and d, the number of replications in the RBD is greater in relation to
the CRD, which confi rms the highest effi ciency of CRD in relation to RBD, when there is absence of variability in the experimental units (plots) (Storck et al. 2016).
In order to evaluate 50 treatments, with d = 45%; 3.286 and 3.289 rep lications are required for CRD and RBD. In practice, these replication values cannot be used in fi eld experiments. Th erefore, the correct is rounded up, obtaining 4 replications. Studies have been performed with this number (Fontaneli et al. 2012; Nörnberg et al. 2014; Siloriya et al. 2014; Hawerroth et al. 2015; Mantai et al. 2015), showing the feasibility of performing experiments with 4 replications, having been considered the number of repetitions commonly used. However, this should be discussed with caution, since it depends on the utilized plot size.
Using the d formula of Tukey test, expressed in percentage of the overall experiment mean,
(5)
Arlauskienė, A., Maikštėnienė, S., Šarūnaitė, L., Kadžiulienė, Ž., Deveikytė, I., Žėkaitė, V. and Česnulevičienė, R. (2011). Competitiveness and productivity of organically grown pea and spring cereal intercrops. Žemdirbystė=Agriculture, 98, 339-348.
Banzatt o, D. A. and Kronka, S. N. (2013) Experimentação agrícola. 4. ed. Jaboticabal: Funep.
Bortolini, P. C., Moraes, A. and Carvalho, P. C. F. (2005). Forage and grain yield of white oat under grazing. Revista Brasileira
de Zootecnia, 34, 2192-2199. http://dx.doi.org/10.1590/
S1516-35982005000700005.
Burin, C., Cargnelutt i Filho, A., Alves, B. M., Toebe, M. and Kleinpaul, J. A. (2016). Plot size and number of replicates in times of sowing and cuts of millet. Revista Brasileira de Engenharia Agrícola e Ambiental, 20, 119-127. http://dx.doi.org/10.1590/1807-1929/ agriambi.v20n2p119-127.
Burin, C., Cargnelutt i Filho, A., Alves, B. M., Toebe, M., Kleinpaul, J. A. and Neu, I. M. M. (2015). Plot size and number of repetitions in evaluation times in millet crop. Bragantia, 74, 261-269. htt p:// dx.doi.org/10.1590/1678-4499.0465.
of d = 40.51 and 40.53% were obtained for CRD and RBD, respectively. Th us, it can be inferred that, regardless of the experimental design, 4 replications to evaluate grain yield with up to 50 treatments are enough to identify signifi cant diff erences among treatment means of 40.53% of the overall experimental mean, by Tukey test at 5% probability of type I error.
Therefore, the correct use of plot size (Xo = 1.57 m2) and number of replications (r = 4) to evaluate the oat grain yield enables differences between treatment means of 40.53% of the overall experimental mean, being significant for the treatments under evaluation. As mentioned by Cargnelutti Filho et al. (2014b), the dimensioning of Xo and r enables the reduction in the experimental error, wherein experiments are aimed to detect significant differences between the tested treatments, which depends on the experimental error (Banzatto and Kronka 2013). Thus, the experimental error is amortized with the proper dimensioning of the plot size as well as number of replications, and accurate results are obtained (Zald et al. 2014).
ConCLuSion
Th ere is variability in Xo among the cultivars, and the value to evaluate the oat grain yield is 1.57 m2.
Four replications to evaluate grain yield with up to 50 treatments in CRD and RBD are enough to identify signifi cant diff erences among treatment means of 40.53% of the overall experimental mean, by Tukey test at 5% probability of type I error.
ACKnoWLedgeMenTS
We thank the Brazilian National Council for Scientifi c and Technological Development (CNPq), the Coordination for the Improvement of Higher Education Personnel (CAPES), and the Rio Grande do Sul Research Foundation (FAPERGS) for granting scholarships. Our acknowledgement to the Ponteio Seeds Company, for donating the oat seeds that were used in this study, as well as scholarship students and volunteers for their help in data collection.
ReFeRenCeS
Cargnelutt i Filho, A., Alves, B. M., Toebe, M., Burin, C., Santos, G. O., Facco, G., Neu, I. M. M. and Stefanello, R. B. (2014a). Plot size and number of repetitions in black oat. Ciência Rural, 44, 1732-1739.
htt p://dx.doi.org/10.1590/0103-8478cr20131466.
Cargnelutt i Filho, A., Toebe, M., Burin, C., Casarott o, G. and Alves, B. M. (2014b). Experimental designs in turnip sown to haul and in line. Bioscience Journal, 30, 677-686.
Companhia Nacional de Abastecimento (2016). Acompanhamento da safra brasileira de grãos, v. 3, n. 4. Safra 2015/2016. Quarto Levantamento; [accessed 2017 June 1]. htt p://www.conab.gov. br/OlalaCMS/uploads/arquivos/16_01_12_14_17_16_boletim_ graos_janeiro_2016.pdf
Ferreira, D. F. (2014). Sisvar: A guide for its bootstrap procedures in multiple comparisons. Ciência e Agrotecnologia, 38, 109-112. htt p://dx.doi.org/10.1590/S1413-70542014000200001.
Fontaneli, R. S., Santos, H. P., Fontaneli, R. S. and Lampert, E. A. (2012). Grain yield of white oats in integrated crop-livestock production systems, in no-tillage system. Revista Brasileira de Ciências Agrárias, 7, 790-796.
Frazer, G. W., Magnussen, S., Mulder, M. A. and Niemann, K. O. (2011). Simulated impact of sample plot size and co-registration error on the accuracy and uncertainty of LiDAR-derived estimates of forest stand biomass. Remote Sensing of Environment, 115, 636-649. http://dx.doi.org/10.1016/j.rse.2010.10.008.
Guerreiro, R. M. and Oliveira, N. C. (2012). Produtividade de grãos de aveia branca submetida a doses de trinexapac-ethyl. Campo Digital: Revista Ciências Exatas e da Terra e Ciências Agrárias, 7, 27-36.
Hawerroth, M. C., Silva, J. A. G., Souza, C. A., Oliveira, A. C., Luche, H. S., Zimmer, C. M., Hawerroth, F. J., Schiavo, J. and Sponchiado, J. C. (2015). Lodging reduction in white oat using the plant growth regulator trinexapac-ethyl. Pesquisa Agropecuária Brasileira, 50, 115-125. http://dx.doi.org/10.1590/S0100-204X2015000200003.
Henriques Neto, D., Sediyama, T., Souza, M. A., Cecon, P. R., Yamanaka, C. H., Sediyama, M. A. N. and Viana, A. E. S. (2004). Plot size in experiments with wheat irrigated under no-tillage and conventional tillage. Pesquisa Agropecuária Brasileira, 39, 517-524.
http://dx.doi.org/10.1590/S0100-204X2004000600001.
Lopes, S. J., Storck, L., Lúcio, A. D., Lorentz, L. H., Lovato, C. and Dias, V. O. (2005). Experimental plot size in grain sorghum in different plant densities. Pesquisa Agropecuária Brasileira, 40, 525-530. http://dx.doi.org/10.1590/S0100-204X2005000600001.
Maat, H. (2011). The history and future of agricultural experiments. NJAS - Wageningen Journal of Life Sciences, 57, 187-195. http:// dx.doi.org/10.1016/j.njas.2010.11.001.
Mantai, R. D., Silva, J. A. G., Sausen, A. T. Z. R., Costa, J. S. P., Fernandes, S. B. V. and Ubessi, C. (2015). Efficiency in the production of biomass and oat grains by the use of nitrogen. Revista Brasileira de Engenharia Agrícola e Ambiental, 19, 343-349. http://dx.doi. org/10.1590/1807-1929/agriambi.v19n4p343-349.
Meinerz, G. R., Olivo, C. J., Fontaneli, R. S., Agnolin, C. A., Horst, T. and Bem, C. M. (2012). Productivity of double-purpose winter cereals in the Depressão Central region of Rio Grande do Sul state. Revista Brasileira de Zootecnia, 41, 873-882. http://dx.doi. org/10.1590/S1516-35982012000400007.
Nörnberg, R., Ribeiro, G., Silveira, G., Luche, H. S., Baretta, D., Tessmann, E. W., Woyann, L. G. and Oliveira, A. C. (2014). Adaptability and stability of white oat genotypes. Revista Acadêmica Ciência Agrária Ambiental, 12, 181-190. http://dx.doi.org/10.7213/ academica.12.03.AO03.
Paranaíba, P. F., Ferreira, D. F. and Morais, A. R. (2009a). Optimum experimental plot size: Proposition of estimation methods. Revista Brasileira de Biometria, 27, 255-268.
Paranaíba, P. F., Morais, A. R. and Ferreira, D. F. (2009b). Optimum experimental plot size: Comparison of estimation methods in real examples with Wheat and Cassava. Revista Brasileira de Biometria, 27, 81-90.
Pimentel-Gomes, F. (2009). Curso de estatística experimental. 15. ed. Piracicaba: Fealq.
Ramalho, M. A. P., Ferreira, D. F. and Oliveira, A. C. (2012). Experimentação em genética e melhoramento de plantas. Lavras: UFLA.
Siloriya, P. N., Rathi, G. S. and Meena, V. D. (2014). Relative performance of oat (Avena sativa L.) varieties for their growth
and seed yield. African Journal of Agricultural Research, 9, 425-431. http://dx.doi.org/10.5897/AJAR2013.8165.
Smiderle, E. C., Botelho, F. B. S., Guilherme, S. R., Arantes, S. A. C. M., Botelho, R. T. C. and Arantes, K. R. (2014). Optimal size experimental plots for the selection of genotypes of bean. Comunicata Scientiae, 5, 51-58.
Storck, L., Garcia, D. C., Lopes, S. J. and Estefanel, V. (2016). Experimentação vegetal. 3. ed. Santa Maria: UFSM.
Zald, H. S. J., Ohmann, J. L., Roberts, H. M., Gregory, M. J., Henderson, E. B., McGaughey, R. J. and Braaten, J. (2014). Influence of lidar, Landsat imagery, disturbance history, plot location accuracy, and plot size on accuracy of imputation maps of forest composition and structure. Remote Sensing of Environment, 143, 26-38. http:// dx.doi.org/10.1016/j.rse.2013.12.013.
Zorovski, P., Georgieva, T., Savova, T., Gotcheva, V. and Spasova, D. (2014). Productivity potential of wintering oat genotypes (Avena
sativa L.) under the south Bulgaria agroecological conditions.