Article
Printed in Brazil - ©2012 Sociedade Brasileira de Química0103 - 5053 $6.00+0.00
A
*e-mail: [email protected]
RP TLC-Based Lipophilicity Assessment of Some Natural and Synthetic Coumarins
El Hadi M. A. Rabtti,a Maja M. Natić,a Dušanka M. Milojković-Opsenica,a
Jelena Ð. Trifković,a Ivan M. Vučković,a Vlatka E. Vajsb and Živoslav Lj. Tešić*,a
aFaculty of Chemistry, University of Belgrade, P. O. Box 51, 11158 Belgrade, Serbia
bInstitute of Chemistry, TechnologyandMetallurgy, University of Belgrade,
Njegoševa 12, 11000 Belgrade, Serbia
O caráter lipofílico de doze cumarinas foi investigado por cromatografia de camada fina de fase reversa (RP TLC) em sílica RP-18. Três diferentes sistemas de solvente binário compostos por água e o modificador orgânico (metanol, tetrahidrofurano ou acetonitrilo) foram utilizados para determinar o parâmetro de retenção (RM0) e o coeficiente de partição de octanol-água (log P
OW)
como medida de lipofilicidade dos compostos testados. O parâmetro de lipofilicidade (log POW) foi determinado experimentalmente usando-se oito padrões de soluto com valores de log POW
conhecidos, que foram analisados sob as mesmas condições cromatográficas de substâncias alvos. Parâmetros de lipofilicidade junto com descritores moleculares 2D foram submetidos à análise estatística multivariável (análise de componentes principais (PCA) e regressão por mínimos quadrados parciais (SLS)) para determinar os fatores mais importantes para retenção, ou seja, lipofilicidade dos compostos investigados. Os modelos quantitativos de relação entre as propriedades de estrutura e retenção revelam a importância de descritores referentes ao tamanho e ao formato da molécula assim como suas propriedades polares.
The lipophilic character of twelve coumarins was investigated by reversed-phase thin-layer chromatography (RP TLC) on RP-18 silica. The three different binary solvent systems composed of water and organic modifier (methanol, tetrahydrofuran or acetonitrile) were used in order to determine retention parameter (RM0) and octanol-water partition coefficient (log P
OW)as a measure
of the lipophilicity of the tested compounds. Lipophilicity parameter (log POW) was experimentally
determined using eight standard solutes with known log POW values which were analyzed under the same chromatographic conditions as the target substances. Lipophilicity parameters together with 2D molecular descriptors were subjected to the multivariate statistical analysis (principal component analysis (PCA) and partial least square (PLS) regression) in order to reveal the most influential factors governing the retention, i.e., lipophilicity of the investigated compounds. The
quantitative structure-retention relationship models reveal the importance of descriptors which describe the size and the shape of the molecule as well as their polar properties.
Keywords: coumarins, lipophilicity, quantitative structure-retention relationships, principal
component analysis, partial least square
Introduction
The methods of relating molecular structure of solutes (expressed via descriptors) to their chromatographic (retention) behavior are commonly denoted as quantitative structure-retention relationships (QSRRs). Similarly, the aim of quantitative structure property relationship (QSPR) research is to find a functional dependence between molecule structure and its physicochemical properties.
Lipophilicity is a very important molecular parameter used in the QSR(P)R studies and plays an important role in drug discovery. Knowing the lipophilicity of potential drugs helps understanding their absorption, distribution, metabolism, excretion and toxicity (ADMET).1 Lipophilicity
the determination of lipophilicity by means of thin-layer chromatography (TLC) was presented by Komsta et al.2
In the case of TLC, the QSRR studies are usually based on the use of the RM value defined by Bate-Smith and Westall equation,3
(1)
where RF is the retardation factor. Generally, the RM values determined by means of reversed-phase thin-layer chromatography (RP TLC) are linearly dependent on the concentration of the organic modifier (ϕ) in the mobile phase
(2)
where m and RM0 are, respectively, the slope and the
intercept of equation 2.
The extrapolation of the RM value to pure water based on the Soczewinski-Wachtmeister model4 allows the
estimation of lipophilicity.5
The OECD (Organization for Economic Co-operation and Development) Guidelines for the Testing of Chemicals (Test 117)6 describes the method for the
determination of the partition coefficient (log POW) using reversed-phase high performance liquid chromatography (HPLC). The appropriate reference substances with log POW values which encompass thelog POW of the test substances (i.e., at least one reference substance has POW above that of the test substance and another POW below that of the test substance) need to be selected and chromatographed under the same conditions as test substance in isocratic mode. A calibration graph obtained by correlation of the measured retention data of reference substances with their partition coefficients is used for the determination of the log POW value of test substances. In many articles, HPLC method is substituted by thin-layer chromatography,7 keeping the
same principles as in Test 117 with RP-18 silica stationary phase and the composition of the mobile phase that provide the best selectivity (in accordance with isocratic HPLC mode).
In the past decade, our research was focused on QSRR of various organic compounds that are believed to exhibit biological activity. These estimations were performed in order to analyze and better understand the effect of different molecular parameters on the retention and biological activity of selected compounds.8-11 In a previous
publication,the results on the chromatographic behavior of 4-hydroxycoumarin rodenticides (coumatetralyl, bromadiolone and brodifacoum)and biocidal material
impurities in various normal- and reversed-phase chromatographic systems were reported.12 The results
proved the RP TLC to be suitable for the estimation of the relative lipophilicity of coumarine derivatives.
Coumarins are naturally occurring benzopyrone derivatives identified in plants and are characterized by extensive chemodiversity and various pharmacological activities. The majority of coumarins have been isolated from green plants. The genus Seseli (part of Apiaceae family) is a well-known source of linear or angular pyranocoumarins, an interesting subclass of coumarins possessing antiproliferative,13 antiviral14 and antibacterial
activities.15 Numerous species of the genus have been used
in folk medicine since ancient times.
Continuing research in this field, we selected Seseli montanum subsp. tommasinii as a source of some natural coumarins. From the aerial parts of the plant, five known coumarins were isolated. They were studied together with another two natural (isolated from the roots of Seseli annuum and Achillea tanacetifolia) and five synthetic coumarins. A study here presented deals with several topics: (i) retention behavior of coumarins in the reversed-phase chromatographic systems using different organic modifiers, (ii) comparison of different modifiers in lipophilicity assessment, (iii) comparison of two experimentally obtained lipophilicity parameters (RM0 and log P
OW) in
terms of better lipophilicity evaluation and (iv) selection of a subset of descriptors that are the most relevant for retention of coumarins. Principal component analysis (PCA) and partial least squares (PLS) were selected as ones of the most widely used chemometrical methods to build QSRR models.
Experimental
Isolation procedure
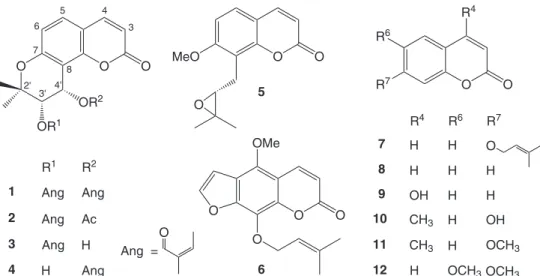
The chemical structures of the investigated coumarins
1-12 are presented in Figure 1.
The plant material was collected at Gorica Hill (area of Podgorica City, Montenegro, Serbia) in Autumn 2009. A voucher specimen (P167/09) was deposited at Herbarium of the Faculty of Natural Sciences and Mathematics, University of Montenegro (Podgorica City).
gel using petrol ether-Et2O (1:1 v/v) to yield 3.7 mg of
compound 1and4.5 mg ofcompound 5. Fractions 6 and 7
(510 mg) eluted with 3-4% of MeOH in CH2Cl2 after CC
(petrol ether-Et2O 1:1)andpreparative TLC (CH2Cl2-MeOH 98:2) afforded 3.9 mg of compound 2. Fractions 8 and 9
(720 mg) eluted with 5% of MeOH in CH2Cl2 were subjected to CC using petrol ether-Et2O (1:1 v/v) and
preparative TLC (CH2Cl2-MeOH 98:2) to give a mixture of compound 3and4 (18 mg). The mixture was separated
using preparative LC on a Zorbax XDB-C18 column (250 × 9.4 mm, 5 µm) with gradient elution using H2O/ACN
system containing 0.2% of formic acid. The yield was 3.5 mg of compound 3 and 9 mg of compound 4.
Compounds 1-5 were identified as anomalin, isopteryxin,
isolaserpitin, laserpitin and meranzin, respectively, by analysis of their spectroscopic and optical rotation data and comparison with previously reported values.16-19
Coumarin 6 was isolated from the roots of
Seseli annuum,20 and coumarin 7 was a kind gift from
Dr. Snežana Trifunović (Faculty of Chemistry, University of Belgrade, Serbia). Compounds 8-12 were purchased
from Sigma-Aldrich (Steinheim, Germany). Purity of all compounds was confirmed by HPLC or NMR (nuclear magnetic resonance).
All relevant 1H and 13C NMR data and 1H NMR spectra
of compounds 1-6 aregiven in Supplementary Information
(SI).
Reversed-phase thin-layer chromatography
The TLC experiments were performed on a commercially available RP-18 TLC plates, (Art. 5559, E. Merck, Germany). The plates were spotted with
1 µL aliquots of 2 mg mL-1 solutes of each compound
(dissolved in CH2Cl2), and developed by the ascending technique, without preconditioning. The detection of the zones was performed under UV light (λ = 254 nm). The RF values were determined as an average of the three chromatograms. Three solvent systems were used as mobile phase: methanol-water, acetonitrile-water and tetrahydrofuran-water binary mixtures, with a varying content of organic modifier (from 100 to 60 vol.% in the case of methanol and acetonitrile and from 100 to 40 vol.% of tetrahydrofuran (increment 10 vol.%)). All the components of the mobile phases were of the analytical grade of purity. All experiments were performed at ambient temperature (22 ± 2 °C).
Standard solutes
Standard solutes were chosen on the basis of their structural similarity with the investigated coumarins. According to OECD guideline, at least six substances of significant structural similarity with target compounds are required for an acceptable calibration.6 Eight compounds
were selected as standard solutes, mainly mono- and poly-substituted phenols, aromatic aldehydes and ketones, and aromatic condensed compounds with literature log POW values. To ensure reliable regression performance, standards were selected with an optimal range of log POW units (ranking from 0.16 to 4.45). Standard solutes with corresponding log POW values given in brackets were: 4-methoxyphenon (1.58), 2,6-dimethylphenol (2.36), 1,3,5-trihydroxybenzene (0.16), anthracen (4.45), 4-hydroxybenzaldehyde (1.35), 1-naphthol (2.85), benzophenon (3.18) and phenol (1.46).
O O O
OR2 OR1
O O MeO
5
O O O
O OMe
O O R6
R7
6
R4 R6 R7
8 H H H
9 OH H H
10 CH3 H OH
11 CH3 H OCH3
12 H OCH3OCH3
7 H H O
Ang = O
R4
R1 R2
2 Ang Ac
3 Ang H
4 H Ang
1 Ang Ang
O
2'
5 4
3
8 7
6
3' 4'
Calculations
For the geometry optimization, the structures were subjected to the Hyperchem Program (version 7.0, Hypercube). The optimization of three-dimensional structure was calculated by semi-empirical quantum chemical calculations with AM1 Hamiltonian. A set of molecular descriptors was selected to reflect geometrical, electronic and physicochemical properties of the investigated compounds. Hyperchem calculates electronic properties, optimized geometries, total energy and QSAR properties. A set of additional physicochemical parameters was generated from the optimized structures by Molecular Modeling Program Plus program (MMP Plus). Virtual Computational Chemistry Laboratory at website http://www.vcclab.org was used for the calculation of lipophilicity of the compounds by various methods based on different theoretical procedures.
Multivariate statistical analysisandmodeling
PCA and PLS were performed using demo version of PLS Toolbox statistical package (Eigenvectors, Inc., version 5.7) for the MATLAB version 7.4.0.287 (R2007a) (MathWorks, Inc., Natick, MA, USA). The data were mean-centered and scaled to unit variance before any statistical operations in order to prevent highly abundant components dominating in the final result over the components present in much smaller quantities.
PCA was carried out as an exploratory data analysis by using single value decomposition (SVD) algorithm and 0.95 confidence level for Q and T2 Hotelling limits for outliers.
A limited number of PC reduces the dimensionality of the retention data space, simplifying further analysis and grouping the substances according to their intrinsic ability for specific interactions. PLS method was employed by means of SIMPLS algorithm without forcing orthogonal conditions to the model in order to condense Y-block variance into first latent variables.21-23 Validation of the
models was performed by leave one out cross-validation procedure. The quality of the models was monitored with the following parameters: R2
cal(cum) (the cumulative sum
of squares of the Ys explained by all extracted components), R2
CV(cum) (the cumulative fraction of the total variation of
the Ys that can be predicted by all extracted components), showing as higher as possible values, and root mean square errors of calibration (RMSEC) and root mean square errors of cross-validation(RMSECV) showing as lower as possible values, with the lowest difference in between them. Low value of RMSECis desirable but if the high values of RMSECVare present at the same time, this can
be an indication of the poor predictability of the calibration model.24, 25
Considering the other multivariate linear regression techniques as multiple linear regression (MLR) and principal component regression (PCR), PLS was chosen as a target analysis due to a number of advantages. Namely, the number of predicted variables is greater than the number of the compounds and it is better to reduce their number to just a few latent variables (using PLS or PCR) than select a few predictor variables, by MLR. In addition, a lot of variables are correlated and have constant values, so MLR would not be appropriate method. An important feature of PLS is that it takes into account errors in both independent and response variables, while PCR assumes that the estimation of molecular descriptors are error free.26
As it is previously mentioned, the best selectivity was obtained with methanol-water mobile phase and these results were used for the evaluation of the possible relationship between the lipophilicity characteristics and the physicochemical parameters of the molecules. The lipophilicity parameter RM0 (chromatographic system RP-18/methanol-water) and log POW were the response variables in the QSRR study. These values were regressed against the molecular structural descriptors as independent variables.
Results and Discussion
Lipophilicity of the analytes
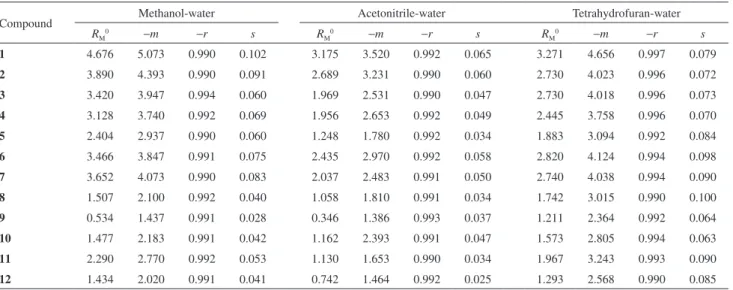
The retention parameters (RF and RM) of coumarins were determined at several compositions of the three different binary solvent systems composed of organic modifier and water: methanol-water, acetonitrile-water and tetrahydrofuran-water. For each compound, the RM value was extrapolated to the zero volume of the organic modifier by using equation 2, thus obtaining the lipophilicity parameter (RM0). The slope (m) and intercept (R
M0) values, and the
statistical data (correlation coefficient (r) and standard deviation (s)) for each binary system are listed in Table 1. The RM values were linearly dependent onthe concentration of organic modifier in the mobile phase, with r ≥ 0.99. Also, the majority of substances show the highest RM0 values in methanol, which has the lowest elution strength among all the organic modifiers applied on RP-18 silica.
interactions of molecules with both mobile and stationary phase. Since the benzopyranon part is identical for all the studied compounds, the reason for their different retention could be ascribed to functionalities, such as additional pyran ring (compounds 1-4), furan ring (compound 6) and
side-chain substituents (2-butenoyl (1, 2, 3 and 4),
3-methylbut-2-enyloxy (6 and 7), methyl (10 and 11), methoxy (11 and 12), hydroxy (3, 4, 9 and 10), acethyl (2) and epoxide (5)).
Taking into account the observed retention, it can be concluded that tricyclic compounds (1-4 and 6) exhibited
stronger retention compared to byciclic coumarines (5, 7-12). Also, increased retention of 1, 2 and 6 coumarins can
be ascribed to the presence of 2-butenoil and 3-methylbut-2-enyloxy group. Similar chromatographic behavior was observed for compounds 6 and 7, with identical side-chain
substituent, indicating that the presence of the bulky 3-methylbut-2-enyloxy group defines their chromatographic behavior. Among all investigated coumarins, bicyclic compounds with hydroxy (9 and 10) and methoxy groups
(11 and 12) demonstrated decrease of retention.
The determination of log POW by TLC is based on the linear relationship between the chromatographic retention RM and the octanol-water partition coefficient determined by shake-flask method for a set of standard compounds. For that purpose, the investigated coumarins were simultaneously chromatographed with the standard solutes, and the retention parameters were determined (RM values are presented in brackets: 4-methoxyphenon (−0.45), 2,6-dimethylphenol (−0.13), 1,3,5-trihydroxybenzene (−1.19), anthracen (0.69), 4-hydroxybenzaldehyde (−0.57), 1-naphthol (−0.10), benzophenon (0.21), and phenol (−0.52)). As the best selectivity was obtained with methanol-water (75:25%, v/v), this mobile phase was chosen for the determination of
log POW. To characterize lipophilicity of coumarins, linear calibration between RM values of eight standards and their literature log POW values was used
RM = −1.176 + 0.423 log POW (3) r = 0.992, N = 8, SD = 0.078, P < 0.0001
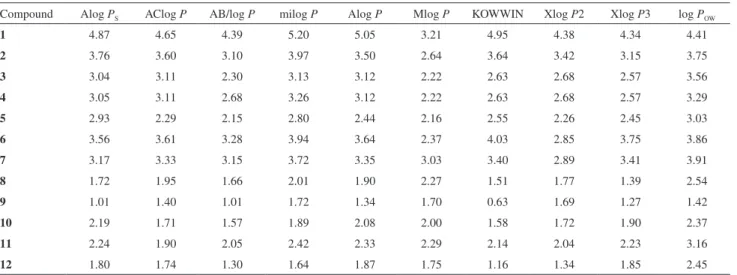
RM values of the studied compounds were substituted into equation 3 to calculate log POW values, listed in Table 2. The same table contains calculated log P values of selected coumarins.
The determination of linear dependences between lipophilicity parameters obtained in chromatographic investigations and calculated log P values is an indispensable step for QSRR. These correlations provide evidence that the chromatography based measurements of lipophilicity are valid. A number of methods based on different approaches for calculating log P from chemical structures are available. Extrapolated RM0 values for chromatographic system RP-18/methanol-water and experimentally established logPOW values were compared with calculated logP (logPcalc), and statistical parameters of these dependences are given in Table 3. Although linear dependence exists in most cases with satisfactory correlation coefficient values over 0.93, observing the slope and the intercept of the relevant equations, it could be concluded that the deviations from the ideal correlation (slope ca. 1 and intercept ca. 0) are more pronounced in the case of experimentally obtained log POW values, i.e., RM0 is better lipophilicity estimate.
Determined lipophilicity of the investigated compounds is in accordance with their chromatographic behavior. Additional pyran and furan ring attached to 2-benzopyran-1-on aromatic core provide increased lipophilicity versus
Table 1. Lipophilicity and statistical parameters obtained from equation 2
Compound Methanol-water Acetonitrile-water Tetrahydrofuran-water
RM0 −m −r s RM0 −m −r s RM0 −m −r s
1 4.676 5.073 0.990 0.102 3.175 3.520 0.992 0.065 3.271 4.656 0.997 0.079
2 3.890 4.393 0.990 0.091 2.689 3.231 0.990 0.060 2.730 4.023 0.996 0.072
3 3.420 3.947 0.994 0.060 1.969 2.531 0.990 0.047 2.730 4.018 0.996 0.073
4 3.128 3.740 0.992 0.069 1.956 2.653 0.992 0.049 2.445 3.758 0.996 0.070
5 2.404 2.937 0.990 0.060 1.248 1.780 0.992 0.034 1.883 3.094 0.992 0.084
6 3.466 3.847 0.991 0.075 2.435 2.970 0.992 0.058 2.820 4.124 0.994 0.098
7 3.652 4.073 0.990 0.083 2.037 2.483 0.991 0.050 2.740 4.038 0.994 0.090
8 1.507 2.100 0.992 0.040 1.058 1.810 0.991 0.034 1.742 3.015 0.990 0.100
9 0.534 1.437 0.991 0.028 0.346 1.386 0.993 0.037 1.211 2.364 0.992 0.064
10 1.477 2.183 0.991 0.042 1.162 2.393 0.991 0.047 1.573 2.805 0.994 0.063
11 2.290 2.770 0.992 0.053 1.130 1.653 0.990 0.034 1.967 3.243 0.993 0.090
corresponding derivatives possessing no extra ring. Incorporating polar hydroxy and methoxy groups have a more pronounced negative impact on lipophilicity. Lipophilicity is also raised with increasing substitution on the basic benzopiranon, i.e., derivatives with 2-butenoil and 3-methylbut-2-enyloxy group are more hydrophobic than compounds that possess methyl, methoxy, hydroxy, acethyl and epoxide substituents.
Principal component analysis (PCA)
PCA carried out on the set of calculated molecular descriptors and retention data can reveal some similarities among studied compounds governed by both their intrinsic structural properties and specific interactions that occur in different chromatographic systems. Loading plots highlight the mostly influential variables responsible for such a clustering and provide a picture on the similarity between RM0 values and the other molecular descriptors.
PCA applied on a set of molecular descriptors resulted in a three-component model explaining 91.79% of the data variation (first principal component comprises 71.94% of variances). The score plot of the three principal components (Figure 2) indicates that all data were lying inside the Hotelling T2 ellipse, suggesting that there are no outliers
among the analytes.
Considering the score plot, PCA reveals different classification. Samples are clustered into two main separate groups: coumarins 7-12 and 5 with different substituents
attached to 2-benzopyran-1-on are positioned in one group; while coumarins with one more pyran or furan ring connected to benzopyranon core are in the second group (compounds 1-4 and 6). First principal component
distinguished samples according to the number of the rings present in the molecule (bicyclic and tricyclic compounds). Second principal component separates those with hydroxyl group in the molecule (3, 4, 9 and 10) from the other
investigated.
Table 2. The calculated log P values and experimental log POW values
Compound Alog PS AClog P AB/log P milog P Alog P Mlog P KOWWIN Xlog P2 Xlog P3 log POW
1 4.87 4.65 4.39 5.20 5.05 3.21 4.95 4.38 4.34 4.41
2 3.76 3.60 3.10 3.97 3.50 2.64 3.64 3.42 3.15 3.75
3 3.04 3.11 2.30 3.13 3.12 2.22 2.63 2.68 2.57 3.56
4 3.05 3.11 2.68 3.26 3.12 2.22 2.63 2.68 2.57 3.29
5 2.93 2.29 2.15 2.80 2.44 2.16 2.55 2.26 2.45 3.03
6 3.56 3.61 3.28 3.94 3.64 2.37 4.03 2.85 3.75 3.86
7 3.17 3.33 3.15 3.72 3.35 3.03 3.40 2.89 3.41 3.91
8 1.72 1.95 1.66 2.01 1.90 2.27 1.51 1.77 1.39 2.54
9 1.01 1.40 1.01 1.72 1.34 1.70 0.63 1.69 1.27 1.42
10 2.19 1.71 1.57 1.89 2.08 2.00 1.58 1.72 1.90 2.37
11 2.24 1.90 2.05 2.42 2.33 2.29 2.14 2.04 2.23 3.16
12 1.80 1.74 1.30 1.64 1.87 1.75 1.16 1.34 1.85 2.45
Table 3. Linear relationships between experimental and calculated lipophilicity
RM0 (MeOH/water) = a + b log Pcalc log POW = a+b log Pcalc
a b r s a b r s
Alog Ps −0.511 1.140 0.963 0.350 1.070 0.747 0.937 0.306
AClog P −0.563 1.192 0.966 0.336 1.075 0.767 0.922 0.339
AB/log P −0.251 1.218 0.956 0.384 1.220 0.807 0.940 0.300
milog P −0.563 1.082 0.959 0.368 1.069 0.698 0.919 0.345
Alog P −0.641 1.173 0.963 0.351 0.990 0.767 0.935 0.311
Mlog P −2.800 2.350 0.858 0.669 −0.554 1.594 0.864 0.442
KOWWIN 0.242 0.939 0.959 0.371 1.531 0.628 0.952 0.269
Xlog P2 −0.682 1.348 0.933 0.469 1.057 0.844 0.867 0.437
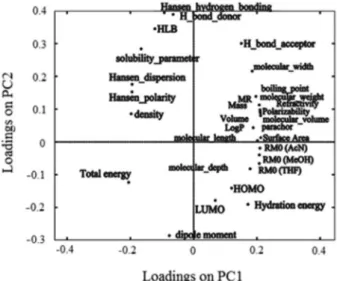
The mutual projections of loading vectors are shown in Figure 3. The highest positive impact to the PC1 is recorded by the parameters which describe the size and the shape of the molecule. PC2 separates compounds mainly according to their polar properties, i.e., physicochemical descriptors such as the count of hydrogen-bond donor, hydrophilic-lipophilic balance, solubility parameter, dipole moment, etc. On the loading plot, the three RM0 variables are in the group with those relating the size and the shape of a molecule such as refractivity, polarizability, surface area, molecular volume, molecular weight, molecular depth and
molecular width. These facts could indicate the most influential factors for observed chromatographic behavior of the coumarins.
Quantitative structure-retention relationship (QSRR)
PLS modeling was performed in order to qualify relationships between the factors governing the lipophilicity. The number of latent variables was selected on the basis of the minimum RMSECV, and the minimum difference between RMSEC and cross-validation. In both models a minimum value of RMSECV was obtained with two latent variables. The obtained models are summarized in Table 4.
The application of PLS methods revealed that the statistical results of these two models are comparable, and that they are statistically significant. The main descriptors in both PLS models are those relating the size and the shape of a molecule such as refractivity, polarizability, surface area, molecular volume, weight, parachor, volume and mass. Observing the X loading plot of the models, it was supposed that a simpler PLS model can be obtained after removing some variables.
The contribution of descriptors that are most influential on the chromatographic behavior was done using variable importance in projection (VIP) scores. The variables with VIP scores higher than 1 were considered as the most relevant for explaining the response variable Y, while the otherare of extremely low or almost no contribution. After removing the variables that only contribute to noise (variables with low values of coefficients and low VIP values), a simplerandbetter PLS models were obtained. The descriptors included in the final models are presented in Table 4 in order from the highest to the lowest value of their regression coefficient, with notification of the sign of their contribution on the response variable. Taking into account the parameters that represent the quality of the model, it can be concluded that both PLS models are statistically significant. The descriptors included in the final models are of similar nature and significance.
The results obtained indicate that the most relevant descriptors influencing lipophilicity parameters are: surface
Figure 2. Score values of the first, second and third principal components.
Figure 3. Projection of loading vectors for the first two PCs.
Table 4. Results of PLS analysis
Dependent variable
Statistical performance of the model
Descriptors included in the modela
R2
CV R2cal RMSEC RMSECV
RM0 0.942 0.901 0.287 0.376
Hansen polarity (-), density (-), molecular length (+), Hansen dispersion (-), surface area (+)
log POW 0.893 0.814 0.262 0.346
Hydrophilic-lipophilic balance (-), solubility parameter (-), Hansen polarity (-), density (-), molecular length (+), Hansen dispersion (-), surface area (+)
area, molecular length, density, solubility parameter, Hansen polarity, Hansen dispersion and hydrophilic-lipophilic balance. From the sign of the regression coefficients, it can be observed that the descriptors describing polarity of the investigated compounds, i.e., their ability for hydrophilic interactions makes negative contribution to the RM0 values. Solubility parameter, Hansen polarity and dispersion provide a numerical estimate of the degree of intermolecular attractions between molecules (i.e., existence of the dispersion, polar and hydrogen bonding forces), and indicate that the stronger the intermolecular interactions between molecules and the mobile phase are, the analytes are less retained on the stationary phase and the lower RM0 and log P
OW values are obtained. Surface area and
molecular length influence the lipophilicity parameters on the opposite way. They have positive coefficients in models and give the higher value of RM0 and log POW when they are higher. The surface area of substance is a sum of all areas that cover the surface of the molecule. The higher value of this descriptor indicates the larger molecule which is stronger retained on the stationary phase causing the higher value of RM0, i.e., log P
OW molecular length
determines the size of the molecule and influences on the lipophilicity parameter on the same way as previous descriptor. Hydrophilic-lipophilic balance of a solute is a measure of a degree to what extent its hydrophilic or lipophilic properties are expressed. Its negative regression coefficients reveal the lower the values of these balances are, the greater the values of RM0 and log POW are observed, suggesting that more hydrophobic solutes, exhibiting stronger nonspecific dispersive interaction between their own nonpolar moieties, and those of the stationary phase are more retained under applied chromatographic conditions.
Conclusions
The focus of the present study was the estimation of the lipophilicity of twelve coumarins by simultaneous chromatographing with standard substances with known log POW values. PCA was used for the data overview, while PLS was chosen as the multivariate regression technique for the structure-lipophilicity correlations.
Upon the presented results, it could be concluded that: (i) all reversed-phase thin-layer chromatographic systems used proved to be suitable for the lipophilicity estimation, (ii) the proposed two PLS models are statistically significant and their statistical quality is comparable and (iii) descriptors which describe the size and the shape of the molecule as well as their polar properties determine lipophilic behavior of the investigated compounds. In terms of various model, the performance criteria
parameters considered here, the obtained PLS models could be suitable for predicting the chromatographic behavior of coumarins.
Supplementary Information
Material Supplementary (1H and 13C NMR data, and 1H NMR spectra of the isolated compounds) is available
free of charge at http:// jbcs.sbg.org.br as PDF file.
Acknowledgements
This work has been supported by the Ministry of Education and Science of Serbia, Grant No. 172017.
References
1. Lombardo, F.; Shalaeva, M. Y.; Tupper, K. A.; Gao, F.; Abraham, M. H.; J. Med. Chem. 2000, 43, 2922.
2. Komsta, L.; Skibiĭnski, R.; Berecka, A.; Gumieniczek, A.; Radkiewicz, B.; Radon, M.; J. Pharm. Biomed. Anal. 2010,
53, 911.
3. Bate-Smith, E. C.; Westall, R. G.; Biochim. Biophys. Acta 1950,
4, 427.
4. Soczewinski, E.; Wachtmeister, C. A.; J. Chromatogr. 1962, 7, 311.
5. Biagi, G. L.; Barbaro, A. M.; Sapone, A. J.; J. Chromatogr., A
1994, 662, 341.
6. http://www.oecd-ilibrary.org/environment/test-no-117-partition-coefficient-n-octanol-water-hplc-method_9789264069824-en accessed in November 2004.
7. Andrić, F. Lj.; Trifković, J. Ð.; Radoičić, A. D.; Šegan, S. B.; Tešić, Ž. Lj.; Milojković-Opsenica, D. M.; Chemosphere 2010,
81, 299.
8. Natić, M.; Marković, R.; Milojković-Opsenica, D.; Tešić, Ž.;
J. Sep. Sci. 2007, 30, 2241.
9. Trifković, J.; Andrić, F.; Ristivojević, P.; Andrić, D.; Tešić, Ž.; Milojković-Opsenica, D.; J. Sep. Sci. 2010, 33, 2619.
10. Atrrog, A. A. B.; Natić, M.; Tosti, T.; Milojković-Opsenica, D.; Ðorđević, I.; Tešević, V.; Jadranin, M.; Milosavljević, S.; Lazić, M.; Radulović, S.; Tešić, Ž.; Biomed. Chromatogr. 2008, 14, 215.
11. Baošić, R.; Radojević, A.; Radulović, M.; Miletić, S.; Natić, M.; Tešić, Ž.; Biomed. Chromatogr. 2008, 22, 379.
12. Tosti, T.; Rakić, G.; Natić, M.; Milojković-Opsenica, D.; Husinec, S.; Savić, V.; Tešić, Ž.; J. Planar Chromatogr.-Mod. TLC 2009, 22, 333.
13. Magiatis, P.; Melliou, E.; Skaltsounis, A. L.; Mitaku, S.; Léonce, S.; Renard, P.; Pierré, A.; Atassi, G.; J. Nat. Prod. 1998, 61, 982. 14. Xie, L.; Takeuchi, Y.; Cosetino, L. M.; Lee, K. H.; J. Med. Chem.
15. Melliou, E.; Magiatis, P.; Mitaku, S.; Skaltsounis, A. L.; Chinou, E.; Chinou, I.; J. Nat. Prod. 2005, 68, 78.
16. Bellino, A.; Venturella, P.; Marino, M. L.; Servettaz, O.; Venturella, G.; Phytochemistry 1986, 25, 1195.
17. Swager, T. M.; Cardellina, J. H.; Phytochemistry 1985, 24, 805. 18. Ito, C.; Furukawa, H.; Chem. Pharm. Bull. 1987, 35, 4277.
19. Tosun, A.; Baba, M.; Ozkal, N.; Okuyama, T.; Turk. J. Chem.
2005, 29, 327.
20. Vučković, I.; Vajs, V.; Stanković, M.; Tešević, V.; Milosavljević, S.; Chem. Biodivers. 2010, 7, 698.
21. Havare, R. V.; Tho, I.; Bauer-Brandl, A.; Eur. J. Pharm. Biopharm. 2009, 73, 424.
22. Dumarey, M.; van Nederkassel, A. M.; Deconincka, E.; Heyden, Y. V.; J. Chromatogr., A 2008, 1192, 81.
23. Wold, S.; Sjӧstrӧm, M.; Eriksson, L.; Chemom. Intell. Lab. Syst. 2001, 58, 109
24. Varmuza, K.; Filzmoser, P.; Introduction to Multivariate Statistical Analysis in Chemometrics; CRC Press, Taylor &
Francis Group: Boca Raton, Florida, USA, 2009.
25. Otto, M.; Chemometrics, Statistical and Computer Application in Analytical Chemistry; Wiley-VCH: Weinheim, Germany, 1999.
26. Brereton, R. G.; Chemometrics, Data Analysis for the Laboratory and Chemical Plant; Wiley: Chichester, England,
2003.
Submitted: July 5, 2011