Article
Printed in Brazil - ©2016 Sociedade Brasileira de Química0103 - 5053 $6.00+0.00*e-mail: [email protected]
Lipophilicity Study of Thiazolo[3,2-
a
]pyrimidine Derivatives as Potential Bioactive
Agents
Renata Studzińska,*,a Renata Kołodziejska,b Małgorzata Redka,a Bożena Modzelewska-Banachiewicza and Beata Augustyńskab
aDepartment of Organic Chemistry, Faculty of Pharmacy and bDepartment of Biochemistry, Faculty of Medicine,
Collegium Medicum in Bydgoszcz, Nicolaus Copernicus University in Toruń, Toruń, Poland
Systems containing fused thiazole and pyrimidine rings play a significant role in organisms due to their biological activity. Lipophilicity, as important parameter to expect biological activity of the compounds, was evaluated for 27 potentially active thiazolo[3,2-a]pyrimidine derivatives using chromatographic methods: reversed phase thin layer chromatography (RP-TLC) and reversed phase high performance liquid chromatography (RP-HPLC) methods. Methanol was used as the organic modifier of the mobile phases. The corresponding relationship between compound’s structure and lipophilicity parameters (RM0 and log kw) values were observed and featured. RM0 and
log kw parameters were compared with computed log P values. For all of analyzed compounds,
determined lipophilicity’s parameters values are > 0 which means that there are hydrophobic substances, soluble in the lipid phase. Simultaneously, these values are < 5, i.e., are in accordance with Lipinski’s rule in the range of lipophilicity. In the case of the possibility of their use as drugs, they will be active after oral application.
Keywords: lipophilicity, thiazolopyrimidine derivatives, high pressure liquid chromatography, thin-layer chromatography, biological activity
Introduction
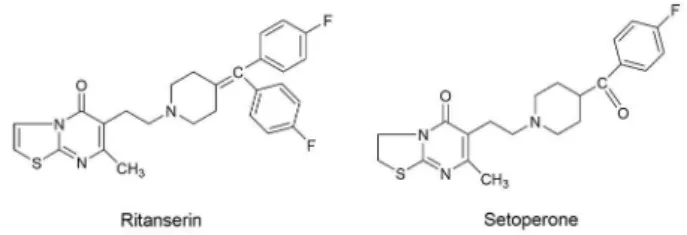
Systems containing fused thiazole and pyrimidine rings play a significant role in organisms due to their biological activity. Thiazolo[3,2-a]pyrimidine derivatives, among which ritanserin and setoperone are examples (Figure 1).
Ritanserin is one of the antagonist of 5HT2 serotonine
receptors.1-4 Setoperone is an antagonist with high
affinity and specificity for serotonine 5HT2 receptors.
Moreover setoperone also binds to dopamine D2 receptors
and it is effective as treatment of patients with chronic
schizophrenia.1,5-8 Other thiazolo[3,2-a]pyrimidine
derivatives display antibacterial,9 antiviral,8,10 and
analgesic11 activities as well as hypotensive.6
Lipophilicity is an important parameter to expect biological activity of the compounds. This parameter is expressed as a partition coefficient P or its decimal logarithm (log P). After introduced into the organism, the drug to reach its site of action must overcome a number of barriers in the form of biological membranes. Transport of drugs through cell membranes often proceed by way of passive diffusion. Not ionized drug molecules dissolved in the aqueous phase pass through the semi-permeable lipid membrane to the aqueous phase on the other side of the membrane. Rate of this process depends on
inter alia the solubility of the drug in lipids, as indicated
by lipophilicity.12
Lipinski’s rule of five which describes molecular properties important for drug pharmacokinetics in the human body says that an orally drug is active with log P ≤ 5.13
Lipophilicity can be determined experimentally by classical extraction method in the system octanol-water. However, this method has been practically superseded by Figure 1. Ritanserin and setoperone as examples of biologically active
chromatographic techniques, which are simpler and more exact.14
In present work we evaluated chromatographic lipophilicity parameters of 27 potentially active thiazolo[3,2-a]pyrimidine derivatives using reversed phase thin layer chromatography (RP-TLC) and reversed phase high performance liquid chromatography (RP-HPLC) methods and compared them with computed log P values.
T h e s e r i e s o f n o v e l 2 h a l o m e t h y l 2 , 3 -dihydrothiazolo[3,2-a]pyrimidine derivatives were synthesized via the reaction of 3-allyl-2-thiouracils with iodine chloride or bromine in anhydrous methanol.15,16 A
bromine and nitro group was introduced by electrophilic substitution at C-6 of the thiazolopyrimidine system. The subsequent hydrogen iodide and bromine elimination provided thiazolo[3,2-a]pyrimidin-5-one derivatives.
Experimental
Thiazolo[3,2-a]pyrimidin-5-one derivatives 1-27
synthesized according to the literature15,16 were initially divided
into 3 groups: (2-iodomethyl-2,3-dihydrothiazolo[3,2-a] pyrimidin-5-one derivatives 1-11, 2-bromomethyl-2,3-dihydrothiazolo[3,2-a]pyrimidin-5-one derivatives 12-16
and thiazolo[3,2-a]pyrimidin-5-one derivatives 17-27) basing on their chemical structure (Table 1).
Lipophilicity was determined by chromatographic methods, using RP-TLC and RP-HPLC.
Reversed-phase TLC
HPTLC Silica gel 60 RP-18 WF254s 10 × 10 cm
plates (Merck, Germany) were applied as stationary phase. The solvents: methanol and water for HPLC from POCH (Poland) were used. Compounds were dissolved in methanol (3 mg mL-1), samples (0.01 mL) of each
class was applied on individual plates than dried on air. Methanol concentration expressed as volume fraction v/v, varied in the range from 0.5 to 0.8 in constant steps of 0.05. The plates were developed in horizontal DS-chamber (Chromdes, Poland) using saturated conditions (20 min of saturation in ambient temperature). The developing distance was 8 cm. Developed plates were air dried and observed under 254 nm ultraviolet lamp.
For all the compounds, the relative lipophilicity RM
values for seven methanol-water mobile phases were calculated by the use of the formula:
− =
F F M
R R 1 log
R (1)
In order to determine the lipophilicity parameters RM0,
linear relationship were calculated between RM values and
the methanol’s concentration in the mobile phase:
RM = RM0 + Sϕ (2)
where RM0 is value extrapolated to zero methanol
concentration, ϕ is methanol concentration in the mobile
phase (in volume fraction v/v), S is the slope of the regression curve. All experiments were performed in a stable temperature of 22 ºC.
Reversed-phase HPLC
The HPLC experiments were performed on the Shimadzu HPLC system (Japan) equipped with solvent delivery pump LC-20AD, UV-VIS detector model SPD-20A, degasser model DGU-20A5, an column oven model CTO-20A and a column LiChrospher(TM) 100 RP-18 (5 µm), Merck (Germany). Mobile phase methanol/ water varied in the various ratios. The solvents: methanol and water for HPLC from POCH (Poland) were used. Methanol concentration expressed as volume fraction v/v, varied in the range from 0.55 to 0.9 in constant steps of 0.05. Compounds were dissolved in methanol (1 mg mL-1).
Sample injection volume was 0.02 mL. The capacity factor k was calculated by relationship:
1 t t k
M R
−
= (3)
where tR is retention time and tM is the time for dead volume
(measured by use of uracil).
In order to determine the lipophilicity parameters, linear relationship were calculated between log k values and the methanol’s concentration in the mobile phase:
log k = log kw + Sϕ (4)
where log kw is value extrapolated to zero methanol
concentration, ϕ is methanol concentration in the mobile
phase (in volume fraction v/v), S is the slope of the regression curve. All experiments were performed in temperature of 22 ºC.
Subsequent chromatographic lipophilicity parameter
ϕ014,17 was calculated, for RP-TLC method (equation 5) and
for RP-HPLC method (equation 6), respectively:
S
RM0
0=−
S k log w 0=−
ϕ (6)
Results and Discussion
RM0 and log kw lipophilicity parameters were
determined for 27 thiazolo[3,2-a]pyrimidin-5-one derivatives that due to the construction were divided into three groups: 2-iodomethyl-2,3-dihydrothiazolo[3,2-a] pyrimidin-5-one derivatives (1-11), 2-bromomethyl-2,3-dihydrothiazolo[3,2-a]pyrimidin-5-one derivatives (12-16) and 2-methylthiazolo[3,2-a]pyrimidin-5-one derivatives (17-27) (Table 1). Methanol was chosen as the most recommended organic modifier of the mobile phases for lipophilicity estimation by RP-TLC and RP-HPLC, since it does not disturb the hydrogen bonding network of water.18,19
The linear dependence between RM or log k values and
concentration of organic modifier in the eluent is observed. High values of correlation coefficients (r = 0.92-0.99 for RP-TLC and r > 0.99 for RP-HPLC method) were observed for all three groups of compounds in wide range of methanol concentration in mobile phase which permitted
determination of lipophilicity parameters: RM0 and log kw
by extrapolation and ϕ0 by interpolation (Table 2).
For all the analyzed compounds RM0 parameters
determined by RP-TLC had lower values than the log kw
parameters determined by RP-HPLC (Figure 2).
The corresponding relationship between compound’s structure and lipophilicity parameters values were observed (Table 1). The presence of the aliphatic chains or rings in pyrimidine ring induced an increase of RM0 and log kw
values. The highest value of lipophilicity parameters, both determined by TLC and HPLC, was observed for compounds 11 and 27 with cyclohexylmethyl group at C-7. log kw was 4.04 and 3.83, and RM0 2.94 and 2.81,
respectively for compound 11 and 27. The presence of a penta-, hexa- or heptamethylene ring in 2-iodomethyl-2,3-dihydrothiazolo[3,2-a]pyrimidin-5-ones (1-3) and thiazolo[3,2-a]pyrimidin-5-ones (17-19) increased the hydrophobicity. For those compounds the experimentally determined lipophilicity parameters were higher in comparison to the derivatives containing substituents on the aliphatic chains and/or electron withdrawing group. The presence of the nitro group at C-6 (compounds 5, 13, Table 1. Structures of thiazolo[3,2-a]pyrimidin-5-one derivatives
Compound Core R1 R2 R
M0 log kw
1
N
S N I
O R1
R2
−(CH2)3− 1.67 2.07
2 −(CH2)4− 1.65 2.51
3 −(CH2)5− 2.32 2.95
4 H CH3 1.43 1.57
5 NO2 CH3 1.21 1.95
6 H H 1.04 1.30
7 CH3 CH3 1.54 1.99
8 CH3 H 1.22 1.71
9 Br CH3 1.52 2.11
10 H C2H5 1.49 2.00
11 H CH2C6H11cykl 2.94 4.04
12
N
S N Br
O R1
R2
H CH3 1.06 1.35
13 NO2 CH3 1.32 1.94
14 CH3 CH3 1.38 1.76
15 CH3 H 1.01 1.76
16 Br CH3 1.56 2.08
17
N
S N O
R1
R2
−(CH2)3− 1.48 1.80
18 −(CH2)4− 2.01 2.30
19 −(CH2)5− 2.17 2.67
20 H CH3 1.06 1.26
21 NO2 CH3 1.47 1.88
22 H H 0.77 0.91
23 CH3 CH3 1.36 1.72
24 CH3 H 1.03 1.40
25 Br CH3 1.46 2.01
26 H C2H5 1.17 1.75
27 H CH2C6H11cykl 2.81 3.83
21) increases the log kw value compared to the hydrogen
atom (compounds 4, 12, 20). A similar relationship appears on the parameter RM0 with the exception of 2-iodomethyl
derivatives 4 and 5. Simultaneously reduce the values of the lipophilicity parameters compared to CH3 group in the
case of 2,3-dihydrothiazolopyrimidin-5-ones 7 and 14 with the exception of log kw parameter value for 13 and 14. In
the case of 2-methylthiazolo[3,2-a]pyrimidin-5-ones, the RM0 and log kw values are slightly higher for derivative 21
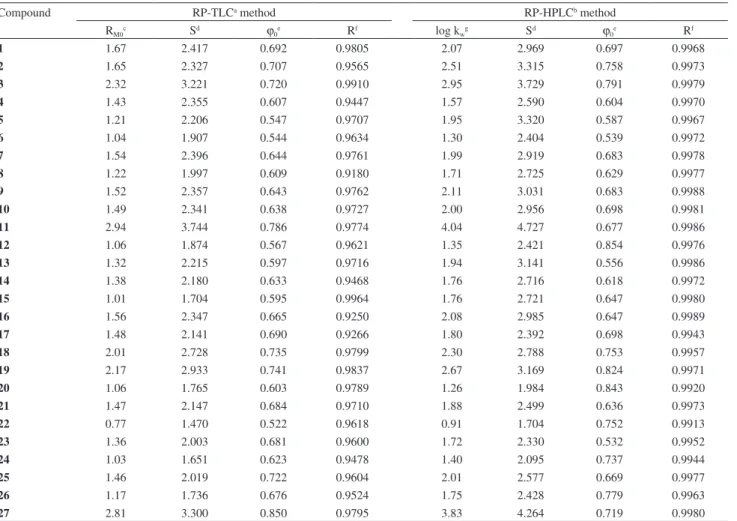
containing NO2 group as compared with a derivative 23 Table 2. The lipophilicity parameters calculated from RP-TLC and RP-HPLC experimental values
Compound RP-TLCa method RP-HPLCb method
RM0c Sd ϕ0e Rf log kwg Sd ϕ0e Rf
1 1.67 2.417 0.692 0.9805 2.07 2.969 0.697 0.9968
2 1.65 2.327 0.707 0.9565 2.51 3.315 0.758 0.9973
3 2.32 3.221 0.720 0.9910 2.95 3.729 0.791 0.9979
4 1.43 2.355 0.607 0.9447 1.57 2.590 0.604 0.9970
5 1.21 2.206 0.547 0.9707 1.95 3.320 0.587 0.9967
6 1.04 1.907 0.544 0.9634 1.30 2.404 0.539 0.9972
7 1.54 2.396 0.644 0.9761 1.99 2.919 0.683 0.9978
8 1.22 1.997 0.609 0.9180 1.71 2.725 0.629 0.9977
9 1.52 2.357 0.643 0.9762 2.11 3.031 0.683 0.9988
10 1.49 2.341 0.638 0.9727 2.00 2.956 0.698 0.9981
11 2.94 3.744 0.786 0.9774 4.04 4.727 0.677 0.9986
12 1.06 1.874 0.567 0.9621 1.35 2.421 0.854 0.9976
13 1.32 2.215 0.597 0.9716 1.94 3.141 0.556 0.9986
14 1.38 2.180 0.633 0.9468 1.76 2.716 0.618 0.9972
15 1.01 1.704 0.595 0.9964 1.76 2.721 0.647 0.9980
16 1.56 2.347 0.665 0.9250 2.08 2.985 0.647 0.9989
17 1.48 2.141 0.690 0.9266 1.80 2.392 0.698 0.9943
18 2.01 2.728 0.735 0.9799 2.30 2.788 0.753 0.9957
19 2.17 2.933 0.741 0.9837 2.67 3.169 0.824 0.9971
20 1.06 1.765 0.603 0.9789 1.26 1.984 0.843 0.9920
21 1.47 2.147 0.684 0.9710 1.88 2.499 0.636 0.9973
22 0.77 1.470 0.522 0.9618 0.91 1.704 0.752 0.9913
23 1.36 2.003 0.681 0.9600 1.72 2.330 0.532 0.9952
24 1.03 1.651 0.623 0.9478 1.40 2.095 0.737 0.9944
25 1.46 2.019 0.722 0.9604 2.01 2.577 0.669 0.9977
26 1.17 1.736 0.676 0.9524 1.75 2.428 0.779 0.9963
27 2.81 3.300 0.850 0.9795 3.83 4.264 0.719 0.9980
aRP-TLC: reversed phase thin layer chromatography; bRP-HPLC: reversed phase high performance liquid chromatography; cR
M0 is value extrapolated to
zero methanol concentration; dS: slope of the regression curve; eϕ
0: chromatographic lipophilicity parameter; fR: correlation coefficient; glog kw: decimal
logarithm (log P) of partition coefficient P.
containing CH3 at C-6. The presence of the bromine atom
at C-6 affects the growth lipophilicity parameters compared to the compounds containing H and CH3 in the case of
2-bromomethyl-2,3-dihydrotiazolo[3,2-a]pyrimidin-5-ones (compounds 12, 14, 16) and thiazolo[3,2-a ]pyrimidin-5-ones (compounds 20, 23, 25). For 2-iodomethyl-2,3-dihydrotiazolo[3,2-a]pyrimidin-5-ones a slight decrease in the values RM0 and the log kw was observed in the case of
the bromine atom presence at C-6 compared to hydrogen atom (compounds 4, 9).
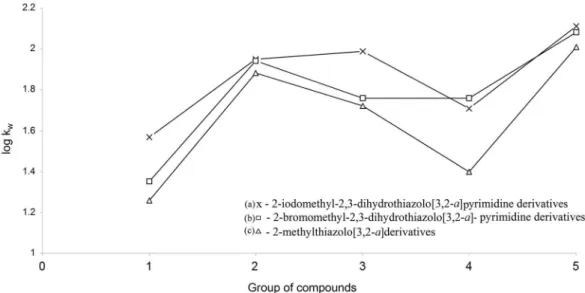
Analysis of log kw values showed a characteristic
dependence of this parameter on the substituents present in the 2-position of the thiazolopyrimidine system (Figure 3). The derivatives containing the same substituents on the pyrimidine ring and the different substituents at C-2 of the thiazole ring were examined. For all studied groups of compounds (except for group 4) higher values of log kw
for derivatives containing an iodomethyl group at C-2 was observed (Figure 3a). The presence of bromomethyl group causes a slight decrease in the value of this parameter (Figure 3b). The lowest values of log kw are characteristic
for derivatives containing a methyl group at the C-2 and the double bond between C-2 and C-3 in a thiazolopyrimidine system (Figure 3c). In the case the lipophilicity parameters were calculated by computational methods an identical relationship were observed (Table 3). Compounds having a methyl group at C-6 and hydrogen at C-7 (Figure 3, group 4), have a slightly higher values of log kw for 2-bromomethyl
derivative 15 in comparison with 2-iodomethyl derivative
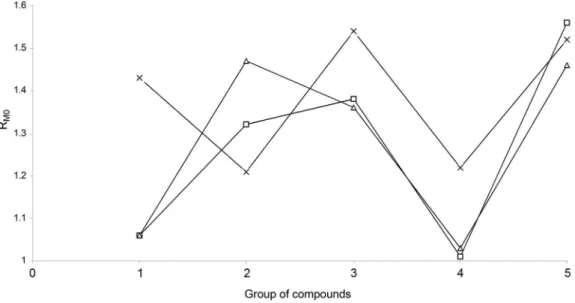
8. For RM0 values from the above-described relationship,
only in the case of compounds containing a methyl group at C-7 and hydrogen at C-6 or a methyl group at C-6 and C-7
was observed (Figure 4, groups 1 and 3). Minor deviations from the above described relationships in the case of groups 4 and 5 may be observed due to the innacurate reading of the Rf value.
Relative lipophilicity RM0 and log kw values were
compared with log P values calculated by computational methods (Table 3).20
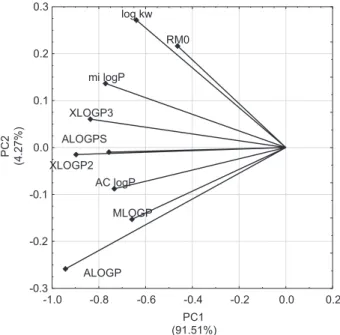
The multivariate comparison of the experimentally obtained values and the coefficients calculated by the computational methods was made by principal component analysis (PCA).
The experimental data (log kw, RM0) from Table 2 and the
calculated log P parameters (from Table 3) were grouped as data matrix and were analyzed using PCA, based on the covariance matrix (unscaled PCA) using Statistica 12 and the results are presented in Figure 5.
PCA resulted in two principal components that account for the majority of the data variability, i.e., 91.51 and 4.27 for PC1 and PC2, respectively, giving 95.78% in total.
The best correlations between the experimental (or extrapolated) partition coefficients and miLOGP parameters were obtained. Generally, higher values of the partition coefficient for these relationships were obtained for RP TLC method.
The best correlations between partition coefficients RM0-log kw, ALOGPS-XLOGP2, MLOGP-ALOGP were
obtained.
It can be seen that experimentally determined chromatographic indices are less correlated with computational ones, which is an additional argument about the sense of this study.
Figure 4. The relationship between RM0 values according to core and the substituents.
Table 3. The comparison RM0 and log kw values of compounds 1-27 with log P values calculated by computing programs
Compound RM0 log kw miLogP XLOGP2 XLOGP3 ALOGPS MLOGP ALOGP AC log P
1 1.67 2.07 2.18 1.33 2.02 2.20 2.76 2.96 2.18
2 1.65 2.51 2.70 1.90 2.56 2.49 3.04 3.42 2.50
3 2.32 2.95 3.20 2.47 3.10 2.88 3.30 3.87 2.82
4 1.43 1.57 1.74 1.38 1.72 2.24 2.19 2.36 1.72
5 1.21 1.95 1.63 1.59 1.76 1.83 2.19 2.11 1.09
6 1.04 1.30 1.30 0.83 1.35 2.06 1.89 1.85 0.94
7 1.54 1.99 2.12 1.52 2.09 2.27 2.48 2.81 2.11
8 1.22 1.71 1.73 0.97 1.72 2.18 2.19 2.30 1.33
9 1.52 2.11 2.48 2.09 2.62 2.73 2.89 2.82 2.17
10 1.49 2.00 2.32 1.63 2.15 2.82 2.48 2.89 2.18
11 2.94 4.04 4.23 4.07 4.35 3.99 3.80 4.59 3.40
12 1.06 1.35 1.47 1.18 1.38 1.34 2.04 1.83 1.38
13 1.32 1.94 1.36 1.39 1.41 1.41 2.04 1.57 0.75
14 1.38 1.76 1.85 1.32 1.75 1.65 2.34 2.28 1.77
15 1.01 1.76 1.46 0.77 1.38 1.37 2.04 1.76 0.99
16 1.56 2.08 2.21 1.89 2.28 2.21 2.75 2.28 1.83
17 1.48 1.80 1.67 0.25 1.22 1.65 1.83 1.51 1.41
18 2.01 2.30 2.18 0.82 1.76 2.05 2.12 1.96 1.73
19 2.17 2.67 2.69 1.39 2.30 2.46 2.40 2.42 2.05
20 1.06 1.26 1.23 0.30 0.92 1.10 1.21 0.91 0.95
21 1.47 1.88 1.12 0.51 0.96 0.96 1.21 0.65 0.33
22 0.77 0.91 0.79 -0.25 0.55 0.68 0.88 0.40 0.17
23 1.36 1.72 1.61 0.44 1.30 1.42 1.53 1.36 1.34
24 1.03 1.40 1.22 -0.11 0.92 1.05 1.21 0.84 0.56
25 1.46 2.01 1.97 1.01 1.83 1.77 1.95 1.36 1.40
26 1.17 1.75 1.80 0.55 1.36 1.43 1.53 1.43 1.41
27 2.81 3.83 3.71 2.99 3.56 3.63 2.94 3.14 2.63
Conclusions
The lipophilicity of 27 potentially active thiazolo[3,2-a] pyrimidine derivatives were evaluated by using reversed-phase thin-layer chromatography and reversed-reversed-phase high performance liquid chromatography techniques. The linear correlation between RM and log k values and
the concentration of methanol in the mobile phase for all compounds were obtained.
For log kw the higher correlation coefficients were
observed in comparison to RM0, which indicates that for
the tested group of compounds, RP-HPLC method is more exact.
For all of analyzed compounds, determined lipophilicity’s parameters values are > 0, which means that there are hydrophobic substances, soluble in the lipid phase. Simultaneously these values are < 5, i.e., are in accordance with Lipinski’s rule in the range of lipophilicity. In case of being used as drugs, they will be active after oral application.
Acknowledgments
This work has been supported by Nicolaus Copernicus University, Collegium Medicum as part of statutory research project in 2015 year, No. 473.
References
1. Kennis, L. E. J.; Vandenberk, J.; Mertens, J. C.; EP Patent 110,4351984.
2. den Boer, J. A.; Vahlne, J. O.; Post, P.; Heck, A. H.; Daubenton, F.; Olbrich, R.; Hum. Psychopharm. Clin. 2000, 15, 179. 3. Back, T.; Prado, R.; Zhao, W. Z.; Watson, B. D.; Ginsberg, M.
D.; Neurol. Res.1998, 20, 643.
4. Cornish, J. W.; Maany, I.; Fudala, P. J.; Ehrman, R. N.; Robbins, S. J.; O’Brien, C. P.; Drug Alcohol Depend.2001, 61, 183. 5. Strome, E. M.; Clark, C. M.; Zis, A. P.; Doudet, D. J.; Biol.
Psychiatry2005, 57, 1004.
6. Russo, F.; Guccione, S.; Romeo, G.; Barretta, G. U.; Pucci, S.; Caruso, A.; Amico-Roxas, M.; Cutuli, V.; Eur. J. Med. Chem. 1993, 28, 363.
7. Beversdorf, D. Q.; Nordgren, R. E.; Bonab, A. A.; Fischman, A. J.; Weise, S. B.; Dougherty, D. D.; Felopulos, G. J.; Zhou, F. C.; Bauman, M. L.; J. Neuropsychiatry Clin. Neurosci.2012,
24,191.
8. Danel, K.; Pedersen, E. B.; Nielsen, C.; J. Med. Chem.1998,
41, 191.
9. Pecorari, P.; Rinaldi, M.; Costantino, L.; Provvisionato, A.; Cermelli, C.; Portolani, M.; Farmaco1991, 46, 899.
10. Ram, V. J.; Vanden Berghe, D. A.; Vlietinck, A. J.; Ann. Chem. 1987, 797.
11. Seperic, M.; DE. Patent 21,40,601 1972.
12. Zejc, A.; Gorczyca, M.; Drugs Chemistry; Wydawnictwo Lekarskie PZWL: Warszawa, 2002.
13. Lipinski, C. A.; Lombardo, F.; Dominy, B. W.; Feeney, P. J.;
Adv. Drug Delivery Rev.2012, 64, 4.
14. Jóźwiak, K.; Szumiło, H.; Soczewiński, E.; Wiadomości Chemiczne2001, 55, 1047.
15. Studzińska, R.; Wróblewski, M.; Dramiński, M.; Heterocycles 2008, 75, 1953.
16. Studzińska, R.; Wróblewski, M.; Karczmarska-Wódzka, A.; Kołodziejska, R.; Tetrahedron Lett.2014, 55, 1384.
17. Valko, K.; Slegel, P. J.; J. Chromatogr.1993, 631, 49. 18. Komsta, Ł.; Skibiński, R.; Berecka, A.; Gumieniczek, A.;
Radkiewicz, B.; Radoń, M.; J.Pharm. Biomed. Anal.2010,
53, 911.
19. Giaginis, C.; Tsantili-Kakoulidou, A.; J. Liq. Chromatogr. Relat. Technol.2008, 31, 79.
20. Tetko, I. V.; Gasteiger, J.; Todeschini, R.; Mauri, A.; Livingstone, D.; Ertl, P.; Palyulin, V. A.; Radchenko, E. V.; Zefirov, N. S.; Makarenko, A. S.; Tanchuk, V. Y.; Prokopenko, V. V.; J. Comput.-Aided Mol. Des.2005, 19, 453; VCCLAB, Virtual Computational Chemistry Laboratory, http://www. vcclab.org accessed in January 2016.
Submitted: October 19, 2015
Published online: February 2, 2016
RM0 log kw
mi logP
XLOGP3
MLOGP AC logP
-0.8 -0.6 -0.4 -0.2 0.0 0.2 PC1
(91 51%). -0.1
-0.2
-0.3 -1.0 0.0 0.1 0.2 0.3
P
C
2
(4
2
7
%
)
.
XLOGP2 ALOGPS
ALOGP
![Table 1. Structures of thiazolo[3,2-a]pyrimidin-5-one derivatives](https://thumb-eu.123doks.com/thumbv2/123dok_br/18999899.463406/3.892.107.823.589.1091/table-structures-of-thiazolo-a-pyrimidin-one-derivatives.webp)