Article
J. Braz. Chem. Soc., Vol. 23, No. 7, 1265-1273, 2012. Printed in Brazil - ©2012 Sociedade Brasileira de Química 0103 - 5053 $6.00+0.00
A
*e-mail: [email protected], [email protected]
Guanabara Bay Sedimentation Rates based on
210Pb Dating:
Reviewing the Existing Data and Adding New Data
Jose M. Godoy,*,a,b Alessandra V. Oliveira,a Ana C. Almeida,a Maria Luiza D. P. Godoy,b
Isabel Moreira,a Angela R. Wagenera and Alberto G. de Figueiredo Juniorc
aDepartamento de Química, Pontifícia Universidade do Rio de Janeiro,
Rua Marquês de São Vicente, 225, Gávea, 22453-900 Rio de Janeiro-RJ, Brazil
bInstituto de Radioproteção e Dosimetria, Comissão Nacional de Energia Nuclear,
Av. Salvador Allende s/n, Recreio dos Bandeirantes, 22780-160 Rio de Janeiro-RJ, Brazil
cLaboratório de Geologia Marinha, Universidade Federal Fluminense,
Campus da Praia Vermelha, 22410-346 Niterói-RJ, Brazil
Três testemunhos sedimentares foram coletados na Baía de Guanabara. Dois deles apresentaram perfis de concentração de 210Pb que poderiam ser utilizados para fins de datação. Taxas de
sedimentação de aproximadamente 1 cm ano-1 (cinco vezes superior aos valores de linha de
base) foram observadas para os dois testemunhos, coerentes com os dados existentes na literatura relacionada à datação de sedimentos da Baía de Guanabara, empregando-se 210Pb. A validação
da datação foi realizada com base nos perfis de cobre, cromo e chumbo, no fluxo de 210Pb e no
registro histórico das principais intervenções físicas ocorridas no século passado, tais como aterro, a canalização de rios principais e a construção de vias rápidas. No final deste processo, apenas a datação de um único testemunho pôde ser adequadamente validada.
Three sediment cores were taken from Guanabara Bay. Two of them yielded 210Pb profiles that
could be applied for dating purposes. Actual sedimentation rates of approximately 1 cm year-1 (five
times higher than the baseline values) were observed for both sediment cores, which agree with the reviewed existing data in the literature related to Guanabara Bay sedimentation rates based on 210Pb. Dating validation was carried out based on the chromium, copper and lead profiles, on
the 210Pb flux and on the historical record of the main physical interventions occurring in the last
century, such as embankment, the channeling of main rivers and the construction of express roads. At the end of this process, only one sediment core dating could be adequately validated.
Keywords: Guanabara Bay, sediment dating, heavy metals, siltation, Pb-210
Introduction
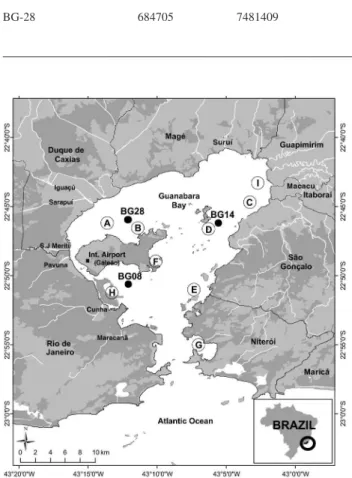
Guanabara Bay is located in the State of Rio de Janeiro, between parallels 22º 24’ and 22º 57’ south latitude and meridians 43º 33’and 43º 19’ west. The bay is an estuary with a total area of 346 km2, including 59 km2
of islands.
Guanabara Bay is one of the most important coastal bays in Brazil and is an estuary of 91 rivers and canals surrounded by the cities of Rio de Janeiro, Duque de Caxias, São Gonçalo, Niterói and some other small towns and villages.1 The estimated average flow of input of the
fresh water basin of the bay is approximately 100 m3 s-1,
where the flow varies from 33 m3 s-1 in July (dry season)
to a maximum of 186 m3 s-1 (rainy season). To this volume
is added 25 m3 s-1 for domestic waste water discharged
by the State Company for Water and Sewage (CEDAE). Therefore, it is estimated that the total flow of fresh water for the Guanabara Bay is approximately 125 m3 s-1.2
Guanabara Bay is narrow close to its mouth and wide at its interior, measuring approximately 30 km from north to south and approximately 28 km from east to west;2 its
from Ponta de São João (Rio de Janeiro) and the tip of Santa Cruz (Niterói).3
The drainage basin of Guanabara Bay has a total volume estimated at 2.2 × 10⁹ m3. The tidal currents are highly
efficient, and they provide a volume of water exchange of approximately 108 m3per tidal cycle, which is 10% of the
total volume of the bay.2 The mean residence time of the
waters of Guanabara Bay is 20 ± 5 days.2
The sediments of Guanabara Bay is composed mainly by sandy and silt-clay sediments.3 Additionally, clay-silt-sand
sediments occur on the coast of Caxias, São Gonçalo and the Catalão inlet (Fundão Island), and silt-sand sediments occur exclusively at the Caxias coastline. The sands are distributed at the entrance of the bay and the central channel extending to Governor Island.3 Deposits of mud and sand,
found in the northern part of the bay, are the result of the active transport of particulate matter and flocculated clays.3 Mangroves are important sources of sediments
in the northeastern region. In the northwestern and the western regions, the entry of sediments is substantial, and the area is highly influenced by human activities, such as sewage inputs, the channeling of rivers, deforestation and agricultural activities.3
The contribution of rivers to the siltation of Guanabara Bay is approximately 4,000,000 tons year-1. The supply
of river sediments is controlled by seasonal climatic cycles. Heavy summer rains are responsible for the most significant inflows of sediment. The sea, often considered the main source of sediment for many environments, has been considered a secondary source for Guanabara Bay.3
The sedimentation rate of Guanabara Bay has changed dramatically over the twentieth century; these changes are closely related to historical changes in the region. Studies conducted by Amador3 demonstrated that the more
affected region lies between the mainland and Governor Island, with a sedimentation rate of 0.27 cm year-1 between
the years 1850s to 1920s and an average 0.87 cm year-1
between the years 1940s to 1960s, reaching 1.0 cm year-1
in the 1990s. In regions close to the mainland, rates above 1.0 cm year-1 have been found. Wilken et al.5 determined
the sedimentation rates in the northwestern region of Guanabara Bay. The sedimentation rate was estimated using
210Pb obtaining a value of 2.0 cm year-1. Studies carried out
by Godoy et al.6 have shown that the sedimentation rates
found in different regions of Guanabara Bay are similar, with values between 1 and 2 cm year-1. These results agree
with values reported by the Japan International Cooperation Agency (JICA).7 Therefore, it is possible to conclude
that the sedimentation rates in Guanabara Bay have been increased by 10 times the original rate. The factors that lead to these higher sedimentation rates can be sub-divided into
(i) those that cause a potential large spatial scale increase in sedimentation rate, such as industrialization in the region and the growth of the population living around the bay and (ii) those that could produce a punctual increase such as construction of embankments, the expansion of the international airport and the rapid construction of transportation routes. The sediments of Guanabara Bay are considered highly enriched with Pb, Zn, Cu and Cr compared with the natural concentrations and other regions in the world.1,8 Several studies have noted that the main
burden of heavy metals reaches the bay through a few rivers located in the northwest, especially the Sarapui, Meriti, Iguaçu, Estrela and Irajá rivers.9-12 The high concentrations
of metals assigned to the northwest are due to discharge of the most polluted rivers in this area and the location of a large oil refinery in the region.1 However, studies indicate
that the rivers that cut through the cities of Niterói and São Gonçalo are also sources of heavy metals in Guanabara Bay, particularly to the east. The concentrations of metals in these rivers are due to urban development and the large amount of domestic sewage into the bay without treatment.13 Two other areas that have high concentrations
of heavy metals are the port of Rio de Janeiro and Jurujuba Bay, which is heavily polluted by domestic sewage.14 The
lowest concentrations of heavy metals are found in the southern region of the Bay, near the inlet. The northeastern and northwestern regions have the same kind of sediments; however, due to the existence of an environmental protected area at the northeastern part of the bay (APA Guapimirim), lower concentrations of heavy metal are found in this region compared with the northwestern part.1
The present work aimed to contribute the actual and baseline sedimentation rate values in Guanabara Bay, which can be used to evaluate the historical pollution in this important environment. In this direction, heavy metals were determined along the 210Pb-dated sediment cores and
the observed concentration changes correlated to local events. Additionally, the present work intends to review the existing 210Pb based data for actual and past sedimentation
rates in Guanabara Bay.
Experimental
Three sediment cores were collected using divers at the sampling points shown in Figure 1. The sampling point coordinates and main characteristics are presented in Table 1. The sediment cores were cut with 2 cm slices, dried at 110 °C until constant weight and fine ground using agate mortar.
The 210Pb concentrations were determined according
aliquots were taken and leached with 50 mL 0.5 mol L-1
HBr for 2 h at 80 °C. The obtained solution was separated and the residue leached with 50 mL 0.5 mol L-1 HBr and
1.0 g hydroxylamine hydrochloride for 2 h at 80 °C. A lead carrier was added to the resultant solution, and the mixture was transferred to an ion-exchange column containing a Dowex 1X8 50-100 mesh. This step was followed by a cleaning with 0.5 mol L-1 HBr and 1.0 g hydroxylamine
hydrochloride and further elution with 1 mol L-1 HNO 3.
The lead was precipitated as chromate, and the chemical yield was obtained gravimetrically. The concentration of 210Pb was determined based on its daughter decay
product, 210Bi, after a two-week ingrowth period by beta
counting on a ten-channel low-level proportional counter (Perkin-Elmer Prof. Berthold LB-750). The limit of detection of this technique is 1 Bq kg-1 for a 1,000-min
counting time.
For elemental analysis, a pseudo-total method was applied in which 250 mg sediment aliquots were digested with agua regia at 95 ºC, similarly to the EPA 3050-B method for ICP-AES but avoiding the use of H2O2 to
reduce the blank values. Lead, copper and chromium elemental concentrations were determined by ICP-MS (Varian ICP-MS 820), as described by Gomes et al.16 Blank
and reference samples (IAEA-405 sediment sample) were included in every sample batch. The limits of detection were several orders of magnitude lower than the elemental concentrations found in the sediment samples.
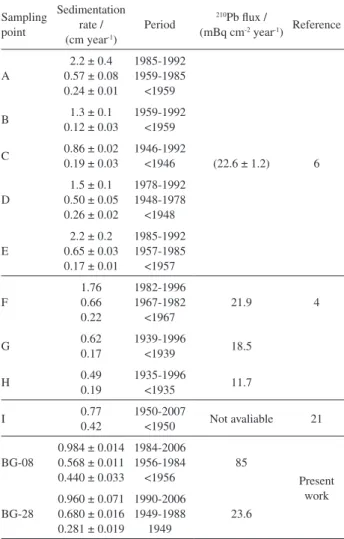
The sediment core chronologies were determined using the constant rate of supply (CRS) model17-19 for the sediment
cores, BG-08 and BG-28. Logarithmic plots of the 210Pb
concentration versus sediment depth were first built, and excess 210Pb was calculated by subtracting the constant
value observed in the core bottom, as shown in Figures 2a, b and c. According to Masqué et al.,20 these velocities should
be considered as an upper limit.
Table 2 presents the results obtained for the determination of Cr, Cu and Pb on marine sediment sample IAEA-405 together with the reference values. A statistically valid agreement (95%) for copper and lead, and a recovery of 62% for chromium can be observed. The aqua regia leaching provides a total recovery for many metals but not for chromium.21,22 To obtain the total chromium
concentration in the Guanabara Bay sediment samples, the obtained values were divided by 0.62 recovery factor.
Results and Discussion
Pb-210 sediment dating - cores BG-08, BG-14 and BG-28
As shown in Figure 2b, a relatively short 210Pb
exc profile
was obtained in sediment core BG-14. Although the decision was made to proceed only with the two other cores, it was done an estimative of the actual sedimentation rate at this region applying the constant flux and constant sediment accumulation rate model (CF:CS) on the first 25 cm 210Pb
results. The obtained value, 0.5 cm year-1, is on the range of Table 1. Actual sampling point coordinates and characteristics
Sampling point Coordinate X Coordinate Y Depth / m Local characteristics
BG-08 686866 7470863 8 Receives the release of domestic sewage, industrial waste and oil pollution arising from the presence of a harbor and several shipyards
BG-14 694668 7476534 4.6 Receives the input of sewage and industrial discharges from Niterói and São Gonçalo and small shipyards located on the coast of the bay
BG-28 684705 7481409 4.3 Located in the northwest of the bay, the most contaminated area of the bay. Suffers the contribution of domestic sewage and industrial effluents
those observed for the sampling point D (Table 3). According to variable sedimentation rates in Guanabara Bay,3,6 the
decision was made to apply the constant of rate supply model (CRS) in both cases (Figures 3a and b).
For the BG-08 and BG-28 sediment cores, actual and baseline sedimentation rates of approximately 1 and 0.3-0.4 cm year-1, respectively, were observed in agreement
with the previous studies carried out in Guanabara Bay (Table 3).
Although interventions in Guanabara Bay have occurred since colonial times, the major interventions have happened in the twentieth century with the industrial development of the regions surrounding the bay. Between 1949 and 1952, a group of eight islands were grounded in the region close to sampling point H for the construction of the actual University City (Figure 1). The region around Guanabara Bay called Baixada Fluminense, behind sampling point BG-28, suffered a major process of occupation after the 1940s, with the construction of urban lots, land filling and the opening of drainage channels. Up to late 1980s, a combination of factors may have caused changes in the sedimentation rate including
Figure 2. Total and excess 210Pb concentrations (a) BG-08, (b) BG-14
and (c) BG-28.
Table 2. Marine sediment reference sample IAEA-405: chromium, copper and lead recovery testing after “agua regia” leaching
Element Concentration / (µg g
-1 dry)
Obtained value N Certified value
Cr 51.9 ± 2.8 13 84.0 ± 4.0
Cu 49.5 ± 2.4 13 47.7 ± 1.2
Pb 76.6 ± 4.5 10 74.8 ± 2.2
Table 3. Guanabara Bay 210Pb based sedimentation rate and 210Pb flux
data found in the literature and the values obtained in the present work
Sampling point
Sedimentation rate / (cm year-1)
Period 210Pb flux /
(mBq cm-2 year-1) Reference
A
2.2 ± 0.4 0.57 ± 0.08 0.24 ± 0.01
1985-1992 1959-1985 <1959
(22.6 ± 1.2) 6
B 1.3 ± 0.1
0.12 ± 0.03
1959-1992 <1959
C 0.86 ± 0.02 0.19 ± 0.03
1946-1992 <1946
D
1.5 ± 0.1 0.50 ± 0.05 0.26 ± 0.02
1978-1992 1948-1978 <1948
E
2.2 ± 0.2 0.65 ± 0.03 0.17 ± 0.01
1985-1992 1957-1985 <1957
F
1.76 0.66 0.22
1982-1996 1967-1982 <1967
21.9 4
G 0.62
0.17
1939-1996
<1939 18.5
H 0.49
0.19
1935-1996
<1935 11.7
I 0.77
0.42
1950-2007
<1950 Not avaliable 21
BG-08
0.984 ± 0.014 0.568 ± 0.011 0.440 ± 0.033
1984-2006 1956-1984 <1956
85
Present work BG-28
0.960 ± 0.071 0.680 ± 0.016 0.281 ± 0.019
1990-2006 1949-1988
1949
the following: a growth of 40% of the population living around Guanabara Bay, the construction of the Marina da Glória, land filling to expand the International Airport, the construction of new urban areas around Governor’s Island, the construction of a large garbage dump for the Metropolitan Region of Rio de Janeiro and the construction of an express road called Red Line. These interventions help to explain the sedimentation rate inflexions observed during the 1950s and 1980s on sampling points BG-08 and BG-28.
Heavy metal profile and dating validation
Because anthropogenic or biological processes could alter the 210Pb record, the 210Pb-derived chronology should
be verified with other dating tracers such as artificial radionuclides (90Sr, 137Cs, 239,240Pu and 241Am).23 These
radionuclides are present in the marine environment due to the nuclear weapons testing during the 50-60’s and the Chernobyl accident in 1986. However, at the 20-30o latitude
band of the Southern Hemisphere the nuclear bomb fallout deposition is five times lower than observed, for example, at the 40-50o latitude band in the Northern Hemisphere.24
When well documented, the industrial development of a region is a valid alternative to the use of 137Cs.16
Table 4 compares the results obtained in the present work and the data found in the literature, most of which are related to superficial sediment samples with few exceptions, such as Godoy et al.6 A very large variability is observed,
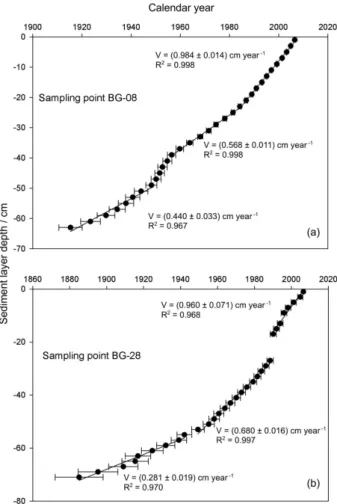
which correlates with the existence of localized (point) pollution sources for heavy metals such as chromium. According to Baptista Neto et al.,1 the actual concentration
ranges of Cr, Cu and Pb at sampling point BG-28 are 200-300, 80-100 and 60-100 mg kg-1, respectively, which fit
with the values presented in Figures 4a and b. The observed mean values for Cr, Cu and Pb along the sediment core (100 cm) taken at sampling point BG-08 were 143.8 ± 4.3 (n = 48), 68.2 ± 2.9 and 80.5 ± 4.1 mg kg-1, respectively,
also in agreement with the results published by Baptista Neto et al.1 These results are also in agreement with the
values published by Perin et al.25 for the sampling points
close to the Costa and Silva bridge for Cu and Pb, but are higher than the published values for Cr.
Figure 3. Calculated ages and sediment layer depth profiles (a) BG-08, (b) BG-28.
Table 4. Lead, copper and chromium concentrations in Guanabara Bay sediments: present work and data from the literature
Reference Region Pb Cu Cr
29 Northeastern 52-75 18-23
27 Northwestern 47-66
1 Bay as a whole 2-19340 2-18840 2-41364
13 Niteroi harbor 45-120 35-1450 75-230
30 Cunha channel 101-196 100-300 23-136
31 South Governador Island
150-180 86-97 44
32 Northeastern 87 47
Northwestern 26 28
Eastern 20 18
Western 130 80
14 Jurujuba inlet 5-123 5-213 10-223
33 Northeastern 69 119
6 close to São João Meriti river
3.6-228
close to Guapimirim river
11.6-34.8
close to Guaxindiba river
12.0-49.6
close to Imbuaçu river 2.5-37.1
25 Bay as a whole 0-178 0-139 0-72
34 close to São João Meriti river
169 508 87
10 Northwestern 14-100 20-300 20-500
Present work
BG-08 60-110 55-80 117-172
Sampling point BG-28 directly receives the impact of the most contaminated tributaries, such as the Estrela and Sarapuí-Iguaçu rivers. In particular, the Bayer industrial complex at Sarapuí River, opened in 1958, released a metal-rich effluent until 1982, when a new treatment plant was initiated. These two moments are observed in Figure 4a, particularly for Cr and Cu, with a sharp increase after 1960 and a decrease in the concentration after 1980, which validates the 210Pb dating. Kfouri et al.26 have identified Cr
in a short sediment core (50 cm) taken at the same region as that from BG-28, and similar concentrations were found for the surface layers, while even higher concentrations were observed at deeper layers of up to 1,460 mg kg-1.
The Cu and Cr correlation is shown in Figure 5a, and the ratio observed for the recent layer shows that after closing their common source, this relationship is lost. This higher Cu/Cr ratio for the present years can be an indicative of a new significant source of cupper to the Guanabara Bay sediments. In fact, nowadays, it is visible a very large amount of ships anchored in the bay which leads to the hypothesis that the anti-fouling paint represents this source.
The observed Pb profile (Figure 4b) was different from that of Cu and Cr and increased during the early 1960s. This result coincides with the opening of the Bayer industrial
complex but without a reduction after the mid-1980s, as observed with Cr and Cu, due to improvements to the effluent plant. Figure 5b shows the Cr and Pb correlation. It can be observed that, although part of the Pb found in the sediments may also come from the Bayer industries, it is not the only Pb pollution source. Gasoline additivation with lead was practiced in Brazil until 1992, but, based on the lead depth profile, lead input to Guanabara Bay still occurs. The presence of multiple sources of lead to Guanabara Bay was already noted by Geraldes et al.27 based on the variation
of lead isotopic ratios.
Based on the CRS model, it is possible to calculate the mass sedimentation rate (g cm-2 year-1) at each analyzed
sediment layer. Multiplying this rate by, for example, the concentration of a metal on the same layer, it is possible to obtain the metal flux to the sediment at the correspondent calendar year. Figure 6 shows the result obtained for chromium, the excess chromium (open dot) was calculated subtracting the baseline flux, that means, the chromium flux before 1960 (6 µg cm-2 year-1). The area bellow the
excess chromium flux curve corresponds to its load to the Guanabara Bay, at this region, due to the Bayer chemical complex and corresponds to 27 g m-2.
Figure 4. Sampling point BG-28: calculated ages and copper and
chromium profile (a) and lead profile (b). Figure 5. Sampling point BG-28: chromium and copper concentration
Sampling point BG-08 is located near the Costa e Silva bridge region where Perin et al.25 observed the highest Cu
and Pb concentrations in the sediments. Ten years later, Batista Neto et al.1 verified that this region is still heavily
contaminated by lead but not Cu. Pereira et al.28 have
demonstrated that the run-off from highways with heavy traffic can be a source of heavy metals to Guanabara Bay, which is particularly true for the region around the Costa e Silva bridge, which connects the cities of Rio de Janeiro and Niterói. The metal profiles in sediment core BG-08 were quite uniform and, therefore, not useful as a 210Pb
dating validation tool.
An additional validation tool is the 210Pb flux. The
calculated value for sediment core BG-28 was 23.6 mBq cm-2
year-1, which fits with the previously published data from
Godoy et al.6 and Lima.4 However, the obtained value for
sediment core BG-08 (85 mBq cm-2 year-1) was much higher
than the previously existing values, indicating a potential problem of sediment focusing. Due to the absence of a validation tool and a 210Pb flux far from the expected range
for this region, the BG-08 sediment core dating results should be used with caution. In contrast, sediment core BG-28 was validated by means of the Cu and Cr profiles, and the observed changes in the sedimentation rates fit with the existing data in the literature.3,4,6,35 Additionally,
the 210Pb flux agrees with the values reported by Lima,4
Wilken et al.5 and Godoy et al.6
Existing data on the Guanabara Bay 210Pb based
sedimentation rate
The first publication on 210Pb sediment dating applied
to Guanabara Bay appeared in 1986 by Wilken et al..5 In
this publication, there was no clear reference about the sampling point, only that it was collected at the northeastern
region, which is the most polluted area of the bay. A sedimentation rate of 1.8 cm year-1 for the upper 35 cm
layer was calculated by applying the CFCS (constant flux constant sedimentation) model. Based on the data in this publication, it was possible to estimate a 210Pb flux of
44 mBq cm-2 year-1.
Godoy et al.6 have analyzed five sediment cores (A-E)
as shown in Figure 1, dated with 210Pb applying the CRS
model, and the obtained results are shown in Table 3. Actual sedimentation rates between 1-2 cm year-1 were
observed, with acceleration in the sedimentation rate during the 1950s. The calculated mean 210Pb flux was
(22.6 ± 1.2) mBq cm-2 year-1.
Lima4 worked with an additional three cores, sampling
points F-H (Figure 1), dated with 210Pb applying the
CRS model, and the results are shown in Table 3. The calculated actual sedimentation rate ranged from 0.49 to 1.8 cm year-1. For two of these cores, the 210Pb flux was
similar to those observed by Godoy et al.,6 at 21.9 and
18.5 mBq cm-2 year-1, and another lower value at sampling
point H of 11.7 mBq cm-2 year-1. According to Lima,4
changes in the sedimentation rate appeared during the 1930s in cores G and H and in the late 1960s at sampling point F.
Monteiro et al.35 dated a sediment core (sampling
point I, Figure 3) sampled close to sampling point C reported by Godoy et al.6 The results were quite similar,
with a change to a higher sedimentation rate, from 0.42 to 0.77 cm year-1, occurring during the early 1950s (Table 3).
No data regarding the 210Pb flux were available.
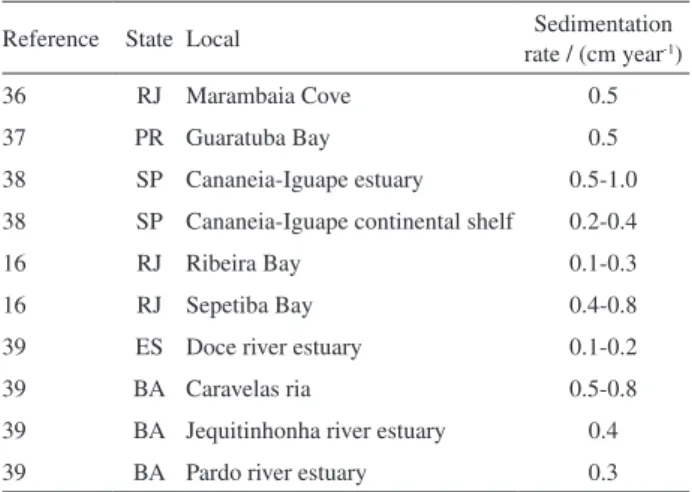
Additionally to the Guanabara Bay data (Table 3), it is shown on Table 5 210Pb based sedimentation rate
in different Brazilian coastal marine environments, estuaries and bays. It is possible to observe that for more pristine environments the sedimentation rate lies around 0.1-0.3 cm year-1 and on areas subjected to anthropogenic Figure 6. Sampling point BG-28: calculated ages and chromium flux
profile.
Table 5.210Pb based sedimentation rate data related to Brazilian estuaries
and bays found in the literature
Reference State Local Sedimentation
rate / (cm year-1)
36 RJ Marambaia Cove 0.5
37 PR Guaratuba Bay 0.5
38 SP Cananeia-Iguape estuary 0.5-1.0
38 SP Cananeia-Iguape continental shelf 0.2-0.4
16 RJ Ribeira Bay 0.1-0.3
16 RJ Sepetiba Bay 0.4-0.8
39 ES Doce river estuary 0.1-0.2
39 BA Caravelas ria 0.5-0.8
39 BA Jequitinhonha river estuary 0.4
impact this range rise to 0.5-1.0 cm year-1, being this
second range similar to that observed in Guanabara Bay. Unfortunately, no 210Pb atmospheric flux data was
available on these references.
Conclusions
Based on the existing data in the literature and the additional data presented in the current work, it is possible to conclude that, in general, the actual Guanabara Bay sedimentation rate is approximately 1 cm year-1, which
represents an increment of five in relation to the baseline values. Because the main sources of heavy metals to the bay are well known, their profile with the sediment layer depth represents a useful tool for 210Pb sediment dating.
Additionally, the observed period when changes in the sedimentation rate occur along the core and the 210Pb flux
can help with the validation of the calculated ages.
Acknowledgments
The authors would like to thanks Renato Carreira for his help with the Guanabara Bay sampling map, the anonymous reviewers for their comments which have quite improved the present publication and the Instituto Nacional de Ciência e Tecnologia-Transferência de Massa Continente Oceano for the financial support.
References
1. Baptista Neto, J. A.; Gingele, F. X.; Leipe, T.; Brehme, I.;
Environ. Geol.2006, 49, 1051.
2. Kjerfve, B.; Ribeiro, C. H. A.; Dias, G. T. M.; Filippo, A. M.; Quaresma, V. S.; Cont. Shelf Res.1997, 17, 1609.
3. Amador, E. S.; Baía de Guanabara e Ecossistemas Periféricos: Homem e Natureza, ISBN 85.900432-1-5, Rio de Janeiro, 1997.
4. Lima, A. L. C.; MSc Dissertation, Pontifícia Universidade Católica do Rio de Janeiro, Rio de Janeiro, Brazil, 1996. 5. Wilken, R. D.; Moreira, I.; Rebello, A; Sci. Total Environ.1986,
58, 195.
6. Godoy, J. M.; Moreira, I.; Bragança, M. J.; Wanderley, C.; Mendes, L. B.; J. Radioanal. Nucl. Chem.1998, 227, 157. 7. Japan International Cooperation Agency (JICA); The Study on
the Recuperation of the Guanabara Bay Ecosystem, Kokusai
Kogyo Co. Ltd.: Tokyo, SSR-JE-94-035, 1994.
8. Almeida, A. C. M.; Ph.D.Thesis, Pontifícia Universidade Católica do Rio de Janeiro, Rio de Janeiro, Brasil, 2003. 9. Carvalho, C. N.; Schorcher, H. D.; Environ. Tech. Lett.1982,
3, 425.
10. De Luca Rebello, A.; Haekel, W.; Moreira, I.; Santelli, R.; Schroeder, F.; Mar. Chem.1986, 18, 215.
11. Pfeiffer, W. C.; Fiszman, M.; Carbonell, N.; Environ. Pollut. 1980, 1, 117.
12. Pfeiffer, W. C.; Fiszman, M.; Rocha, N. C. C.; Environ. Pollut. 1982, 4, 193.
13. Baptista Neto, J. A.; Crapez, M.; McAllister, J. J.; Vilela, C. G.;
J. Coastal Res.2005, 21, 811.
14. Baptista Neto, J. A.; Smith, B. J.; McAllister, J. J; Environ. Pollut.2000, 109, 1.
15. Godoy, J. M.; Moreira, I.; Wanderley, C.; Simões Filho, F. F.; Mozeto, A. A.; Radiat. Prot. Dosim.1998, 75, 1.
16. Gomes, F. C.; Godoy, J. M.; Godoy, M. L. D. P.; Carvalho, Z. L.; Lopes, R. T.; Sanchez-Cabeza, J. A.; Lacerda, L. D.; Wasserman, J. C.; Mar. Pollut. Bull.2009, 59, 123.
17. Appleby, P. G.; Oldfield, F. In Uranium-Series Disequilibrium; Ivanovich, M.; Harmon, R. S., eds.; Oxford University Press: Oxford, 1992, pp. 731-778.
18. Joshi, S. R.; Shukla, B. S.; J. Radioanal. Nucl. Chem. 1991,
148, 73.
19. Sanchez-Cabeza, J. A.; Ani-Ragolta, I.; Masqué, P.; Limnol. Oceanogr. 2000, 45, 990.
20. Masqué, P.; Fabres, J.; Canals, M.; Sanchez-Cabeza, J. A.; Sanchez-Vidal, A.; Cacho, I.; Calafat, A. M.; Bruach, J. M.;
Mar. Geol.2003, 193, 207.
21. Kackstaetter, U. R.; Heinrichs, G.; Water, Air, Soil Pollut.1997,
95, 119.
22. Larner, B. L.; Seen, A. J.; Townsend, A. T.; Anal. Chim. Acta 2006, 556, 444.
23. Smith, J. N.; J. Environ. Radioact.2001, 55, 121.
24. United Nations Scientific Committee on the Effects of Atomic Radiation (UNSCEAR); Sources and Effects of Ionizing Radiation, United Nations: New York, 1982.
25. Perin, G.; Fabris, R.; Manente, S.; Wagener, A.; Water Res. 1997, 31, 3017.
26. Kfouri, P. B. P.; Figueira, R. C. L.; Figueiredo, A. M. G.; Souza, S. H. B.; Eichler, B. B.; J. Radioanal. Nucl. Chem. 2005, 265, 459.
27. Geraldes, M. C.; Paula, A. H.; Godoy, J. M.; Valeriano, C. M.;
J. Geochem. Explor.2005, 88, 384.
28. Pereira, E.; Baptista-Neto, J. A.; Smith, B. J.; McAllister, J. J.;
An. Acad. Bras. Ciênc.2007, 79, 739.
29. Borges, A. C.; Dias, J. C.; Machado, W.; Sambasiva, R. P.;
Quím. Nova2007, 30, 66.
30. Barbosa, M. C.; Almeida, M. S. S.; Mariz, D. F.; Almeida, J. L. D. S.; J. Hazard. Mater.2004, 10, 29.
31. Kerhrig, H. A.; Pinto, F. N.; Moreira, I.; Malm, O.; Org. Geochem.2003, 34, 661.
32. Machado, W.; Silva-Filho, E. V.; Oliveira, R. R.; Lacerda, L. D.;
Mar. Pollut. Bull.2002, 44, 1277.
33. Faria, M. M.; Sanchez, B. A.; An. Acad. Bras. Ciênc.2001, 73, 121. 34. Rego, V. S.; Pfeiffer, W. C.; Barcellos, C. C.; Rezende, C. E.;
35. Monteiro, F. F.; Cordeiro, R. C.; Santelli, R. E.; Machado, W.; Evangelista, H.; Villar, L. S.; Viana, L. C. A.; Bidone, E. D.;
Environ. Earth Sci. 2012, 65,1661.
36. Patchineelam, S. M.; Sanders, C. J.; Smoak, J. M.; Zem, R. C.; Oliveira, G.; Patchineelam, S. R.; J. Braz. Chem. Soc.2011, 22, 120.
37. Sanders, C. J.; Santos, I. R.; Silva-Filho, E. V.; Patchineelam, S. R.; Mar. Pollut. Bull.2006, 52, 1085.
38. Saito, R. T.; Figueira, R. C. L.; Tessler, M. G.; Cunha, I. I. L.;
J. Radioanal. Nucl. Chem. 2001, 250, 109.
39. Patchineelam, S. R.; Smoak, J. M.; Geo-Mar. Lett.1999, 19, 196.
Submitted: January 18, 2012