Article
J. Braz. Chem. Soc., Vol. 23, No. 7, 1298-1304, 2012. Printed in Brazil - ©2012 Sociedade Brasileira de Química 0103 - 5053 $6.00+0.00
A
*e-mail: [email protected]
Preparation and Electrochemical Properties of Homogeneous Carbon-Coated
LiFe
0.9Mn
0.1PO
4as Cathode Material for Lithium-Ion Batteries
Yang Xu, Jingang Yu, Sui Peng, Suqin Liu, Zhongqiang Wei, Xianhong Li and Yajuan Li*
College of Chemistry and Chemical Engineering, Central South University, Changsha, 410083, Hunan, P. R. China
Um material catódico homogêneo contendo LiFe0.9Mn0.1PO4 recoberto com carbono foi sintetizado através de uma reação de etapa única no estado sólido usando glucose como fonte de carbono. Difratometria de raios X de pó (XRD), microscopia eletrônica de transmissão (TEM), voltametria cíclica (CV), espectroscopia de impedância eletroquímica (EIS) e medidas galvanostáticas foram empregadas na caracterização das amostras. A dopagem com manganês e a comodificação com carbono não afetaram a estrutura de olivina do LiFePO4, mas melhoraram a sua cinética em termos da quantidade de energia elétrica fornecida, da polarização e da capacidade de manter uma alta capacitância em altas taxas de carga e descarga. Quando comparado com o LiFePO4/C não-dopado, o LiFe0.9Mn0.1PO4/C apresentou uma boa distribuição de tamanho – em
torno de 100-200 nm – e um desempenho eletroquímico melhor. Em taxas de 0,1, 1,0, 3,0 e 10,0 C (C = 170 mA g-1), o eletrodo LiFe
0.9Mn0.1PO4/C apresentou capacidades de descarga de 154,1,
138,8, 120,0 e 94,0 mA h g-1, respectivamente. Resultados obtidos por voltametria cíclica (CV) e
espectroscopia de impedância eletroquímica (EIS) indicaram que a polarização e a resistência de transferência de carga da amostra diminuíram significativamente devido à dopagem com manganês.
Homogeneous carbon-coated LiFe0.9Mn0.1PO4 cathode material was synthesized by one-step solid-state reaction using glucose as carbon source. Powder X-ray diffractometry (XRD), transmission electron microscopy (TEM), cyclic voltammetry (CV), electrochemical impedance spectroscopy (EIS) and galvanostatic measurements were employed to characterize the samples. Mn-doping and carbon co-modification did not affect the olivine structure of LiFePO4, but improved
its kinetics in terms of capacity delivery, polarization and rate capability. When compared with the undoped LiFePO4/C, the LiFe0.9Mn0.1PO4/C sample presented good size distribution – around 100-200 nm – and better electrochemical performance. At current rates of 0.1, 1.0, 3.0 and 10.0 C (C = 170 mA g-1), the LiFe
0.9Mn0.1PO4/C electrode delivered discharge capacities of 154.1,
138.8, 120.0 and 94.0 mA h g-1, respectively. Results obtained by cyclic voltammetry (CV) and
electrochemical impedance spectroscopy (EIS) indicated that the polarization and charge transfer resistance of the sample were greatly decreased by Mn-doping.
Keywords: Mn-doping, LiFePO4, cathode material, lithium-ion batteries
Introduction
Lithium-ion batteries (LIBs) have been widely used in portable electronic devices due to their excellent performance. LIBs are also considered as ideal power supply for electric and hybrid electric vehicles to relieve the pressure from increased oil prices and environmental
issues in the future.1,2 Compared with conventional
cathode materials such as LiCoO2, LiMn2O4 and LiNiO2,
olivine-type structure LiFePO4 is one of the most
promising candidates due to its high theoretical capacity
of 170 mA h g-1, high lithium intercalation voltage of
3.4 V versus lithium metal, good thermal stability and
long operation life. Most importantly, olivine LiFePO4
possesses other advantages such as environmental
benignity and low cost.3,4 Despite these advantages, olivine
LiFePO4 has an intrinsically low electronic conductivity
(ca. 10-9-10-10 S cm-1 at room temperature) and low Li+
diffusion rate (ca. 1.8 × 10⁻¹⁴ cm2 s-1 at room temperature),
which may hinder the mobility of electrons and Li+ transport
in the electrochemical reaction.5,6 Numerous efforts have
been undertaken to overcome these problems: (i) coating
with electronically conductive agents (e.g. carbon, Cu,
electrochemical properties (e.g. Mg2+, Zr4+, Cr3+)9-12 and
(iii) developing synthetic methods to get small particles
with well-defined morphology.13,14
LiFePO4 can be synthesized by a number of methods,
including traditional solid-state reaction, hydrothermal syntheses, sol-gel processing, co-precipitation and
microwave methods.15-19 Recently, solid-state reactions have
been considered appropriate for the commercial production
of LiFePO4, being also widely used to prepare the highly
crystalline olivine-phase LiFePO4. Olivine-type LiFePO4
cathode materials were synthesized by a solid-state reaction
method and ball-milling.20 LiFePO
4/C, on its turn, was
prepared via a mechanochemical activation/sintering
process using citric acid as carbon source, and showed the
discharge capacity of 153 mA h g-1 at current rate of 1 C and
92 mA h g-1 at 20 C.21 More recently, Wang et al.22 reported
that the rate capability of LiFePO4 can be enhanced by light
doping with manganese.
As known, carbon-coating can provide conductive connections between the active particles and create pathways for electron transfer, resulting in an increased electronic
conductivity that influences cycling and rate performances.23
Simultaneously, partial substitution of Mn2+ for Fe2+ can
enhance the mobility of the lithium ions.22 Constructing
LiFePO4 with both carbon-web and ionic doping may be
effective to achieve better electrochemical performance.
In this work, homogeneous carbon-coated LiFe0.9Mn0.1PO4
(LiFe0.9Mn0.1PO4/C) cathode material was synthesized by a
solid-state reaction method and ball-milling procedure using
glucose as carbon source. Compared with the LiFePO4/C
composite cathode, LiFe0.9Mn0.1PO4/C showed a better
electrochemical performance including initial capacity, rate capability, capacity fading and polarization.
Experimental
Synthesis of LiFe0.9Mn0.1PO4/C and LiFePO4/C
LiFe0.9Mn0.1PO4/C was synthesized from the starting
materials Li2CO3 (99%, AR), FeC2O4·2H2O (99%, AR),
Mn(Ac)2·4H2O (99%, AR), (NH4)H2PO4 (99%, AR) and glucose
(99%, AR) using a solid-state reaction method. The molar ratio of Li2CO3:FeC2O4·2H2O:Mn(Ac)2·4H2O:(NH4)H2PO4
in the reaction mixture was 0.5:0.9:0.1:1.0. All the starting materials were ball milled for 6 h in a planetary mill with stainless steel vessels and balls, using ethanol as milling medium, ball-to-powder weight ratio of 20:1 and a rotation speed of 300 rpm. Ethanol was removed by evaporation in a blast oven at 60 °C and then the residual mixture was heat-treated in a tube furnace under argon atmosphere at 700 °C for 12 h. Carbon converted from glucose acted as
reducing and conducting agent and its amount was 10 wt.%
in the final material. For comparison, the undoped LiFePO4/C
composite was also prepared by an identical process except
by the addition of Mn(Ac)2·4H2O.
Characterizations
The crystal structure of the samples was characterized by powder X-ray diffractometry (XRD) on a RigaKu D/max 2550VB+ 18 kW equipment using
graphite-monochromatized Cu Kα radiation (40 kV, 250 mA). The
surface morphology of the samples was observed with a JEM-2010 transmission electron microscope (TEM). The chemical composition was determined with an inductively coupled plasma spectrometer (ICP, Thermo Fisher Scientific, 6500) and with an energy dispersive X-ray spectrometer (EDX) coupled to a JSM-6360-LV scanning electron microscope. The content of carbon was determined by the use of a C-S800 infrared carbon-sulfur analyzer.
T h e e l e c t r o c h e m i c a l p r o p e r t i e s o f t h e
LiFe0.9Mn0.1PO4/C and LiFePO4/C samples were evaluated
with CR2016 coin cells. The cathode was prepared by mixing 80 wt.% of the active material with 10 wt.% acetylene black and 10 wt.% polytetrafluoroethylene (PTFE) emulsion binder. This slurry was pressed on
a current collector of aluminum foil (Φ 10 mm) at
15 MPa and dried at 383 K for 12 h in a vacuum oven. The cells were assembled in an argon-filled glove box (Mbraun, Unilab, Germany) using lithium foil as anode,
Celgrade® polypropylene as separator and LiPF
6 1 mol L-1 in
a mixture of EC/DMC/DEC (ethylene carbonate/dimethyl carbonate/diethyl carbonate, volume ratio of 1:1:1) as the electrolyte. Galvanostatic charge-discharge measurements were performed between 2.0 and 4.2 V at room temperature (25 °C) by the use of a LAND battery testing system (CT2001A, Wuhan Land Electronic Co. Ltd., China). Cyclic voltammetry measurements were performed using a CHI660C workstation (Shanghai Chenhua Instrument Co.
Ltd., China) at a scan rate of 0.1 mV s-1 between 2.5-4.2 V.
Electrochemical impedance (EIS) spectra were recorded on a Princeton workstation (PARSTAT2273, EG&G, US) by applying an alternating voltage of 5 mV over the frequency ranging from 0.01 Hz to 100 kHz.
Results and Discussion
Physical properties and morphology
Figure 1a shows the XRD patterns for LiFePO4/C and
LiFe0.9Mn0.1PO4/C. All patterns can be indexed on the bases
the same as the standard one (JCPDS card No. 83-2092), and no impurities were detected. Rietveld refinements were carried out by using the Jade 6.5 program for both samples. The typical XRD pattern refinement of LiFe0.9Mn0.1PO4/C is
shown in Figure 1b. Because the correlation R index is less
than 10%, and the differences are within error range, the Rietveld refinement results are reliable. It is then possible
to indicate that Mn enters the structure of LiFePO4 instead
of forming impurities. There is also no evidence for the formation of crystalline or amorphous carbons. The peaks of the LiFe0.9Mn0.1PO4/C pattern are stronger and narrower
than those of LiFePO4/C, indicating the high crystallinity of
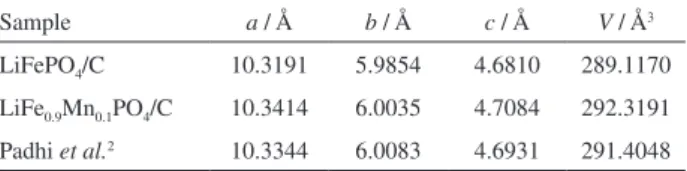
LiFe0.9Mn0.1PO4/C. Table 1 shows the lattice parameters of
the samples calculated from the XRD patterns. It is observed that the lattice parameters of the two samples are similar
to the reported values.3,24 As shown in Table 1, the unit
cell parameters and unit cell volume of LiFe0.9Mn0.1PO4/C
changed a little, i.e., the length of a-axis, b-axis, c-axis and
unit cell volume have all increased. Compared with
LiFePO4/C, the unit parameters and unit cell volume of
LiFe0.9Mn0.1PO4/C are both expanded, which can be attributed
Figure 1. (a) XRD patterns of LiFePO4/C and LiFe0.9Mn0.1PO4/C and
(b) Rietveld refinement of LiFe0.9Mn0.1PO4/C sample (red dot: observed,
black line: calculated and bottom curve: difference).
to the ionic radius of Mn2+ (0.97Å), bigger than that of Fe2+
(0.92 Å). The results also indicate that manganese and iron both occupy 4c sites at the tetrahedral Fe environment in LiFe0.9Mn0.1PO4/C.25 The expansion in the crystal lattice can
provide more space for lithium intercalation/de-intercalation.
When Fe2+ changes to Fe3+ during de-intercalation, the
lattice collapses and limits ion diffusion. In the doped LiFe0.9Mn0.1PO4/C, Mn2+ ions in the lattice may act as a pillar
to prevent the collapse of the crystals during cycling and thus
improve the electrochemical performance.11,26
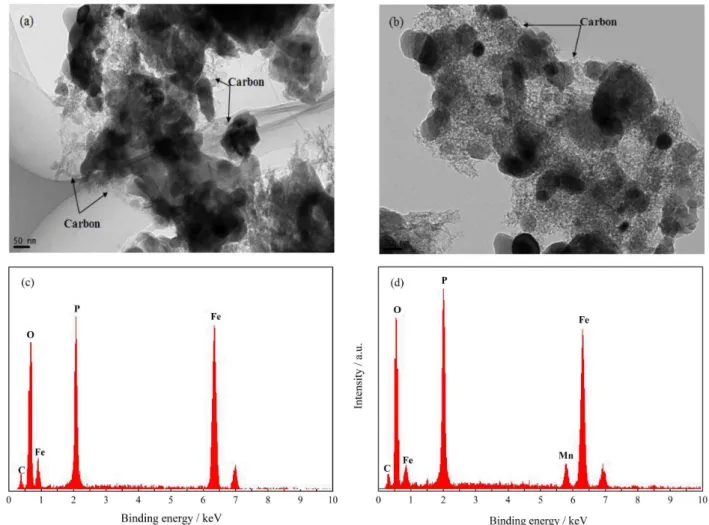
TEM images of LiFePO4/C and LiFe0.9Mn0.1PO4/C
are shown in Figure 2. The two samples are composed of small agglomerated particles whose size is in the range of
100-200 nm. Compared with the undoped LiFePO4/C, the
LiFe0.9Mn0.1PO4/C sample has a smaller particle size. TEM
analysis confirms a primary crystallite aggregate structure for both LiFePO4/C and LiFe0.9Mn0.1PO4/C. The crystallite
size of LiFePO4/C is obviously larger than the one observed
for LiFe0.9Mn0.1PO4/C. The uniform and small particle
size of LiFe0.9Mn0.1PO4/C will be beneficial to reduce the
diffusion length of lithium ion inside the materials, resulting in fast reaction and diffusion kinetics, which can improve charge-discharge capacity and cycling performance. Some uniform carbon-webs are found in the interstitial particle and boundary region (marked with arrows in Figure 2), which are generated from the carbonization of glucose. The carbon webs provide highly conductive channels for the electron
mobility among LiFePO4 active particles and enhance
the electronic conductivity of the composites.27 The EDX
spectra of LiFePO4/C (Figure 2c) and LiFe0.9Mn0.1PO4/C
(Figure 2d) clearly confirm that the LiFe0.9Mn0.1PO4/C
sample contains Fe, P, O, C and an amount of Mn, while
LiFePO4/C does not contain Mn. The atomic ratio of
Mn:Fe:P (0.105:0.896:1.000) can be calculated from the EDX pattern. Coupled with the results of the ICP analysis,
the real chemical compositions of the LiFe0.9Mn0.1PO4/C
sample is identified as Li0.996Fe0.896Mn0.105PO4/C, which is
very close to the designed value.
Electrochemical characterization
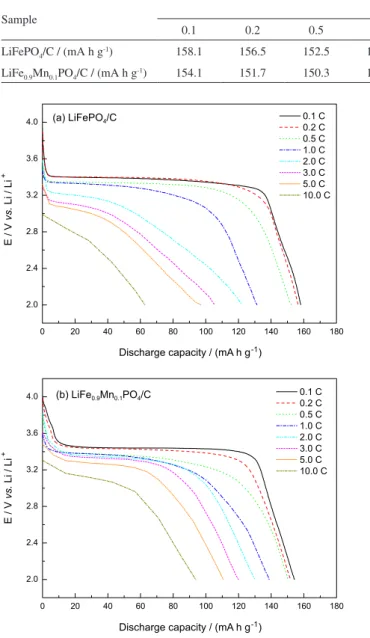
Figure 3 shows the initial discharge curves of the
LiFePO4/C and LiFe0.9Mn0.1PO4/C cathodes at current
Table 1. Lattice parameters of LiFePO4/C and LiFe0.9Mn0.1PO4/C
Sample a / Å b / Å c / Å V / Å3
LiFePO4/C 10.3191 5.9854 4.6810 289.1170
LiFe0.9Mn0.1PO4/C 10.3414 6.0035 4.7084 292.3191
rates from 0.1 to 10.0 C (C = 170 mA g-1). The cells
were tested in two models: (i) charged and discharged
both at 0.1-1.0 C, as low rate test, and (ii) charged at
1 C and discharged at 2.0-10.0 C, as high rate test. There is no observable charge/discharge plateau associated
with the Mn2+/Mn3+ redox couple in Figure 3b. This
indicates that Fe2+/Fe3+ is practically the only redox couple
that contributes to the electrochemical reaction in the
LiFe0.9Mn0.1PO4/C cathode. It is also observed that the
discharge performance of undoped LiFePO4/C is strongly
affected by the current density, and its average discharge voltage obviously decreases from 3.40 V (0.1 C) to 2.80 V (10.0 C) with increasing current densities. However,
LiFe0.9Mn0.1PO4/C exhibits an increased initial discharge
voltage at all test rates, and the drop of voltage is eased with the increased current densities (3.45 V at 0.1 C and 3.12 V at 10.0 C). This confirms that Mn-doping eases the polarization of the active materials under high current density, and the electrode kinetics of the cathode material
is thus improved.28
LiFePO4/C delivers a discharge capacity of
158.1 mA h g-1 at a low discharge rate of 0.1 C (170 mA g-1)
(Figure 3a, Table 2), corresponding to 93% of the theoretical capacity of LiFePO4. LiFe0.9Mn0.1PO4/C shows a
discharge capacity of 154.1 mA h g-1 at 0.1 C rate. Since the
Mn2+/Mn3+ redox couple contributes very little to the
capacity, the theoretical capacity of LiFe0.9Mn0.1PO4/C is
reduced to 153 mA h g-1. It is suggested that almost the
full Fe2+ amount in LiFe
0.9Mn0.1PO4/C is electrochemically
utilized at 0.1 C rate, indicating that the utilization of the
Fe2+/Fe3+ redox reaction is improved with Mn-doping.
Furthermore, LiFePO4/C exhibits discharge capacities of
131.5, 105.8, 97.1 and 62.8 mA h g-1 at high discharge
rates of 1.0, 3.0, 5.0 and 10.0 C, respectively. However,
LiFe0.9Mn0.1PO4/C shows better rate capability as
its discharge capacities can reach 138.8, 120.0 and
110.7 mA h g-1 at the high discharge rates of 1.0, 3.0 and
5.0 C, respectively. When the current is increased to a rate of 10.0 C, the discharge capacity of the LiFe0.9Mn0.1PO4/C
material can reach the value of 94.0 mA h g-1.
The cycle performances of the LiFePO4/C and
LiFe0.9Mn0.1PO4/C cathodes at various current rates
are presented in Figure 4. Due to the limited lithium diffusion and electronic conduction, the discharge capacity
decreased with increasing current rates. LiFe0.9Mn0.1PO4/C
shows better discharge capacity at high current rates than
LiFePO4/C. Both samples exhibit good performance on
capacity retention because of the carbon-coating. This suggests that the carbon-coating protects the active material from the direct contact with the electrolyte, thus improving
the electronic conductivity of LiFePO4.
The electrodes were cycled at 0.1 C after 120 cycles with various current rates. For both samples, full recovery of the discharge capacity is observed at 0.1 C rate even after continuous 10.0 C rate cycles, indicating that the structures of the two samples are very stable during the high rate cycling. The good rate capability of LiFe0.9Mn0.1PO4/C
can be attributed to the highly uniform distribution of carbon and to the reduced polarization and improved lithium ion diffusion in the lithium intercalation/de-intercalation process induced by Mn-doping.
The effects of Mn-doping on the electrochemical
performance of the LiFePO4/C material were further
studied by cyclic voltammetry (CV). Figure 5 shows
the CV curves of the LiFePO4/C and LiFe0.9Mn0.1PO4/C
cathodes at a scan rate of 0.1 mV s-1. A pair of redox peaks
is obviously found in the CV curves, and is related to the
two-phase charge-discharge reaction of the Fe2+/Fe3+ redox
couple. The redox peaks of LiFe0.9Mn0.1PO4/C are sharper
than those of LiFePO4/C. For the LiFePO4/C cathode, the
oxidation and reduction peaks center at ca. 3.631 and
3.244 V, respectively. The potential separation between the two peaks is 0.387 V. However, in the case of the
LiFe0.9Mn0.1PO4/C cathode, the oxidation and reduction
peaks center at ca. 3.560 and 3.371 V, respectively, with
a potential separation of 0.189 V, less than that observed
for LiFePO4/C. This is indicative of small electrode
polarization and good kinetics. The potential interval between the oxidation and reduction peaks was used to evaluate the electrochemical reaction reversibility
of electrode materials.29 According to this work, the
narrow peak interval and high peak currents indicate the enhancement of the electrode reaction reversibility by carbon-coating and Mn-doping.
Figure 3. The initial discharge curves of (a) LiFePO4/C and
(b) LiFe0.9Mn0.1PO4/C at various current rates (0.1 to 10.0 C, C = 170 mA g-1) in the voltage range of 2.0-4.2 V (vs. Li/Li+).
Table 2. The initial discharge capacity of LiFePO4/C and LiFe0.9Mn0.1PO4/C at current rates of 0.1 to 10.0 C (C = 170 mA g-1)
Sample Current rate / C
0.1 0.2 0.5 1.0 2.0 3.0 5.0 10.0 0.2
LiFePO4/C / (mA h g-1) 158.1 156.5 152.5 131.5 122.5 105.8 97.1 62.8 156.5
LiFe0.9Mn0.1PO4/C / (mA h g-1) 154.1 151.7 150.3 138.8 129.7 120 110.7 94 151.7
Figure 4. Cycle performance of LiFePO4/C and LiFe0.9Mn0.1PO4/C at
various current rates (0.1 to 10.0 C, C = 170 mA g-1) in the voltage range
Table 3. Fitting results of impedance parameters and lithium diffusion
coefficient (D) of LiFePO4/C and LiFe0.9Mn0.1PO4/C cathodes
Sample Re / Ω Rct / Ω D / (cm2 s-1)
LiFePO4/C 0.9655 120.9 4.81 × 10⁻¹⁴
LiFe0.9Mn0.1PO4/C 1.254 52.7 9.66 × 10⁻¹⁴
Figure 5. Cyclic voltammograms of LiFePO4/C and LiFe0.9Mn0.1PO4/C
cathodes at a scan rate of 0.1 mV s-1.
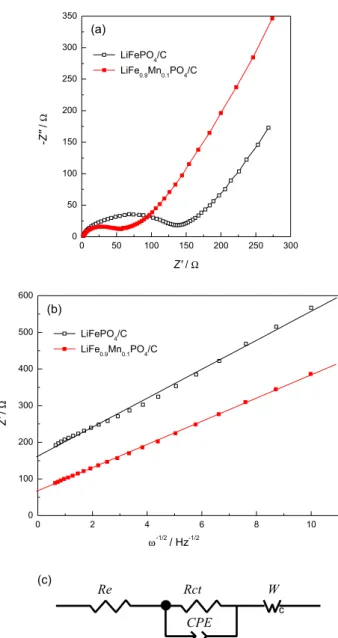
Figure 6. (a) Electrochemical impedance spectra of the LiFePO4/C and
LiFe0.9Mn0.1PO4/C cathodes, (b) the relationship between Z’ and ω-1/2 in
the low-frequency region and (c) corresponding equivalent circuit model. In order to estimate the lithium ion diffusion coefficient
in the two samples, the electrochemical impedance spectra were registered at room temperature. For this, the cathodes were charged to 3.4 V in the second cycle and then maintained at 3.4 V; typical results are shown in Figure 6a. It is obvious that both spectra are composed of a depressed semicircle in the high frequency and a straight line in the low frequency regions. In Figure 6c, the impedance spectra are fitted with the fitting equivalent circuit model.
The intercept at the real impedance axis (Z’) identifies
the resistance of the electrolyte (Re). The high frequency
semicircle can be assigned to the charge transfer resistance
(Rct) and corresponds to the constant phase element (CPE)
of the double layer. The sloping line at low frequency can
be attributed to the Warburg impedance (W), which is
associated with the lithium diffusion in the solid phase. The fitting results of Re and Rct by the equivalent circuit (shown
in Table 3) indicate that the Rct values of LiFe0.9Mn0.1PO4/C
(52.7 Ω) are smaller than that for LiFePO4/C (120.9 Ω). This
confirms that the electrochemical activity of LiFePO4/C is
improved by doping with a certain amount of Mn2+.
The lithium ion diffusion coefficient D can be calculated
according to the following equation:30
(1)
Here R is the gas constant, T the absolute temperature, A
the surface area of the electrode, n the number of electrons
per molecule during the oxidation, F the Faraday constant,
C the concentration of lithium ion and σ is the Warburg
factor, which is related to Z’ by the following, where ω is
frequency:30
Z’ = Re + Rct + σω-1/2 (2)
Figure 5b shows the relationship between Z’ and ω-1/2
in the low frequency region. The lithium ion diffusion coefficients for both samples are also listed in Table 3. The lithium ion diffusion coefficient is effectively increased by Mn-doping. The decrease in the charge transfer resistance and the increase in the lithium ion diffusion
coefficient of LiFe0.9Mn0.1PO4/C are originated from the
to the carbon coating and the larger lattice parameters generated by Mn-doping.
Conclusions
Olivine-structured LiFePO4/C and LiFe0.9Mn0.1PO4/C
composites were successfully synthesized by a solid-state reaction. Powder XRD analysis showed that no impurities were detected and the lattice parameters changed with
Mn-doping. Compared with undoped LiFePO4/C,
LiFe0.9Mn0.1PO4/C showed a better electrochemical
performance in terms of faster activation, lower electrode polarization and better rate capability, which were attributed to the enhancement of the electronic inductivity by ion doping. At current rates of 0.1, 1.0, 3.0, 5.0 and 10.0 C,
the LiFe0.9Mn0.1PO4/C electrode delivered a discharge
capacity of 154.1, 138.8, 120.0, 110.7 and 94.0 mA h g-1,
respectively. Results of CV and EIS studies indicated that the combination of Mn-doping and carbon-coating helped
to improve the electrochemical properties of LiFePO4.
Acknowledgements
This work was supported by the National Science Foundation of P. R. China (grants No. 51104184 and 50972165) and the Graduate Degree Thesis Innovation Foundation of Central South University (2011ssxt077).
References
1. Bruce, P. G.; Scrosati, B.; Tarascon, J. M.; Angew. Chem., Int. Ed.2008, 47, 2930.
2. Mizushima, K.; Jones, P. C.; Wiseman, P. J.; Goodenough, J. B.;
Mater. Res. Bull. 1980, 15, 783.
3. Padhi, A. K.; Nanjundaswamy, K. S.; Goodenough, J. B.;
J. Electrochem. Soc.1997, 144, 1188.
4. Padhi, A. K.; Nanjundaswamy, K. S.; Masquelier, C.; Okada, S.; Goodenough, J. B.; J. Electrochem. Soc.1997, 144, 1609.
5. Chung, S. Y.; Blocking, J. T.; Chiang, Y. M.; Nat. Mater.2002,
1, 123.
6. Lu, Z. G.; Cheng, H.; Lo, M. F.; Chung, C. Y.; Adv. Funct. Mater.2007, 17, 3885.
7. Bauer, E. M.; Belutto, C.; Pasqual, I. M.; Electrochem. Solid-State Lett. 2004, 7, 85.
8. Mi, C. H.; Cao, Y. X.; Zhang, X. G.; Zhao, X. B.; Li, H. L.;
Powder Technol. 2008, 181, 301.
9. Wang, D. Y.; Li, H.; Shi, S. Q.; Huang, X. J.; Chen, L. Q.;
Electrochim. Acta2005, 50, 2955.
10. Yao, J.; Konstantinov, K.; Wang; G. X.; Liu, H. K.; J. Solid State Electrochem.2007, 11, 177.
11. Shin, H. C.; Park, S. B.; Jang, H.; Chung, K. Y.; Cho, W. I.; Kim, C. S.; Cho, B. W.; Electrochim. Acta2008, 53, 7946.
12. Yin, X. G.; Huang, K. L.; Liu, S. Q.; Wang, H. Y.; Wang, H.;
J. Power Sources2010, 195, 4308.
13. Wang, Y. G.; Wang, Y. R.; Hosono, E. J.; Wang, K. X.; Zhou, H. S.; Angew. Chem., Int. Ed.2008, 47, 7461.
14. Ellis, B.; Kan, W. H.; Makahnouk, W. R. M.; Nazar, L. F.;
J. Mater. Chem. 2007, 17, 3248.
15. Kim, J. K.; Cheruvally, G.; Ahn, J. H.; J. Solid State Electrochem.2008, 12, 799.
16. Dokko, K.; Koizumi, S.; Sharaishi, K.; Kanamura, K.; J. Power Sources2007, 165, 656.
17. Dominko, R.; Bele, M.; Gaberscek, M.; Remskar, M.; Hanzel, D.; Goupil, J. M.; Pejovnik, S.; Jamnik, J.; J. Power Sources 2006, 153, 274.
18. Zhou, W. J.; He, W.; Li, Z. M.; Zhao, H. S.; Yan, S. P.; J. Solid State Electrochem.2009, 13, 1819.
19. Higuchi, M.; Katayama, K.; Azuma, Y.; Yukawa, M.; Suhara, M.; J. Power Sources2003, 119-121, 258.
20. Kang, H.C.; Jun, D. K.; Jin, B.; Jin, E. M.; Park, K. H.; Gu, H. B.; Kim, K. W.; J. Power Sources 2008, 179, 340.
21. Zhang, D.; Yu, X.; Wang, Y. F.; Cai, R.; Shao, Z. P.; Liao, X. Z.; Ma, Z. F.; J. Electrochem. Soc.2009, 156, 802.
22. Wang, X. F.; Zhang, D.; Yu, X.; Cai, R.; Shao, Z. P.; Liao, X. Z.; Ma, Z. F.; J. Alloys Compd. 2010, 492, 675.
23. Chen, J. M.; Hsu, C. H.; Lin, Y. R.; Hsiao, M. H.; Fey, G. T. K.;
J. Power Sources2008, 184, 498.
24. Wang, B. F.; Qiu, Y. L.; Li, Y.; Electrochem. Commun.2006, 8,
1801.
25. Nakamura, T.; Sakumoto, K.; Okamoto, M.; Seki, S.; Kobayashi, Y.; Takeuchi, T.; Tabuchi, M.; Yamada, Y.; J. Power Sources2007, 174, 435.
26. Liu, H.; Cao, Q.; Fu, L. J.; Li, C.; Wu, Y. P.; Wu, H. Q.;
Electrochem. Commun.2006, 8, 1553.
27. Mi, C. H.; Zhang, X. G.; Zhao, X. B.; Li, H. L.; Mater. Sci. Eng., B 2006, 129, 8.
28. Tong, D. G.; Luo, F. L.; Chu, W.; Li, Y. L.; Wu, P.; Mater. Chem. Phys. 2010, 124, 1.
29. Yang, M. R.; Ke, W. H.; J. Electrochem. Soc. 2008, 155, 729. 30. Bard, A. J.; Faulkner, L. R.; Electrochemical Methods, 2nd ed.;
Wiley: New York, 2001.
Submitted: September 1, 2011