vol. 38, n. 2, abr./jun., 2002
Compartmental analysis of ranitidine doubled peak plasma profile after
oral administration to healthy volunteers
Virna Josiane Aurelio Schuck
1, Teresa Dalla Costa
1, Sérgio G.S. de Barros
2, Carlos Gruber
2,
Elfrides Eva Schermann Schapoval
1*
1Faculdade de Farmácia, Universidade Federal do Rio Grande do Sul, 2Hospital de Clínicas de Porto Alegre,
Faculdade de Medicina, Universidade Federal do Rio Grande do Sul
The aim of this study was to describe the double peak plasma pharmacokinetic profile of ranitidine after oral administration to healthy volunteers using non-compartmental and compartmental analysis. A single 300 mg dose of ranitidine was given to ten healthy volunteers (5 male and 5 female). Blood samples were drawn at different times and analyzed by HPLC. Plasma profiles were evaluated by non-compartmental and compartmental approaches. The non-compartmental parameters determined were k (0.0054 ± 0.0010 min-1), t
1/2 (2.2 ± 0.4 h), Vdss/F (265.3 ± 70.6 L), Cl/F (84.8
± 24.3 L/h) and AUC (225916 ± 54099 ng*min/mL). The compartmental analysis was carried out using a two compartments body model, with first order absorption from two different sites. The parameters determined were k21 (0.0149 ± 0.0133 min-1), k
a1
(0.0117 ± 0.0073 min-1), k
a2 (0.1496 ± 0.1699 min
-1), Vc (128 ±
75.2 L), a (0.0299 ± 0.0319 min-1), b (0.0074 ± 0.0014 min-1) and
time for the beginning of the absorption from the second site (126.7 ± 58.1 min). The model used in the compartmental analysis was adequate to describe the double peak of ranitidine plasma profile and to determine the pharmacokinetic parameters.
*Correspondence:
E. E. S. Schapoval
Universidade Federal do Rio Grande do Sul
Faculdade de Farmácia Av. Ipiranga, 2752 - Bairro Santana 90610-000 - Porto Alegre - RS E-mail: [email protected]
Uniterms:
• Ranitidine • Pharmacokinetics • Compartmental analysis • Double peak plasma profile
INTRODUCTION
Ranitidine is histamine H2 receptor antagonist used in the treatment of gastric disease related to acid gastric hypersecretion (Grant et al., 1989).
Ranitidine pharmacokinetics has been evaluated in many studies after intravenous and oral administration (Van Hecken et al., 1982; Richards, 1983; Roberts, 1984; Grant
et al., 1989; Shim, Hong, 1989; Santos et al., 1996). The plasma concentration-time profile of ranitidine after intravenous administration shows a biexponential behavior that is characteristic of a two compartment open model.
compartmental analysis requires the use of a modified absorption equation that properly describes the double peak observed. A compartmental analysis after oral administration of this drug is not reported in the literature. Pharmacokinetic compartmental analysis is important to allow forecasting drug concentrations in the peripheral compartment for pharmacokinetic-pharmacodynamic modeling (PK-PD modeling) when the biophase is in a different compartment than the blood (Stanski, 1991; Shargel, Yu, 1999).
Considering the status of ranitidine pharmacokinetics evaluation, the aim of this study was to describe ranitidine pharmacokinetics after oral administration to healthy volunteers using non-compartmental and compartmental analysis. The compartmental analysis was conducted aiming to find an appropriate pharmacokinetic model to describe the individual double peak plasma profiles observed for the drug.
METHODS
Subjects
Ten healthy volunteers (5 male and 5 female) with an average age of 24.5 ± 2.7 years and an average body weight of 65.0 ± 11.0 kg were included in the study. They were selected based on their medical history, as well as physical and clinical examination. Informed written consent was obtained from all volunteers. The protocol was reviewed and approved by the Ethics Committee of the University Hospital (Hospital de Clínicas de Porto Alegre, Universida-de FeUniversida-deral do Rio GranUniversida-de do Sul, Brazil).
Study design
The subjects were instructed to avoid drug and alcohol intake for a week before the study. In the day of the experiment each volunteer received a single tablet of 300 mg of ranitidine (Glaxo Wellcome, Brazil) with 200 mL of water at 9 am, after 8 hour fasting. Standard meals were given after 4 hour of drug administration. Blood samples were collected into heparinized tubes before and at 15, 30, 45, 60, 75, 90, 105, 120, 150, 180, 210, 240, 360, 480 and 600 minutes after drug administration. Samples were harvest into heparinized tubes, plasma was separated by centrifugation and frozen to –20 ºC until analyzed.
Analytics
Ranitidine plasma concentration was determined by a validated HPLC method (Koch et al., 1997). Briefly, plasma (1 mL) was desproteinated with 4% perchloric acid and centrifuged at 3000 rpm for 5 min. The supernatant (500 µL) was neutralized with 500 µL of 1 M sodium carbonate. This mixture (100 µL) was injected into the system which consisted of a guard column Perisorb 30-40 µm 4 x 10 mm, an analytical column Beta Basic RP8 5 µm 250 x 4.6 mm, a pump Shimadzu LC-10AD, an ultraviolet detector Shimadzu SPD-10A and an integrator Shimadzu C-R6A. The flow rate
was set to 1 mL/min and the mobile phase consisted of 0.05 M phosphate buffer (pH 4.0): acetonitrile (94:8 v/v).
The assay was validated according to the International Conference of Harmonization (ICH) (Swartz, Krull, 1998). The method showed to be linear over the range of 25 to 1400 ng/mL with correlation coefficients better than 0.9991. The LOQ was 25 ng/mL. The intra-day precision was higher than 94% while the inter-day precision was higher than 88%. The accuracy was bigger than 95%. Since the acceptance cri-teria for precision and accuracy is variation inferior to 15% for both parameters (Shah et al., 1992), the method was con-sidered adequate for the measurement of ranitidine in plasma.
Pharmacokinetic analysis
Individual plasma concentration-time profiles were analyzed according to non-compartmental and compartmental analysis. The independent model parameters determined were the elimination rate constant (k), the half-life (t1/2), the relative total clearance (Cl/F), the relative volume of distribution at steady state (Vdss/F), the area under the concentration time curve (AUC), area under the first moment curve (AUMC), and the mean residence time (MRT) (Gibaldi, Perrier, 1982). The plasma concentration peak (Cpmax) and the time to reach this peak (Tmax) were obtained directly from the plots.
The compartmental analysis was carried out according to a two-compartments open model with two first order absorption rate constants from two different sites in the gastrointestinal tract. The schematic representation of the model is showed in Figure 1.
The equation that describes the drug concentration in the central compartment of this model is shown below (Wagner, 1993):
FIGURE 1 - Scheme of the two compartments open model with two parallel sites of absorption used in the compartmental analysis. Xc and Xp = amount of drug in the central and peripheral compartments, respectively; D = dose; F = drug bioavailability, f = fraction of the drug absorbed at each absorption site; ka1 = absorption rate constant at the first absorption site, ka2 = absorption rate constant at the second absorption site, tx = time for the second fraction of the drug to begin to be absorbed; k12 = distribution rate constant from the central to the peripheral compartment; k21 = redistribution rate constant from the peripheral to the central compartment; k10 = elimination rate constant from the central compartment. Adapted from Wagner, 1993.
where Cp is the drug plasma concentration, D is the dose administrated, F is the drug bioavailability, f is the fraction of the drug absorbed at each site, ka1 is the first absorption rate constant, ka2 is the second absorption rate constant, tx
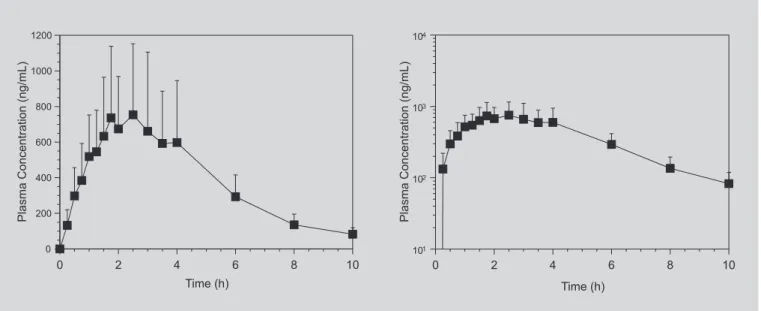
FIGURE 2 - Mean ranitidine plasma concentration versus time (left panel) and log mean plasma concentration versus
time (right panel) profiles obtained after the administration of a single 300 mg oral dose of ranitidine to 10 healthy volunteers. Error bars indicate SD.
is the time for the second fraction of the drug to begin to be absorbed, k21 is the redistribution rate constant from the peripheral to the central compartment, a and b are the hybrid constants for distribution and elimination phases, respectively, Vc is the volume of distribution of the cen-tral compartment, and t is the time.
The individual plasma profiles from the volunteers were fitted to this model using the computer program SCIENTIST® v. 2.0 (MicroMath, Salt Lake City). The
data points were no weighted for the analysis. The goodness of fit was evaluated using the model selection criteria (MSC) provided by the program. MSC is a modified Aikake information criterion that allows comparisons of variations data sets fitted to a selected model. Increased MSC values indicate more appropriate fits (SCIENTIST, 1995).
RESULTS
TABLE I - Peak and time to peak values obtained from the plasma concentration-time curve of each volunteer after administration of an oral dose of 300 mg of ranitidine
Subject Cpmax1 (ng/mL) Tmax1 (min) Cpmax2 (ng/mL) Tmax2 (min)
1 1111.5 90 567.7 236
2 439.1 45 1143.2 105
3 657.0 60 — —
4 898.8 60 435.8 150
5 458.8 105 1433.5 240
6 1220.0 105 — —
7 494.6 90 782.3 150
8 508.2 60 1221.6 150
9 445.6 30 953.3 105
10 1419.9 105 642.1 240
Average ± SD 765.4 ± 369.2 75 ± 27 898.6 ± 348.6 172 ± 58
FIGURE 3 - Ranitidine plasma concentration versus time profiles obtained after the administration of a single 300 mg oral dose of ranitidine to subject 5 () and subject 8 (6).
Santos et al., 1996). Since in our study the bioavailability of ranitidine was not determined, the clearance and the volume of distribution calculated are relative. Assuming a bioavailability of 50%, reported for ranitidine after oral administration (Roberts, 1984), the mean Cl obtained would be 706.5 ± 202.7 mL/min which is in good agreement with range of 600 to 700 mL/min reported in the literature (Van Hechen et al., 1982; Roberts, 1984). The same is valid for the volume of distribution (Vdss) obtained which would be 132.7 ± 35.3 L, in a similar range of values reported by other authors (1.2 to 1.9 L/kg) (Van Hecken et al., 1982; Richards, 1983).
The double peak observed in the plasma profiles of the volunteers after ranitidine oral administration is well described in the literature, although some author did not observed it in their studies (Lebert et al., 1981; Hilgenstock et al., 1987). The diverse plasma peak patterns observed by different authors have been related to the blood sampling intervals, to the inter-subject variation among the subjects employed in the studies and to the analytic methods used to measure ranitidine in plasma. Some authors related the second peak occurrence to the food intake (Shim, Hong, 1989). However, in our study, the food intake was allowed only four hours (240 min) after drug dosing and the second peak occurred between 105 and 240 min.
Both Cpmax and both Tmax observed in this study showed a big variability among the volunteers which can be explained using the discontinuous absorption model suggested by Suttle and co-workers (1992). In this model, the gastrointestinal tract is divided into compartments connected according to a catenary system and the drug absorption occurs only in the first and in the last compartment. According to simulations done by these presented in Table I. The individual and average
pharmacokinetic parameters determined by non-compartmental analysis are summarized in Table II.
The plasma concentration-time curve of each volunteer was fitted to the two-compartments open model described by Equation 1. The mean fit is shown in Figure 4. The individual and average pharmacokinetic parameters obtained from the fittings are depicted in Table III.
DISCUSSION
TABLE II - Independent model parameters calculated from the plasma concentration-time curve of each volunteer after administration of an oral dose of 300 mg of ranitidine
Subject K t1/2 AUC 0-∞ Cl/F* Vdss/F* AUMC0→∞ MRT
(min-1) (h) (ng.h/mL) (L/h) (L) (ng.h2/mL) (h)
1 0.0057 2.0 4673 64.2 188.0 203233 4.4
2 0.0040 2.9 4547 66.0 278.1 217595 4.8
3 0.0060 1.9 2668 112.5 314.1 104816 3.9
4 0.0065 1.8 2187 137.2 350.6 65318 2.9
5 0.0058 2.0 4473 67.1 193.5 231981 5.2
6 0.0047 2.5 3306 90.8 322.6 151232 4.6
7 0.0056 2.1 3698 81.1 240.9 170667 4.6
8 0.0042 2.7 4017 74.7 294.4 171170 4.3
9 0.0047 2.5 3250 92.3 328.8 118414 3.6
10 0.0073 1.6 4834 62.1 142.1 185364 3.8
Mean ± SD 0.0054 ± 0.0010 2.2 ± 0.4 3765 ± 855 84.8 ± 24.3 265.3 ± 70.6 161979 ± 52732 4.2 ± 0.6
* F = absolute bioavailability
authors using the discontinuous absorption model, the intensity and variability of Cpmax and Tmax observed could be attributed to the following factors: the dose administered, the drug transfer rate from the stomach to the first site of absorption, the number of gut compartments, the distance between the two absorption sites, the drug transfer rate among the compartments, and the absorption rate in each site of absorption.
The compartmental analysis was carried out using
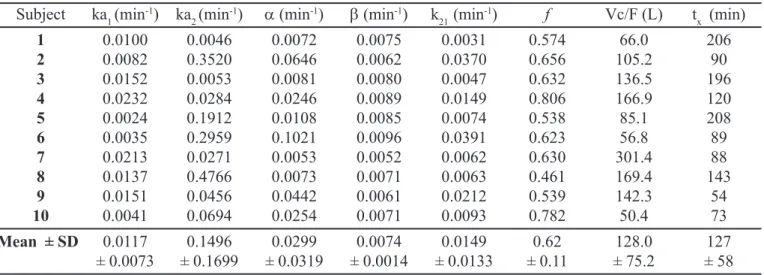
TABLE III - Pharmacokinetic parameters obtained from the analysis of the individual plasma concentration profiles using the two compartments model equation with two sites of absorption (Eq.1)*
Subject ka1 (min-1) ka 2 (min
-1) α (min-1) β (min-1) k 21 (min
-1) f Vc/F (L) t
x (min)
1 0.0100 0.0046 0.0072 0.0075 0.0031 0.574 66.0 206
2 0.0082 0.3520 0.0646 0.0062 0.0370 0.656 105.2 90
3 0.0152 0.0053 0.0081 0.0080 0.0047 0.632 136.5 196
4 0.0232 0.0284 0.0246 0.0089 0.0149 0.806 166.9 120
5 0.0024 0.1912 0.0108 0.0085 0.0074 0.538 85.1 208
6 0.0035 0.2959 0.1021 0.0096 0.0391 0.623 56.8 89
7 0.0213 0.0271 0.0053 0.0052 0.0062 0.630 301.4 88
8 0.0137 0.4766 0.0073 0.0071 0.0063 0.461 169.4 143
9 0.0151 0.0456 0.0442 0.0061 0.0212 0.539 142.3 54
10 0.0041 0.0694 0.0254 0.0071 0.0093 0.782 50.4 73
Mean ± SD 0.0117 0.1496 0.0299 0.0074 0.0149 0.62 128.0 127
± 0.0073 ± 0.1699 ± 0.0319 ± 0.0014 ± 0.0133 ± 0.11 ± 75.2 ± 58
* See text for legend
the relative magnitude of the micro-constants of the model (k21, ka, k10). If the drug distribution occurs faster than the absorption, the distribution phase will not be observed in the plasma concentration profile because the system will not provide enough time for the drug to distribute after absorption (Liang, Derendorf, 1998; Shargel, Yu, 1999).
The choice of the adequate compartmental model to analyze ranitidine profiles in this study was based on the best fit to the double peak obtained for the model tested. Although the concentration profiles show a log-linear declining, the one compartment open model with two sites of absorption did not fit well the double peak observed even though the resulting MSC was 1.32 ± 0.57. The best fit was obtained using the equation that describes the two compartments open model with two sites of absorption, as shown in Figure 4. The mean MSC value obtained was 1.94 ± 0.67 which was considered adequate for this analysis.
As stated before, according to the discontinuous absorption theory, in the two compartments model with two sites of absorption, the gastrointestinal tract is divided into different compartments but the absorption will occur only in the first and in the last sites (Suttle et al., 1992) (Figure 1). After the administration, the drug reaches the first site of absorption and a fraction of the dose (f) is absorbed. After absorption, this fraction of the drug reaches the central compartment (Xc) and distributes to the peripheral compartment (Xp) with a distribution rate constant k12. The drug redistributes to the central compartment with a rate constant k21, from where it will be eliminated. After the first absorption, the fraction not
absorbed in the first site passes through the gut and reaches the second site of absorption. In this site, the fraction of the drug remained in the bowel (1-f) will be absorbed and will be distributed in the body as the first fraction.
Some evidences in the literature also corroborate the choice for the discontinuous absorption model to describe the data obtained in this study. According to Suttle and Brouwer (1994) the gastric emptying or enterohepatic re-circulation cannot contribute to the occurrence of a second peak in the ranitidine plasma profile because the amount of drug secreted in the bile in humans is to small, less than 3%, to promote a significant peak. Furthermore, the concentration time profiles observed when the drug is administrated directly in the stomach did not show two peaks, indicating that the gastric emptying alone is not enough to promote a secondary peak (Williams et al., 1992).
Although there are no reports in the literature on the compartmental analysis of ranitidine after oral administration which could be used to compare the pharmacokinetic parameters determined in this study, a comparison between the compartmental and non-compartmental results can be carried out. As expected, the volume of distribution of the central compartment (Vc/F) determined by the compartmental approach is smaller than the Vdss/F calculated. The elimination rate constant (k) determined in the non-compartmental analysis (0.0054 ± 0.0010 min-1) is similar to b-rate constant (0.0074 ± 0.0014
min-1), showing that the compartmental approach
from the body. Finally, the time to begin the drug absorption from the second absorption site (127 ± 58 min), according to the model theory, is smaller than the time observed for the drug to reach the second plasma peak (172 ± 58 min). These observations corroborate the adequacy of the compartmental model used to describe the data obtained.
CONCLUSIONS
The parameters calculated in the non-compartment analysis were similar to those reported in the literature indicating that the data obtained from the volunteers in this study are consistent with the previous reports. Eighth out of ten plasma concentration profiles of ranitidine after oral administration showed a double peak. This phenomenon was described appropriately using the two compartmental open model with two sites of absorption which considers that the absorption occurs in two different places in the gut as described by the discontinuous absorption theory. In conclusion, the double peak observed in the ranitidine plasma concentration could be explained mainly by the discontinuous absorption theory.
ACKNOWLEDGEMENTS
We thank the Fundação de Amparo à Pesquisa do Rio Grande do Sul (FAPERGS, Brazil) and the Conselho Nacional de Desenvolvimento Científico e Tecnológico (CNPq, Brazil) for the financial support. Virna Josiane Aurelio Schuck thanks the CNPq for the scholarship.
RESUMO
Análise compartimental do perfil de duplo pico plasmático da ranitidina após administração oral a
voluntários sadios
O objetivo deste trabalho foi o duplo pico observado no perfil farmacocinético plasmático da ranitidina após admi-nistração oral a voluntários sadios através de análise compartimental. Uma dose simples de 300 mg de ranitidina foi administrada a dez voluntários sadios (5 homens e 5 mulheres). Amostras de sangue foram coletadas em diferen-tes tempos e analisadas por HPLC. Os perfis plasmáticos foram avaliados pela abordagem compartimental e não-compartimental. Os parâmetros não compartimentais de-terminados foram k (0,0054 ± 0,001 min-1), t
1/2 (2,2 ± 0,4 h), Vd/F (265,3 ± 70,6 L), Cl/F (84,8 ± 24,3 L/h) e AUC
(225916 ± 54099 ng*min/mL). A análise compartimental foi conduzida utilizando-se o modelo de dois compartimen-tos corporais com constantes de absorção de primeira or-dem a partir de dois sítios de absorção diferentes. Os parâmetros determinados foram k21 (0,0149 ± 0,0133 min-1), ka1 (0,0117 ± 0,0073 min-1), k
a2 (0,1496 ± 0,1699 min -1), Vc
(128 ± 75,2 L), a (0,0299 ± 0,0319 min-1), b (0,0074 ± 0,0014 min-1) e o tempo para o início da absorção no segun-do sítio (126,7 ± 58,1 min). O modelo usasegun-do na análise compartimental foi adequado para descrever o duplo pico no perfil plasmático da ranitidina e para determinar os parâmetros farmacocinéticos.
UNITERMOS: Ranitidina. Farmacocinética. Análise compartimental. Duplo pico plasmático.
REFERENCES
DESMOND, P. V., HARMAN, P. .J., GANNOULIS, M., KAMM, M., MASHFORD, M. L. The effect of an antacid and food on the absorption of cimetidine and ranitidine. J. Pharm. Pharmacol.,v. 42, p. 352-354,1990.
GIBALDI, M., PERRIER, D. Pharmacokinetics. 2.ed. New York: Marcel Dekker, 1982. 494 p.
GRANT, S. M., LANGTRY, H. D., BRODGEN, R. N. Ranitidine: An update review of its pharmacokinetics and pharmacodynamics properties and therapeutics use in peptic ulcer disease and other allied disease. Drugs, v. 37, p. 801-870, 1989.
HILGENSTOCK, C., SCHMIEDEL, G., BÜHRENS, K. G. Study of the bioequivalence of two ranitidine formulations. Arzn. Forsch., v. 37, n. 8, p. 974-976, 1987.
KOCH, K. M., LIU, M., DAVIS, I. M., SHAW, S., YIN, Y. Pharmacokinetics and pharmacodynamics of ranitidine in renal impairment. Eur. J. Clin. Pharmacol., v. 52. p. 229-234, 1997.
LEBERT, P. A., MCLEOD, S. M., MAHON, W. A., SOLDIN, S. J., VANDENBERGHE, H. M. Ranitidine kinetics and dynamics: I. Oral dose study. Clin. Pharmacol. Ther., v. 30, n. 4, p. 539-544, 1981.
REYNOLDS, K. S., SONG, M. H., HEIZER, W. D., BURNS, C. B., SICA, D. A., BROUWER, K. L. R. Effect of pancreatic-biliary secretions and GI transit time on the absorption and pharmacokinetics profile of ranitidine in humans. Pharm. Res., v. 15, n. 8, p. 1281-1285, 1998.
RICHARDS, D. A. Comparative Pharmacodynamics and pharmacokinetics of cimetidine and ranitidine. J. Clin. Gastroenterol., v.5, suppl. 1, p. 81-90, 1983.
ROBERTS, C. J. C. Clinical pharmacokinetics of ranitidine.
Clin. Pharmacok., v. 9, p. 211-221, 1984.
SANTOS, F. A., CARCAS, A. J., GUERRA, P., GOVANTES, C., MONTUEGA, C., GOMEZ, E., FERNANDEZ, A., FRIAS, J. Evaluation of sex differences in the pharmacokinetics of ranitidine in humans. J. Clin. Pharmacol., v. 36, p. 748-751, 1996.
SCIENTIST User Handbook; Version 2.0. Salt Lake City: MicroMath Scientific Software, UT84121, 1995.
SHAH, V. P., MIDHA, K. K., DIGHE, S., MCGILVERAY, I. J., SKELLY, J. P., YACOBI, A., LAYLOFF, T., VISWANATHAN, C. T., COOK, C. E., MCDOWALL, R. D., PITTMANN, K. A., SPECTOR, S. Analytical methods validation: bioavailability, bioequivalence and pharmacokinetics studies. J. Pharm. Sci., v. 78, n. 12, p. 990-993, 1992.
SHARGEL, L., YU, A. B. C. Applied biopharmaceutics and pharmacokinetics. 4.ed. Connecticut: Appleton & Lange, 1999. 768 p.
SHIM, C. K., HONG, J. S. Inter and intra-subject variations of ranitidine pharmacokinetics after oral administration to normal male subjects. J. Pharm. Sci., v. 78, n. 12, p. 990-993, 1989.
STANSKI, D. R. Pharmacokinetics and pharmacodynamics for the clinicians. Can. J. Anest., v. 38, n. 4, p. R48-R53, 1991.
SUTTLE, A. B., POLLACK, G. M., BROUWER, K. L. R. Use of Pharmacokinetics Model incorporating discontinuous gastrointestinal absorption to examine the occurrence of double peaks in oral concentration time profile. Pharm. Res., v. 9, n. 3, p. 350-355, 1992.
SUTTLE, A. B., BROUWER, K. L. R. Bile flow but not enterohepatic recirculation influences the pharmacokinetics of ranitidine in the rat. Drug. Met. Dis., v. 22, n. 2, p. 224-232, 1994.
SWARTZ, M. E., KRULL, I. S. Validação de métodos cromatográficos. Pharm. Technol., v. 2, n. 3, p. 12-20, 1998.
VAN HECKEN, A. M., TJANDRAMAGA, T. B., MULLIE, A., VERBESSELT, R. D. E., SCHEPPER, P. J. Ranitidine: single dose pharmacokinetics and absolute bioavailability in man. Br. J. Clin. Pharmacol. Ther., v. 14, p. 195-200, 1982.
WAGNER, J. G. Pharmacokinetics for the pharmaceutical scientist. Lancaster: Technomic, 1993. 316 p.
WILLIAMS, M. F., DUKES, G. E., HEIZER, W., HAN, Y. H., HERMANN, D. J., LAMPKIN, T., KAK, L. J. Influence of gastrointestinal site of drug delivery on the absorption characteristics of ranitidine. Pharm. Res., v. 9, n. 9, p. 1190-1194, 1992.