Printed in Brazil - ©2006 Sociedade Brasileira de Química 0103 - 5053 $6.00+0.00
Article
*e-mail: [email protected]
Multiresidue Determination of Herbicides in Environmental Waters from Primavera do Leste
Region (Middle West of Brazil) by SPE-GC-NPD
Eliana F. G. C. Dores,*,a,c Sandro Navickiene,b Marcelo L. F. Cunha,a Leandro Carbo,a Maria Lúcia Ribeiroc and Ermelinda M. De-Lamonica-Freired
a
Departamento de Química, Universidade Federal de Mato Grosso, 78060-900 Cuiabá-MT, Brazil b
Departamento de Química, Universidade Federal de Sergipe, 49100-000 São Cristóvão-SE, Brazil
c
Instituto de Química, Universidade Estadual Paulista, 14801-970 Araraquara-SP, Brazil d
Centro Universitário de Várzea Grande (UNIVAG), 78118-000 Várzea Grande-MT, Brazil
Foi desenvolvido um estudo sobre a presença dos herbicidas simazina, metribuzim, metolacloro, trifluralina, atrazina e seus metabólitos desisopropilatrazina (DIA) e desetilatrazina (DEA) em água superficial e subterrânea da região de Primavera do Leste, Mato Grosso, Brasil. O procedimento analítico baseou-se na extração em fase sólida com cartuchos descartáveis Sep-Pak
C18 e eluição com acetato de etila. Os níveis de resíduos foram determinados por cromatografia a
gás com detector de nitrogênio e fósforo. Para a maior parte dos pesticidas, a recuperação média nos diferentes níveis de fortificação foi >70% com estimativa do desvio padrão relativo <19%. As recuperações observadas para o DIA e a trifluralina foram 25% e 56%, respectivamente. As baixas recuperações foram atribuídas à retenção incompleta do DIA e à forte retenção no sorvente e alta
volatilidade da trifluralina. Os limites de detecção variaram de 0,023 a 0,088 µg L-1. Este método
foi aplicado na análise de 5 amostras de águas superficiais e 28 de águas subterrâneas, em pontos usados para abastecimento de água para consumo humano, coletadas em Primavera do Leste,
Mato Grosso. O nível mais elevado encontrado nas amostras de água foi 1,732 µg L-1 de metolacloro
enquanto o herbicida encontrado com maior freqüência foi o metribuzim.
A study on the presence of herbicides, namely simazine, metribuzin, metolachlor, trifluralin, atrazine and two metabolites, deisopropylatrazine (DIA) and deethylatrazine (DEA), was performed in ground and surface waters from Primavera do Leste region, Mato Grosso state (Middle West of Brazil). The analytical procedure was based on solid-phase extraction (SPE)
with Sep-Pak C18 disposable cartridges and ethyl acetate for elution solvent. Residue levels
were determined by gas chromatography with nitrogen-phosphorus detection. For most of the pesticides average recoveries at different fortification levels were >70% with relative standard deviation <19%. The recoveries of DIA and trifluralin in water were 25% and 56%, respectively, which were attributed to the incomplete retention of DIA and strong retention on the sorbing
material and high volatility of trifluralin. Detection limits ranged from 0.023 to 0.088 µg L-1.
This method was applied for the analysis of 5 superficial water samples and 28 groundwater samples, in places used for human consumption without previous treatment, collected in Primavera do Leste, Mato Grosso, Brazil. Results indicated that the highest level of contamination
in a water sample was 1.732 µg L-1 for metolachlor, while metribuzin was the most frequently
detected herbicide with maximum concentration of 0.351 µg L-1.
Keywords: solid-phase extraction, water, herbicides, pesticides, GC-NPD
Introduction
The Primavera do Leste region (Mato Grosso state, Middle West of Brazil) is an area with a high agricultural
after their application, pesticide residues may remain in the crops, soil and natural water and constitute a health risk because of their toxicity. A literature review revealed data on pesticide contamination of aquatic environment in the tropical and subtropical areas.1-6 In Brazil, although research
on pesticide leaching from agricultural areas to groundwater was initiated years ago, the knowledge of the levels of contamination of groundwater is still very scarce in the regions of the Middle West and North of Brazil. Unfortunately, there are few methods for determining pesticide residues in Brazilian environmental compartments. Among them, atrazine, simazine and amethrin were studied in a waterworks of São Paulo state.7 Trifluralin, endosulfan, λ-cyhalothrin, dicofol, captan, methyl parathion, chloro-thalonil, and chlorpyrifos were determined in groundwater and surface water in Guaíra region, São Paulo state.8 In
another study, 29 pesticides and 3 metabolites were determined in surface water of northeastern area of Pantanal region and glifosate and its main metabolite were studied in water from a rice-growing area.9-10
The present work reports the optimization of an SPE method for simultaneous determination of simazine, metribuzin, metolachlor, trifluralin, atrazine and two of its metabolites, deisopropylatrazine (DIA) and deethylatrazine (DEA), in water by means of gas chromatography using nitrogen-phosphorus detection. The pesticides selected are the most frequently used in this agricultural area. The method was successfully applied to determine the levels of these herbicides in water samples taken from different water sources located in Primavera do Leste region.
Experimental
Reagents
Ethyl acetate, acetone and methanol (Mallinckrodt Baker Inc., Paris, KY, USA) of nanograde purity were used. The pesticide standards of deisopropylatrazine (96.5%), deethylatrazine (95.5%), trifluralin (99.2%), atrazine (98.4%), simazine (99.2%), metribuzin (99.5%) and metolachlor (95.0%) were purchased from Dr. Ehrenstorfer (Augsburg, Germany). The individual stock solutions of the analytes were prepared by diluting 1.0 mg of the standard in 10.0 mL of ethyl acetate to obtain a concentration of 100 µg mL-1. The working
standard solutions were prepared by diluting the stock solutions as required. The deionized water was purified with a Milli-Q water purification system (Millipore, Bedford, MA, USA). Hydrochloric acid of analytical grade was from Merck (Darmstadt, Germany). Sodium chloride of residue analysis grade was purchased from
Merck (Darmstadt, Germany). Sep-Pak C18-bonded silica commercial cartridges (500 and 1000 mg) were purchased from Waters (Mildford, MA, USA).
Apparatus
A Hewlett-Packard 6890 gas chromatograph equipped with a split/splitless injector and a nitrogen-phosphorus detection system was employed. A DB-5 fused-silica capillary column (30 m × 0.32 mm i.d., 0.25 µm; J & W Scientific, Folsom, CA, USA) was used, with nitrogen (purity 99.999%) as carrier and make up gas at flow-rates of 1 mL min-1 and 7
mL min-1, respectively. Detector gases: hydrogen 3 mL
min-1 and air 60 mL min-1. The injector temperature was set
at 240 °C and the detector temperature was 300 °C. The oven temperature was programmed as follows: 70 °C for 1 min, increased to 150 °C at 20 °C min-1, then to 180 °C at
3 °C min-1 and followed by final ramp to 240 °C at 10 °C
min-1 (hold for 1 min). The data were acquired and processed
by HP Chemstation software. An aliquot (1 µL) of the water extracts, standards and blanks was injected in the splitless mode into the GC-NPD system.
Sample collection and preparation
In the beginning of the rain season in this tropical area (December 1998), thirty-three water samples were collected from different water sources in agricultural zone located in Primavera do Leste region (Middle West of Brazil between 15 32’S to 15 34’S and 54 17’W to 54 19’W) in 1 L amber glass bottles pretreated with acetone and methanol. After being filled with water, the bottles were sealed with Teflon-lined screw caps and transported on the same day to the laboratory in refrigerated conditions. In the laboratory, before the solid-phase extraction, the water samples were filtered in a 0.45 µm cellulose nitrate membrane filter, the pH was adjusted between 6.5 and 7.5 with 1 mol L-1 HCl and the NaCl
was added to ionic strength correction (17.5%, m/v). The sampling sites were irrigation and drinking water wells (23), waterholes (5), dam (2) and Cabeceira dos Bois river (3). Numbers between parenthesis represent number of sampling points at each sampling sites.
Extraction procedure
A Sep-Pak Vac C18 cartridge was placed on top of a vacuum block and it was conditioned with 10 mL of methanol followed by 10 mL of water, before applying the sample. An analytical aliquot of 500 mL water was transferred to the cartridge at a flow-rate of ca.
of ethyl acetate at a flow-rate of ca. 1 mL min-1. The
combined fractions were concentrated in a rotary evaporator and the residue was redissolved in 1 mL of ethyl acetate for GC-NPD analysis.
Recovery studies
Recovery studies were carried out with tap water samples free of residual pesticides, which were spiked with standard mixture at different concentration levels. At each fortification level, six replicates were analyzed. Quantification was performed by external calibration using certified standards. Sample analyses were run in duplicate and most relative standard deviations (RSDs) of less than 19% were achieved. The extraction procedure described above was followed. The limits of detection and quantification were determined based on the criteria established by Thier and Zeumer.11 The limit
of detection (LOD) was calculated using equation 1.
(1)
Where scomb is the combined standard deviation; S is the sensitivity; t(f; 95) is the unilateral t of Student, with f degrees of freedom and confidence level of 95%; f=d-1 and d is the number of replicates at each fortification level.
The sensitivity was determined as a measure of the proportionality of the instrumental response and the analyte concentration.
The combined standard deviation (scomb) was calculated using equation (2).
(2)
where sA is the standard deviation of the measured concentrations at the lowest fortification level used in the recovery experiment; m is the number of replicates at the lowest fortification level; sB is the standard deviation of the responses of the blank determinations and n is the number of blank determinations.
The limit of quantification (LOQ) was the lowest fortification level where mean recovery between 70 and 120% and relative standard deviation less than 20% were obtained.
Results and Discussion
GC-NPD conditions
In a first approach, the GC-NPD conditions were optimized to separate the herbicides studied. For that,
different temperature programs were tested in order to resolve the pesticides of the standard mixture. The representative chromatograms of the standard mixture, fortified water sample and water control sample are shown in Figure 1. No interfering peaks were present. The total running time was 20 min.
Optimization of solid-phase extraction
The proposed SPE method was based on previous procedures established by Junker-Buchheit and Witzenbacher12 and Eisert et al.13 for the determination of
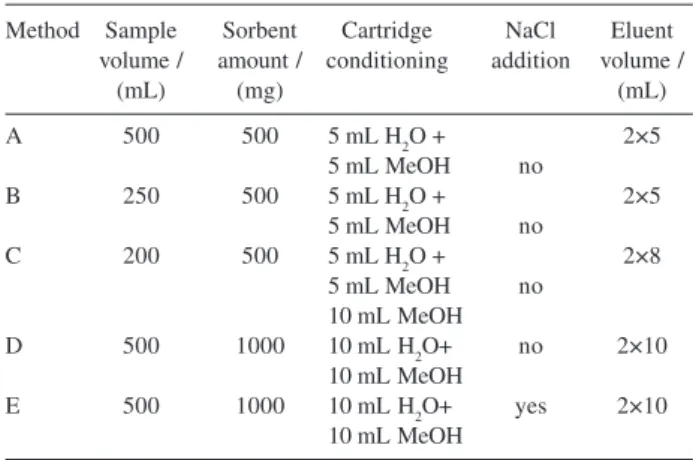
pesticide residues in water. Different parameters related to the extraction process were evaluated. Table 1 shows the experiments realized to the optimization of the SPE procedure in order to improve the recovery. These experiments were performed in triplicate. The extraction carried out by the method A showed lower recovery for DIA and trifluralin with high relative standard deviation (RSD) values for both pesticides (Table 2). The low recovery for trifluralin was due to the effect of irreversible adsorption taking place on the C18 surface and high volatility, while some uncontrollable loss of DIA occurred during the SPE procedure, once it is not well retained by the sorbent. In method B, considering the same amount of C18 material, the influence of the sample volume was assayed. The average recoveries for DIA and trifluralin were improved from 19% to 60% and 20% to 59%, respectively. No significant differences in DIA recoveries were noted from water samples analyzed by methods B, C and D. The eluent volume used for subsequent study was set at 20 mL. In method E, the effect of addition of salt was also evaluated with water sample salted with NaCl. Salt increases the ionic strength of the water sample and enhances the extraction from water because it reduces analyte solubility. Greater areas for DIA were registered when 87.5 g of NaCl were added. Further experiments were performed by the addition of NaCl (17.5%, m/v).
Table 1. Analytical parameters assayed for the optimization of the SPE
method
Method Sample Sorbent Cartridge NaCl Eluent volume / amount / conditioning addition volume /
(mL) (mg) (mL)
A 500 500 5 mL H2O + 2×5
5 mL MeOH no
B 250 500 5 mL H2O + 2×5
5 mL MeOH no
C 200 500 5 mL H2O + 2×8
5 mL MeOH no
10 mL MeOH
D 500 1000 10 mL H2O+ no 2×10
10 mL MeOH
E 500 1000 10 mL H2O+ yes 2×10
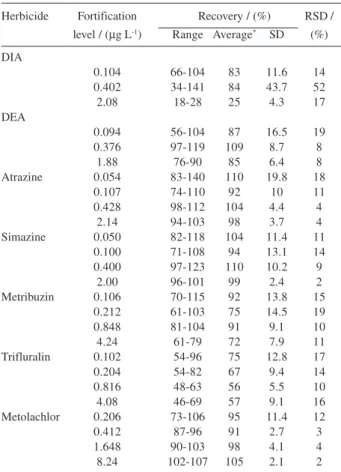
Based on these results, the method E was selected to determine the herbicides studied in spiking samples of tap water at different levels for each pesticide. Each recovery analysis was repeated 6 times. The results of the average recoveries ranged from 72% to 110%, with
RSD values of 2% to 19%, as can be seen in Table 3, except for DIA and trifluralin, which gave lower recoveries 25% and 56%, respectively. Lower recoveries of DIA and trifluralin have been reported in the literature.9,14-16
Table 2. Effect on the herbicide recovery of different methods
Herbicide A B C D E
Reca RSD / (%) Rec RSD / (%) Rec RSD / (%) Rec RSD / (%) Rec RSD / (%)
DIA 19 79 60 30 57 27 54 14 83 14
DEA 82 5.7 108 6.6 106 7 104 10 87 19
Atrazine 97 5.9 101 7.9 91 3.5 100 5.3 94 14
Simazine 93 9.9 91 4.7 86 5.4 93 6.2 92 11
Metribuzin 87 8.3 82 6.6 96 16 94 19 75 10
Trifluralin 20 63 59 4.8 45 19 82 11 67 14
Metolachlor 98 5.9 102 1.7 92 9.2 109 5.5 91 3.0
aRec = Recovery (n=3); RSD = Relative Standard Deviation
Figure 1. GC-NPD chromatograms of (A) standard mixture containing atrazine (0.314 µg mL-1), DIA (0.208 µg mL-1), DEA (0.188 µg mL-1),
Table 3. Recovery efficiency of herbicides from fortified water by GC-NPD analysis (*n=6)
Herbicide Fortification Recovery / (%) RSD / level / (µg L-1) Range Average* SD (%)
DIA
0.104 66-104 83 11.6 14
0.402 34-141 84 43.7 52
2.08 18-28 25 4.3 17
DEA
0.094 56-104 87 16.5 19
0.376 97-119 109 8.7 8
1.88 76-90 85 6.4 8
Atrazine 0.054 83-140 110 19.8 18
0.107 74-110 92 10 11
0.428 98-112 104 4.4 4
2.14 94-103 98 3.7 4
Simazine 0.050 82-118 104 11.4 11
0.100 71-108 94 13.1 14
0.400 97-123 110 10.2 9
2.00 96-101 99 2.4 2
Metribuzin 0.106 70-115 92 13.8 15
0.212 61-103 75 14.5 19
0.848 81-104 91 9.1 10
4.24 61-79 72 7.9 11
Trifluralin 0.102 54-96 75 12.8 17
0.204 54-82 67 9.4 14
0.816 48-63 56 5.5 10
4.08 46-69 57 9.1 16
Metolachlor 0.206 73-106 95 11.4 12
0.412 87-96 91 2.7 3
1.648 90-103 98 4.1 4
8.24 102-107 105 2.1 2
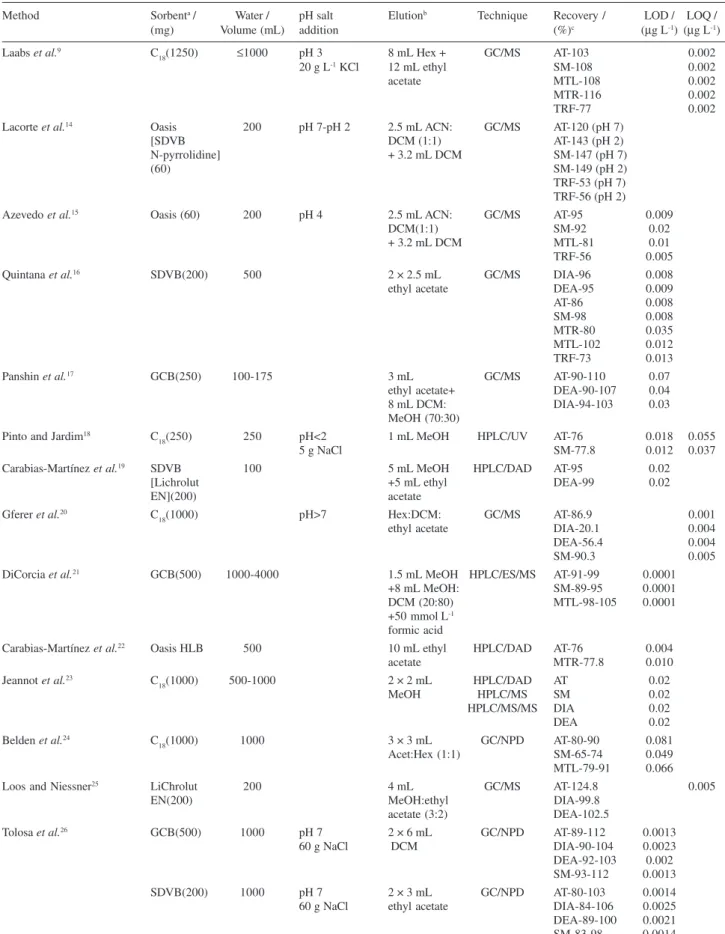
Many authors have described methods for the determination of these herbicides in water using gas chromatography with nitrogen phosphorus detection or mass spectrometric detector or ultraviolet or mass selective detector through different interfaces for HPLC technique, Table 4. In terms of recovery the effectiveness of the C18 cartridge extraction procedure was compared with those obtained using SDVB resins and GCB sorbent. Therefore, the overall results are in good agreement with the one previously published by Laabs et al.9 who reported
recoveries of these pesticides of 77-116% using SPE involving much larger sample volume (1000 mL) than in the present work.
Linearity
Under the chromatographic conditions described, good linearity and correlation coefficient were achieved for the compounds studied. Replicates (n=3) of the standard pesticide mixture of different concentrations were analyzed and the detector response (peak area) was plotted against analyte concentrations. The correlations were found to be linear in the range from 0.009 to 2.060 µg mL-1.
The correlation coefficients obtained for the pesticides were higher than 0.997 as shown in Table 5.
Limits of detection (LOD) and quantification (LOQ)
The criteria established by Thier and Zeumer to find LOD and LOQ was used in this study.11 The LOD for
herbicides studied ranged from 0.023 to 0.088 µg L-1,
which was calculated considering the sensitivity of the method and the standard deviation values obtained from recovery experiments at the lowest fortification level and the blank analysis. The LOQ were determined as the lowest concentration of the compounds that gave a response that could be quantified with a RSD of less than 20% and a recovery of at least 70%. Consequently, the LOQ values for these compounds were between 0.050 and 0.206 µg L-1 as shown in Table 5. The
detection limits obtained were in good agreement with those previously published by Panshin et al.17 and Pinto
and Jardim,18 but higher than the one obtained by Laabs et al.9 and Quintana et al.16 However, the last method
used other sorbent material and GC-MS technique, Table 4. On the other hand, the LOD values were lower than or equal to the maximum admissible concentration established by the European Union for the sum of all pesticides (0.5 µg L-1) or for an individual compound
in drinking water (0.1 µg L-1).
Application of the method
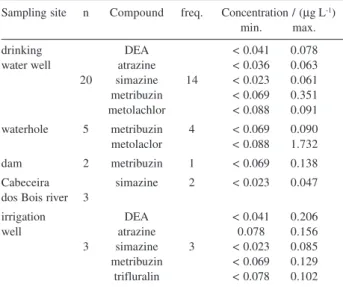
The proposed method was applied to the deter-mination of herbicides in water samples of different water sources located in Primavera do Leste region, Middle West of Brazil. These analyses are part of a project that aimed to study the contamination by herbicides of water used for human consumption. The results showed that out of 33 water samples, 73% had detectable herbicide residues. Figure 2 shows the chromatogram of a drinking water sample where DEA, metribuzin and metolachlor were detected. Metribuzin (16 cases) was the most frequently found pesticide in water samples, followed by simazine and DEA (6 cases each), metolachlor and atrazine (4 cases each) and trifluralin (2 cases). DEA was detected at high concentrations (0.206 µg L-1), but DIA was not found
Table 4. Comparison among different SPE methods for the determination of herbicides in water
Method Sorbenta / Water / pH salt Elutionb Technique Recovery / LOD / LOQ /
(mg) Volume (mL) addition (%)c (µg L-1) (µg L-1)
Laabs et al.9 C
18(1250) ≤1000 pH 3 8 mL Hex + GC/MS AT-103 0.002
20 g L-1 KCl 12 mL ethyl SM-108 0.002
acetate MTL-108 0.002
MTR-116 0.002
TRF-77 0.002
Lacorte et al.14 Oasis 200 pH 7-pH 2 2.5 mL ACN: GC/MS AT-120 (pH 7)
[SDVB DCM (1:1) AT-143 (pH 2)
N-pyrrolidine] + 3.2 mL DCM SM-147 (pH 7)
(60) SM-149 (pH 2)
TRF-53 (pH 7) TRF-56 (pH 2)
Azevedo et al.15 Oasis (60) 200 pH 4 2.5 mL ACN: GC/MS AT-95 0.009
DCM(1:1) SM-92 0.02
+ 3.2 mL DCM MTL-81 0.01
TRF-56 0.005
Quintana et al.16 SDVB(200) 500 2 × 2.5 mL GC/MS DIA-96 0.008
ethyl acetate DEA-95 0.009
AT-86 0.008
SM-98 0.008
MTR-80 0.035
MTL-102 0.012
TRF-73 0.013
Panshin et al.17 GCB(250) 100-175 3 mL GC/MS AT-90-110 0.07
ethyl acetate+ DEA-90-107 0.04
8 mL DCM: DIA-94-103 0.03
MeOH (70:30) Pinto and Jardim18 C
18(250) 250 pH<2 1 mL MeOH HPLC/UV AT-76 0.018 0.055
5 g NaCl SM-77.8 0.012 0.037
Carabias-Martínez et al.19 SDVB 100 5 mL MeOH HPLC/DAD AT-95 0.02
[Lichrolut +5 mL ethyl DEA-99 0.02
EN](200) acetate
Gferer et al.20 C
18(1000) pH>7 Hex:DCM: GC/MS AT-86.9 0.001
ethyl acetate DIA-20.1 0.004
DEA-56.4 0.004
SM-90.3 0.005
DiCorcia et al.21 GCB(500) 1000-4000 1.5 mL MeOH HPLC/ES/MS AT-91-99 0.0001
+8 mL MeOH: SM-89-95 0.0001
DCM (20:80) MTL-98-105 0.0001
+50 mmol L-1 formic acid
Carabias-Martínez et al.22 Oasis HLB 500 10 mL ethyl HPLC/DAD AT-76 0.004
acetate MTR-77.8 0.010
Jeannot et al.23 C
18(1000) 500-1000 2 × 2 mL HPLC/DAD AT 0.02
MeOH HPLC/MS SM 0.02
HPLC/MS/MS DIA 0.02
DEA 0.02
Belden et al.24 C
18(1000) 1000 3 × 3 mL GC/NPD AT-80-90 0.081
Acet:Hex (1:1) SM-65-74 0.049
MTL-79-91 0.066
Loos and Niessner25 LiChrolut 200 4 mL GC/MS AT-124.8 0.005
EN(200) MeOH:ethyl DIA-99.8
acetate (3:2) DEA-102.5
Tolosa et al.26 GCB(500) 1000 pH 7 2 × 6 mL GC/NPD AT-89-112 0.0013
60 g NaCl DCM DIA-90-104 0.0023
DEA-92-103 0.002 SM-93-112 0.0013
SDVB(200) 1000 pH 7 2 × 3 mL GC/NPD AT-80-103 0.0014
60 g NaCl ethyl acetate DIA-84-106 0.0025
DEA-89-100 0.0021 SM-83-98 0.0014
aC
18 = octadedecylsilica, SDVB = styrenedivinylbenzene, GCB = grafitized carbon black;
solubility, followed by metribuzin (0.351 µg L-1). Table
6 contains a summary of the occurrence and concen-trations of herbicides detected in samples collected during December 1998.
Conclusions
A rapid and simple SPE method for determining herbicide residues in water by GC-NPD was described. The
method was adapted and validated aiming water monitoring in a region with intense agriculture activities. The low detection and quantification limits achieved with this method allow its application in the determination of herbicide levels below the MRL established by EU directive for drinking water. The SPE method was applied to determine herbicides selected in superficial and groundwater samples collected in Primavera do Leste region (Mato Grosso state, Brazil) and metribuzin was detected in many of the samples analyzed, whereas DIA was not found.
Acknowledgments
E. F. G. C. Dores thanks CNPq and FAPEMAT for financial support and S. Navickiene (project n° 05.2003.01-014) thanks FAP-SE/FUNTEC and MCT/ CNPq for financial support and fellowship.
References
1. Castillo, L. E.; De-La-Cruz, E.; Ruepert, C.; Environ. Toxicol. Chem.1997, 16, 41.
2. Miles, C.; Pfeuffer, R.; Arch. Environ. Contam. Toxicol.1997, 32, 337.
3. Kammerbauer, J.; Moncada, J.; Environ. Pollut.1998, 103, 171. 4. Botello, A. V.; Ruede-Quintana, L.; Diaz-González, G.; Toledo,
A.; Bull. Environ. Contam. Toxicol.2000, 64, 390.
5. Thurman, E. M.; Bastian, K. C.; Mollhagen, T.; Sci. Total Environ.2000, 248, 189.
6. Zimmerman, L. R.; Thurman, E. M.; Bastian, K. C.; Sci. Total Environ.2000, 248, 169.
7. Lanchote, V. L.; Bonato, P. S.; Cerdeira, A. L.; Santos, N. A. G.; Carvalho, D.; Gomes, M. A.; Water, Air, Soil Pollut.2000, 118, 329.
8. Filizola, H. F.; Ferracini, V. L.; Sans, L. M. A.; Gomes, M. A. F.; Ferreira, C. J. A.; Pesq. Agrop. Bras.2002, 37, 659. 9. Laabs, V.; Amelung, W.; Pinto, A.; Wantzen, M.; Silva, C. J.;
Zech, W.; J. Environ. Qual.2002, 31, 1636.
10. Mattos, M. L. T.; Peralba, M. C. R.; Dias, S. L. P.; Prata, F.; Camargo, L.; Pesticidas: Revista de Ecotoxicologia e Meio Ambiente2002, 12, 145.
Table 5. Calibration data, detection limit and quantification limit of the herbicides analyzed by GC-NPD
Pesticide Linear range / (µg mL-1) Equation Correlation coefficient (r2) LOD / (µg L-1) LOQ / (µg L-1)
DIA 0.010-0.416 y = -178 + 9468 x 0.9971 0.041 0.104
DEA 0.009-0.376 y = -143 + 13146 x 0.9990 0.041 0.094
Trifluralin 0.020-1.020 y = -2.19 + 5084 x 0.9997 0.078 0.102
Simazine 0.010-0.400 y = -44 + 14056 x 0.9996 0.023 0.050
Atrazine 0.011-0.428 y = -17 + 13727 x 0.9993 0.036 0.054
Metribuzin 0.021-1.060 y = -88 + 6204 x 0.9991 0.069 0.106
Metolachlor 0.103-2.060 y = -55 + 3338 x 0.9990 0.088 0.206
Table 6. Occurrence of herbicides in water samples collected in the
Primavera do Leste region (Middle West of Brazil) during December 1998
Sampling site n Compound freq. Concentration / (µg L-1)
min. max.
drinking DEA < 0.041 0.078
water well atrazine < 0.036 0.063
20 simazine 14 < 0.023 0.061 metribuzin < 0.069 0.351 metolachlor < 0.088 0.091 waterhole 5 metribuzin 4 < 0.069 0.090 metolaclor < 0.088 1.732
dam 2 metribuzin 1 < 0.069 0.138
Cabeceira simazine 2 < 0.023 0.047
dos Bois river 3
irrigation DEA < 0.041 0.206
well atrazine 0.078 0.156
3 simazine 3 < 0.023 0.085
metribuzin < 0.069 0.129 trifluralin < 0.078 0.102
n: number of water samples; min. - max.: minimum and maximum concentrations; freq.: number of positive samples.
Figure 2. GC-NPD chromatogram of a drinking water well sample. For
11. Thier, H. P.; Zeumer, H.; Manual of Pesticide Residue Analysis, Vch: New York, 1987, vol.1.
12. Junker-Buchheit, A.; Witzenbacher, M.; J. Chromatogr., A1996, 737, 67.
13. Eisert, R.; Levsen, K.; Wunsch, G.; Int. J. Environ. Anal. Chem.
1995, 58,103.
14. Lacorte, S.; Guiffard, I.; Fraisse, D.; Barceló, D.; Anal. Chem.
2000, 72, 1430.
15. Azevedo, D. A.; Lacorte, S.; Vinhas, T.; Viana, P.; Barceló, D.; J. Chromatogr., A2000, 879, 13.
16. Quintana, J.; Martí, I.; Ventura, F.; J. Chromatogr., A2001, 938, 3.
17. Panshin, S. Y.; Carter, D.; Baylles, E. R.; Environ. Sci. Technol.
2000, 34, 131.
18. Pinto, G. M. F.; Jardim, I. C. S. F.; J. Chromatogr., A2000, 869, 463.
19. Carabias-Martínez, R.; Gonzalo, E. R.; Herrero-Hernandez, E.; San Roman, F. J. S.; Flores, M. G. P.; J. Chromatogr., A2002, 950, 157.
20. Gfrerer, M.; Martens, D.; Gawlik, B. M.; Wenzl, T.; Zhang, A.; Quan, X.; Sun, C.; Chen, J.; Platzer, B.; Lankmayr, E.; Kettrup, A.; Chemosphere2002, 47, 455.
21. Di Corcia, A.; Nazzari, M.; Rao, R.; Samperi, R.; Sebastiani, E.; J. Chromatogr., A2000, 878, 87.
22. Carabias-Martínez, R.; Gonzalo, E. R.; Laespada, M. E. F.; San Roman, F. J. S.; J. Chromatogr., A2000, 869, 471. 23. Jeannot, R.; Sabik, H.; Sauvard, E.; Genin, E.; J. Chromatogr.,
A2000, 879, 51.
24. Belden, J. B.; Hofelt, C. S.; Lydy, M. J.; Arch. Environ. Contam.
Toxicol. 2000, 38, 7.
25. Loos, R.; Niessner, R.; J. Chromatogr., A1999, 835, 217. 26. Tolosa, I.; Douy, B.; Carvalho, F. P.; J. Chromatogr., A1999,
864, 121.
Received: August 31, 2005
Published on the web: June 20, 2006