Article
Printed in Brazil - ©2017 Sociedade Brasileira de Química0103 - 5053 $6.00+0.00
*e-mail: [email protected]
Development and Characterization of Synthetic Chalcones-Loaded Eudragit RS 100
Microparticles for Oral Delivery
Cristian R. Kleemann,a Talitha C. dos Santos,a Luciana C. Tavares,b
Moacir G. Pizzolattib and Angela M. de Campos*,a
aDepartamento de Ciências Farmacêuticas, Centro de Ciências da Saúde and bDepartamento de Química,
Centro de Ciências Físicas e Matemáticas, Universidade Federal de Santa Catarina, Campus Universitário, Trindade, 88040-900 Florianópolis-SC, Brazil
Eudragit® RS100 microspheres of two chalcones were prepared by solvent evaporation
technique. A simple and rapid high-performance liquid chromatography (HPLC) method was developed and validated to determine the encapsulation efficiency, drug loading and release profiles of these chalcones in a microparticulate system. The mean EE values for the two chalcones-loaded microparticles were 98.8 ± 1.3% and 99.5 ± 0.9%. Scanning electron microscope (SEM) studies showed that one chalcone-loaded microspheres are spherical and smooth appearance whereas the other chalcone-loaded microspheres showed irregular particles and a rough surface. The analysis of the second chalcone by thermogravimetric analysis (TGA) showed a higher thermal stability compared to the first chalcone. Drug release profiles were determined at pH 7.4 phosphate buffered saline (100 mmol L–1) with sodium lauryl sulfate (0.5%). The systems prepared with Eudragit®
showed 78 and 95% of the two chalcones were released after 24 hours. The experimental results indicated that the prepared polymeric microspheres may be useful for potential applications.
Keywords: chalcones, microparticles, release control, drug delivery system, RP-HPLC
Introduction
Chalcones are precursors in the biosynthesis of flavonoids and isoflavonoids, the largest class of secondary metabolites in plants, and have been widely synthesized in organic chemistry.1-3 They exhibit several types of biological
activity which varies according to the different substituents in the molecules. Thus, they show good potential for further studies and have attracted considerable interest in recent years. Structurally, chalcones, 1,3-diaryl-2-propen-1-ones, consist of open-chain flavonoids in which the two aromatic rings are joined by a 3-carbon α,β-unsaturated carbonyl system.2-4 Recently, Tavares et al.1 developed a
series of new 6-quinolinyl N-oxide chalcones as well as the 6-quinolinyl chalcones and N-methyl quinolinium iodide derivatives and evaluated their antifungal and cytotoxic activities. The results showed that the majority of these chalcones demonstrated strong activity against pathogenic fungi and tumor cells. This suggests that new chalcone molecules are promising compounds that should be studied in order to investigate other activities
and even develop new treatment forms. However, these chalcones showed higher liposolubility, which can result in incomplete intestinal absorption and very low systemic exposure after oral administration. Thus, new approaches to enhancing the oral bioavailability of these chalcones have become an important research topic. The absorption of small hydrophobic molecules is often related to their physicochemical properties which include drug dissolution from the formulation, drug solubility and drug permeability.5,6 These limitations emphasize the
need to develop new and more effective drug delivery systems, for example, microparticles. Besides allowing the controlled release of the drug content, one of the advantages of microparticulate systems is their ability to improve the bioavailability of poorly water-soluble drugs. Microencapsulation processes can be used to improve the pharmacokinetic properties of these compounds. The reduced size of microparticles and the consequent increase in surface area can substantially increase the drug release rate.7 Therefore, the microencapsulation of bioactive
substances, which was first reported around 70 years ago, continues to be an important formulation strategy.5,8
microencapsulation seems to be an interesting strategy to overcome the problems related to the low water solubility of these molecules. Thus, we developed Eudragit® RS 100
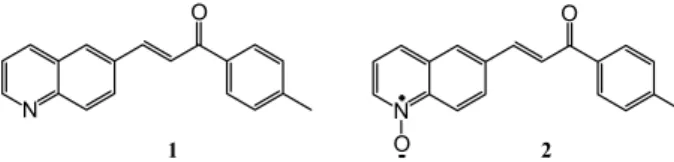
microparticles containing a molecule model representing each series: chalcones 1 (2E )-1-(4-methylphenyl)-3-(6-quinolinyl)-2-propen-1-one, molecular weight 273.32 g mol–1, and chalcone 2 (2E
)-1-(4-methylphenyl)-3-(1-oxide-6-quinolinyl)-2-propen-1-one, molecular weight 289.33 g mol–1 (Figure 1). The objective of this
paper was to develop and characterize a drug delivery system for oral administration in order to improve the therapeutic potential of these chalcones.
Experimental
Materials
Eudragit® RS100 and polyvinyl alcohol (PVA)
(Mowiol 40-88; Sigma-Aldrich; Germany) were used as received. All other materials were of analytical grade. The 6-quinolinyl chalcone 1 was synthesized by a condensation of 6-quinolinecarboxaldehyde with commercially available
4-methylacetophenone. The 6-quinolinyl N-oxide
chalcone 2 was obtained by reaction of chalcone 1 with the oxidizing agent m-chloroperoxybenzoic acid as previously described by Tavares et al.1
Validation of HPLC method
Equipment
High-performance liquid chromatography (HPLC) runs were performed using a PerkinElmer chromatograph, equipped with a Series 200 auto-sampler, Series 200 binary pump, Series 200 UV-Vis detector and Series 200 vacuum degasser. A Phenomenex ODS pre-column filter (4.0 × 3.0 mm) was installed in front of the analytical C8
RP column (5.0 µm, 250 × 4.6 mm, PerkinElmer). The data were gathered using TotalChrom® Workstation software.
Chromatographic conditions
Chromatographic analysis was performed in isocratic
mode. The mobile phase for the Eudragit® RS100
microparticle analysis consisted of methanol:water (80:20, v/v), which was pumped at a flow rate of
0.8 mL min–1. The sample injection volume was 10 µL
and detection wavelengths were 322 and 306 nm for 1 and
2, respectively. All experiments were performed at room temperature and the total peak area was used to quantify the chalcones.
Preparation of analytical curves
Stock solutions of 400 µg mL–1 of chalcones 1 and 2
were prepared in methanol. The standard solutions were then prepared by diluting the stock solution to give 2, 4, 6, 8, 16, 20, 24, 30 and 40 µg mL–1 in methanol:water
(80:20, v/v) in order to determine the Eudragit® RS100
polymer applying the method. All chromatographic analyses were performed in triplicate and the average peak areas were calculated. The quantification of the individual compounds was performed using a validated regression curve (r2 > 0.999).9
Validation of HPLC method
The validation was carried out in accordance with International Conference on Harmonization (ICH) guidelines10 and the Agência Nacional de Vigilância
Sanitária (ANVISA).9 The parameters evaluated were
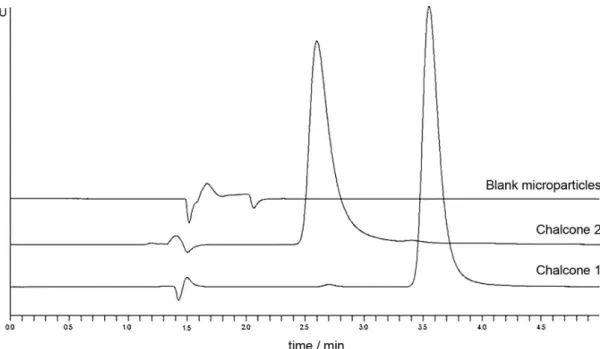
specificity, linearity, precision (intermediate precision and repeatability), accuracy, detection limit and quantitation limit. Specificity was evaluated through comparison of the representative chromatograms of blank Eudragit® RS100
microparticles with chalcone methanol solutions (1 and 2). Linearity was determined by calculating the regression line from the peak area ratio and solution concentration (2, 4, 6, 8, 16, 20, 24, 30 and 40 µg mL–1). Precision was evaluated
at two levels: intermediate precision, that is, precision on different days determined by analyzing, in triplicate, three different standard samples (16, 20 and 24 µg mL–1) on three
different days with a two-day interval between analyses; and system repeatability determined by testing a standard solution (20 µg mL–1) 6 times on the same day. Calculations
were expressed as relative standard deviation (RSD) and the results should be less than 5%.9 Accuracy was evaluated
through a recovery test by comparing the value which is conventionally accepted as the true value with the value found. The recovery of the known concentrations of 1
and 2, at three different levels (lower, medium, and upper concentrations corresponding to 16, 20 and 24 µg mL–1,
respectively), was determined in triplicate. The limits of detection and quantitation were calculated directly from the calibration curve. The limits of detection was taken as the lowest concentration that can be detected but not necessarily quantified and the limits of quantitation was taken as the lowest concentration of analyte that can be quantified with acceptable precision and accuracy. Figure 1. Structures of the 6-quinolinyl chalcone 1 and 6-quinolinyl
Preparation of polymeric microparticles
Eudragit® RS100 microparticles were obtained by
solvent evaporation using the oil/water emulsion technique
described by Wischke and Schwendeman5 with some
modifications. Briefly, 100 mg of polymer and 10 mg of chalcone were dissolved in 1 mL of dichloromethane and drop in 100 mL of 0.5% (m/v) PVA solution (aqueous phase). An oil-in-water emulsion was then obtained by magnetic stirring (750 rpm) for 3 min. For solvent extraction, the emulsion was subsequently diluted with 100 mL of 0.1% (m/v) PVA solution (extraction phase) and stirred for 3 h at room temperature. Finally, microparticles were centrifuged (2500 rpm for 10 min) and the resulting supernatant was discarded. The particles were re-suspended thrice in 70 mL of water and dried by freeze-drying for at least 48 h. Blank microparticles were prepared according to the procedure described above but omitting the chalcones. The microparticles were characterized in terms of their morphology, size, size distribution, thermal analysis and encapsulation efficiency using the HPLC validated method.
Determination of micropar ticles size, par ticle size distribution and surface shape
The particle size and particle size distribution were determined by laser diffraction using a Mastersizer 2000 size analyzer (Malvern Instruments, UK). The surface morphology of the microparticles was observed with a scanning electron microscope (SEM, JEOL JSM-6390LV) with dried microparticles mounted onto stubs using double-sided adhesive tape and gold coating.
Thermal analysis
Thermogravimetric analysis (TGA) was carried out in a TGA-50 thermobalance (Shimadzu) under dynamic nitrogen atmosphere with a flow rate of 50 mL min−1. Approximately
3 mg of samples were placed in platinum crucibles. Heating scans from 25 to 600 °C at 10 °C min–1 were performed
for each sample. Differential scanning calorimetry (DSC, Shimadzu DSC-60) measurements were carried out in triplicate, in cell with a sensitivity of ± 0.1 K, using hermetically sealed aluminum crucibles immediately before measurement, model 201-53090. The temperature range was 25-200 °C applied at a heating rate of 10 °C min−1, under a
dynamic N2 atmosphere of 50 mL min−1. For these analyses,
2 mg of each sample were used. The fusion enthalpy was determined using Shimadzu TA60 software.
Method applicability
Encapsulation efficiency and drug loading
The microparticles (10 mg accurately weighed) were
dissolved in 10 mL of methanol and maintained under magnetic stirring for 2 h to extract chalcones associated in the particles. The solution was filtered with a 0.45 µm PVDF membrane and the concentration of the chalcones was analyzed by HPLC. The percentage encapsulation efficiency was calculated by the formula: (amount of chalcone encapsulated/amount of total chalcone) × 100. The drug loading capacity for each formulation was expressed as mg chalcone/100 mg microparticles.
Evaluation of in vitro release from microparticles
The in vitro release profile of chalcones 1 and 2 from microparticles was determined in pH 7.4 phosphate buffered saline (100 mmol L–1) with sodium lauryl sulfate
(0.5%). Microparticles were placed in bottles containing 150 mL of dissolution media and placed in magnetic shaking (150 rpm) at 37.0 ± 0.5 °C. At pre-determined time intervals, aliquots of 5 mL were collected for analysis and filtered with a 0.45 µm PVDF membranes. The medium was replaced with fresh dissolution medium at each interval. The amount of each chalcone in the samples was determined by the described HPLC method. The results obtained in triplicate were expressed as a percentage of the chalcone release.
Results and Discussion
Validation of HPLC method
Isocratic reversed phase high-performance liquid chromatography (RP-HPLC) methods with UV detection were proposed as appropriate for the quantitative determination of the chalcones 1 and 2 in polymeric microparticles. The chromatographic conditions, such as the portions of mobile phase, were adjusted as a function of the physicochemical characteristics of the chalcones and did not interfere with the structure of the Eudragit® RS100
microparticles. Runs were performed using a mobile phase comprised of methanol:water (80:20, v/v)11 at a flow of
0.8 mL min–1.
showed linear regression in the range of r2 = 0.999 in both
cases. The regression equations for the mean calibration were y = 67630x + 18099 for 1 and y = 83887x + 26038 for 2, where x is the concentration and y is the peak area. Precision expresses the capability of a method to reproduce results when it is applied to multiple analyses of the same sample, so it is important to evaluate random errors in the method performance. In the case of the development of this method, the precision was validated by determining the intermediate precision through analyzing in triplicate three different standard samples on 3 different days under the same conditions and the repeatability by testing a standard solution (20 µg mL–1) for each chalcone. The
relative standard variation for intermediate precision and repeatability of the system were less than 5%. These results indicate that the proposed method presents good precision. The precision evaluated by way of the repeatability demonstrated a correlation between the results under the same operating conditions in a short period of time. This experiment was carried out using one concentration of the chalcone standards (20 µg mL–1) and six consecutive
independent measurements were performed. The results obtained were reproducible, with an RSD of less than 1%. The accuracy of the method for determining chalcones 1
and 2 was assessed by considering the percent of chalcone recovered with the method and by HPLC. The accuracy results can be considered as satisfactory. The lowest concentrations at which chalcones 1 and 2 can be detected or quantified with acceptable precision and accuracy were calculated from the standard deviation of the intercept with
the y axis and the slope of the calibration curve obtained. The detection limit and quantitation limit values for the concentrations of chalcones in the Eudragit® RS100
microparticles were found to be 0.2 and 0.6 µg mL–1 for 1 and 0.4 and 1.2 µg mL–1 for 2, respectively. A rapid and
effective method for the determination of chalcones 1 and
2 in Eudragit® RS100 microparticles was developed and
validated aiming to quantify these chalcones in experiments in terms of encapsulation efficiency and dissolution in the microparticulate systems. The methodology was evaluated in order to establish the suitability of the analytical method for the synthetic chalcones 1 and 2. All results showed that the methods were specific, accurate, linear and sensitive in the concentration range tested. Data presented in Table 1 summarize the analytical conditions executed in the validation.
Characterization of microparticles
The surface morphology of the chalcone 1-loaded microparticles showed a spherical and smooth appearance (Figure 3), the mean diameter of the volume was 94 µm and granulometric range was 57 to 139 µm. In contrast, in chalcone 2-loaded microparticles irregular particles and a rough surface were observed. The mean diameter of the volume was 106 µm and the granulometric range was 59 to 164 µm. The span values, an indicator of the particle size distribution, were 0.9 and 1.0 for chalcones 1 and 2, respectively, which can be considered to reflect a narrow size distribution in all of the formulations.
Figure 2. Specificity of the chromatographic method using chalcones 1 and 2 in methanol solution (40 µg mL−1) and blank microparticles. For chromatographic
Thermal analysis
The application of the thermal analysis allows to observe the physical and chemical changes occurring in substances as a function of the temperature. Also, TGA and DSC techniques can provide data on parameters such as the purity, and compatibility between the components of a formulation for the characterization of compounds. The TGA profiles provided information on the decomposition behavior of the compounds 1 and 2 from 25 to 600 °C. Figure 4 shows one weight loss stage which can be observed on the TGA curve for 1 at 305 to 350 °C (∆m = 94.8%), whereas for 2 there were three stages at 22 to 85 °C (∆m = 6.4%), 215 to 282 °C (∆m = 13.7%) and 282 to 380 °C (∆m = 32.9%) totaling a weight loss of 63%, the reaction is not completed until about 600 °C. These results suggest that within the temperature range analyzed chalcone 2 has a higher thermal stability (since complete mass loss was not observed) when compared with chalcone 1. In the DSC curves for chalcone 1 one endothermic fusion event occurs
at 159.1 °C, (∆H = −116.9 J g–1). In contrast, chalcone 2
showed two endothermic fusion events, the first appearing at 110.7 °C with ∆H = −13.4 J g–1 and the second at 166.3 °C
with ∆H = −68.3 J g–1. The first endothermic fusion may be
attributed to the presence of synthesis impurities.
The TGA curves for the chalcones and Eudragit® RS100
microparticles are shown in Figure 4. Chalcone 1-loaded microparticles expressed one mass loss event occurring in the temperature range of 320-450 °C (∆m = 100.6%) (Figure 4a). Considering that the thermal degradation of this formulation begins at a higher temperature compared with pure chalcone, it can be concluded that this system ensures more thermal stability. Likewise, the system loaded with chalcone 2 microparticles showed one degradation event in the range of 320-430 °C (∆m = 98.9%) (Figure 4b). These results also demonstrated a higher thermal stability compared with pure chalcone, due to thermal degradation at higher temperatures.
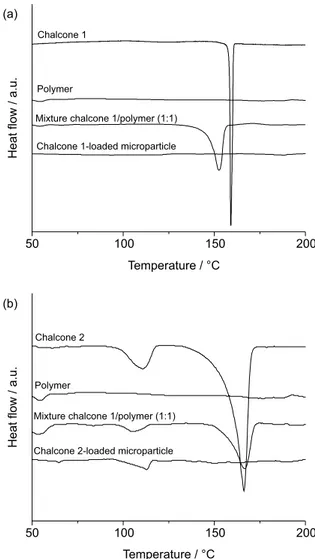
Diferential scanning calorimetry has proven to be a useful tool to study the compatibility between the drug and the components of a formulation, highlighting the physical and chemical interactions between the compounds.12,13
Figure 5 shows the DSC curves for the chalcones (1 and 2),
the Eudragit® RS100 polymer, the chalcone/polymer
mixture (m/m; 1:1) and the microparticles. These results indicate that the polymer presented no fusion events in the range tested. The chalcone 1/polymer mixture promotes a slow displacement to lower temperatures of the band associated with the chalcone 1 melting point, which may suggest physical interaction between the compounds. Table 1. Parameters of the HPLC method to determine chalcones 1 and chalcones 2 in microparticulate system
Parameter Theorical concentration / (µg mL–1)
Results Interpretation
Concentration obtained /
(µg mL–1) RSD / % Recovery / % Acceptability
Precision of chalcone 1 16 15.9 1.9 − RSD < 5%
20 19.8 1.9 −
24 23.7 1.5 −
Precision of chalcone 2 16 15.7 1.0 − RSD < 5%
20 19.8 2.2 −
24 23.8 2.6 −
Accuracy of chalcone 1 16 15.6 0.3 97 95-105%
20 19.5 0.5 97
24 23.6 1.7 98
Accuracy of chalcone 2 16 15.8 0.8 99 95-105%
20 19.8 0.8 99
24 24.4 2.5 102
Repeatability of chalcone 1 20 19.9 0.2 − RSD < 5%
Repeatability of chalcone 2 20 19.9 0.5 − RSD < 5%
RSD: relative standard deviation.
On the other hand, the chalcone 2/polymer mixture presented a displacement of the melting point to higher temperatures and may also indicate physical interactions between the components (Figure 5b). The DSC curve for chalcone 1-loaded microparticles demonstrated one endothermic fusion event related to the chalcone; however, with displacement to lower temperatures (Figure 5a).
Encapsulation efficiency and drug loading
The validated method was used to determine the content of chalcones in Eudragit® RS100 microparticles. The
microspheres showed mean EE values for chalcones 1 and
2-loaded microparticles of 98.8 ± 1.3% and 99.5 ± 0.9%, as well as drug loading values of 8.9 ± 1.4 and 9.1 ± 0.9%, respectively. These results indicate that the microparticle system was able to encapsulate chalcones with high
encapsulation efficiency. Poor solubility in water and the polymer characteristics contributed in the higher values observed for the encapsulation. Eudragit® RS100 has a low
concentration of quaternary ammonium groups (around 5%)14 resulting in lower polymer permeability, which
hinders the diffusion of the drug to the external medium during the preparation of the microparticles.15
In vitro release
The in vitro release profile of these chalcones from Eudragit® RS100 microparticles is represented in Figure 6.
Chalcone 1-loaded microparticles exhibited a slow and sustained release reaching 78% at around 12 h. Different behavior was observed in chalcone 2-loaded microparticles, an initial release phase was observed in the first hours, with maximal release of the drug content, 95%, being released Figure 4. TGA curves of chalcone 1 (solid line) and chalcone 1-loaded
microparticles (dash line) (a); and TGA curves of chalcone 2 (solid line) and chalcone 2-loaded microparticles (dash line) (b) at a heating rate of 10 °C min−1 and under nitrogen air atmosphere (50 mL min−1).
Figure 5. DSC curves of chalcone 1, polymer, mixture chalcone 1/polymer (1:1) and chalcone 1-loaded microparticles (a) and chalcone 2, polymer, mixture chalcone 2/polymer and chalcone 2-loaded microparticles (b) at a heating rate of 10 °C min−1 and under nitrogen air atmosphere
within 4 h, after the drug release reached a stable plateau until the end of the experiment (24 h). No alterations or different peaks to the chromatograms were observed either during chalcones content quantification studies.
Conclusions
Microspheres were synthesized successfully by solvent evaporation using the oil/water emulsion technique; the particles have a good EE and drug loading values, which can have a good role as drug delivery systems. The HPLC method described herein was applied to the determination of two chalcones in Eudragit® RS100 microparticles.
The method was found to be suitable for application to the analysis of microparticles during the preparation and characterization of these microspheres systems with a view to performing in vivo studies.
Acknowledgments
This study was supported by grants from Conselho Nacional de Desenvolvimento Científico e Tecnológico (CNPq). The authors thank Siobhan Wiese for revising the manuscript.
References
1. Tavares, L. C.; Johann, S.; Alves, T. M. A.; Guerra, J. C.; Souza-Fagundes, E. M.; Cisalpino, P. S.; Bortoluzzi, A. J.; Caramori, G. F.; Piccoli, R. M.; Braibante, H. T. S.; Braibante, M. E. F.; Pizzolatti, M. G.; Eur. J. Med. Chem. 2011,46, 4448. 2. Nagwanshi, R.; Bakhru, M.; Jain, S.; Med. Chem. Res.2012,
21, 1587.
3. Katsori, A. M.; Hadjipavlou-Litina, D.; Curr. Med. Chem.2009, 16, 1062.
4. Zuanazzi, J. A. S.; Montanha, J. A. In Farmacognosia: da Planta ao Medicamento; Simões, C. M. O.; Schenkel, E. P.; Gosmann, G.; Mello, J. C. P.; Mentz, L. A.; Petrovick, P. R., eds.; Editora UFRGS/UFSC: Porto Alegre/Florianópolis, Brasil, 2004, ch. 16.
5. Wischke, C.; Schwendeman, S. P.; Int. J. Pharm. 2008, 364, 298.
6. Cao, X.; Yu, L.; Sun, D. In Biopharmaceutics Applications in Drug Development; Rajesh, K.; Lawrence, Y., eds.; Springer: New York, United States, 2008, ch. 4.
7. Padalkar, A. N.; Shahi, S. R.; Thube, M. W.; Int. J. Pharm. Res. Develop. 2011, 3, 99.
8. Taylor, H. F.; US pat. 2183053A 1936 (Serial No. 113,988). 9. http://bvsms.saude.gov.br/bvs/saudelegis/anvisa/2003/
res0899_29_05_2003.html, accessed in September 2016. 10. http://www.ich.org/fileadmin/Public_Web_Site/ICH_Products/
Guidelines/Quality/Q2_R1/Step4/Q2_R1__Guideline.pdf, accessed in September 2016.
11. Benny, O.; Menon, L. G.; Arid, G.; Goren, E.; Kim, S. K.; Stewman, C.; Black, P. M.; Carroll, R. S.; Machluf, M.; Clin. Cancer Res.2009, 15, 1222.
12. Verma, R. K.; Sanjay, G.;J. Pharm. Biomed. 2004, 35, 449. 13. Bernardi, L. S.; Oliveira, P. R.; Murakami, F. S.; Silva, M. A. S.;
Borgmann, S. H. M.; Cardoso, S. G.; J. Therm. Anal. Calorim.
2009,97, 729.
14. Behera, B. C.; Sahoo, S. K.; Dhal, S.; Barik, B. B.; Gupta, B. K.; Trop. J. Pharm. Res. 2008, 7, 879.
15. Jelvehgari, M.; Barar, J.; Nokhodchi, A.; Shadrou, S.; Valizadeh, H.; Adv. Pharm. Bull. 2011, 1, 18.
Submitted: May 4, 2016
Published online: September 26, 2016
Figure 6. Release profile from chalcones-based microparticles in pH 7.4 phosphate buffered saline (100 mmol L−1) with sodium lauryl