Article
Printed in Brazil - ©2017 Sociedade Brasileira de Química0103 - 5053 $6.00+0.00*e-mail: [email protected]
Isopropyl Octanoate Synthesis Catalyzed by Layered Zinc
n
-Octanoate
Swami A. Maruyama, Luis Ricardo S. Kanda and Fernando Wypych*
Departamento de Química, Universidade Federal do Paraná, CP 19032, 81531-980 Curitiba-PR, Brazil
Isopropyl octanoate is an ester used in the formulation of cosmetics, foods, medicines, and other products. The peculiar thermodynamic and kinetic factors, allied with the demand for the applications mentioned above, justify the development of an optimized process for its synthesis. In the present article, the esterification of octanoic acid with isopropanol while using zinc
n-octanoate as catalyst is reported. A factorial design was employed where variables such as molar
ratio (alcohol:acid), percentage of catalyst (in relation to the acid mass) and temperature were investigated. It was observed that zinc octanoate showed promising catalytic activity, especially at 165 °C, with molar ratios of 8:1 and 6:1, and with 7 and 10% of catalyst, where conversions up to 75% were observed. Optimized conditions for the production of isopropyl octanoate were determined to be 165 °C, 6:1 molar ratio and 5.97% of catalyst.
Keywords: isopropyl octanoate, zinc octanoate, octanoic acid
Introduction
Esters produced from alcohols and carboxylic acids, as well as from terpenoid alcohols (e.g., geraniol and citronellol), are widely used in the food and pharmaceutical industries as flavoring agents, due to their organoleptic properties and easy volatilization.1-4 Among such esters, isopropyl octanoate,
derived from the process of isopropanol esterification with octanoic acid in the presence of an acid catalyst (typically sulfuric or hydrochloric acid) in homogeneous medium, requires a complex process to remove the products and neutralize the acid catalyst.5 Other solid acid catalysts
have also been reported, but due to high acidity, parallel reactions are frequently observed.6 Esterification reactions
with branched-chain alcohols generally have low yields, due to low reactivity of the radical derived from the alcohol.7
Despite these difficulties, isopropyl octanoate is required for the formulation of cosmetics, toiletries, foods, medicines, and other products.8,9
Therefore, it is highly relevant to find more efficient methods for esterification of octanoic acid, a saturated linear-chain carboxylic acid with affordable cost and essential to obtain isopropyl octanoate.
A class of materials used in heterogeneous catalysis that have received great attention in scientific and industrial fields is layered compounds, with their
structures based on stacked layers along the basal axis, separated or not by cations and anions.10 In this context,
the layered metal carboxylates present strong potential for application as catalysts to synthesize various chemical compounds. Laurates of transition metals and benzoates of alkaline earth metals have been employed successfully for the production of methyl laurate and methyl benzoate, respectively.11,12
Research into new catalytic systems is facilitated by the use of alternative experimental designs, such as the Box-Behnken design (BBD), which is a factorial planning with three levels consisting of three interlocked 22 designs
and a central point, in order to reduce the number of experiments that are required during the investigation of complex matrices.13 BBD has mainly been applied
to optimize extraction of several analytes, synthesis/ derivatization reactions, chromatographic separation and electrochemical processes, but has not yet been applied for esterification of octanoic acid with isopropanol.
Therefore, the objective of this paper is to describe the development of an optimized process through a Box-Behnken design for the synthesis of isopropyl octanoate from affordable chemicals, exploring the catalytic properties of layered zinc octanoate.14 Zinc octanoate was
chosen for this work: (i) to ensure that no other ester with
zinc-based catalysts showed good catalytic activity during esterification of fatty acids and could be easily recovered and reused.10
Experimental
Synthesis of zinc octanoate
First, sodium octanoate was produced by reacting 120.3 mmol of octanoic acid, (solubilized in 40 mL of methanol) with a stoichiometric amount of a NaOH methanolic solution, previously prepared at 50 °C under vigorous stirring. The sodium octanoate precipitate was solubilized with the addition of 50 mL of distilled water at room temperature under magnetic stirring.
Regarding the synthesis of zinc octanoate, an anhydrous zinc chloride (Vetec, 98.0%) solution prepared with 60.15 mmol in 100 mL of distilled water was slowly added, under magnetic stirring, to the solution containing sodium octanoate. At the end of the addition, the mixture was kept under stirring for 30 minutes. The white solid obtained was washed and centrifuged twice with distilled water and then dried in a vacuum oven at 60 °C until constant weight. The total yield of this synthesis was 97.44%.
Characterization techniques
X-ray powder diffraction (XRD) was used to characterize the structure of zinc octanoate. The experiments were conducted on a Shimadzu XDR-6000 diffractometer, using CuKα radiation of λ = 1.5418 Å, current of 30 mA, tension of 40 kV and dwell time of 2° min-1. The samples were placed in glass sample holders
and lightly hand pressed so that the crystals were perfectly set in the holder’s plane.
To verify that the structure formed was consistent with that of metal carboxylates, the vibrational modes present in the compound were analyzed by Fourier transform infrared spectroscopy (FTIR). Measurements were made in KBr (spectroscopic grade, Vetec) discs and collected in a Bio-Rad FTS 3500GX spectrophotometer, in the 400-4000 cm-1 range, with a resolution of 4 cm-1 and
accumulation of 32 scans.
Thermal analysis measurements (simultaneous thermogravimetry, TGA, and differential scanning calorimetry, DSC) were performed in a Netzsch STA 449 F1 Jupiter analyzer under synthetic air flow of 50 mL min-1, using alumina crucibles, heating rate
of 10 °C min-1 and temperatures ranging from 30 to
1000 °C. High resolution DSC analyses were obtained in a Netzsch 200F3 calorimeter using aluminum crucibles,
N2 atmosphere with flow of 20 mL min-1, heating/cooling
rates of 10 °C min-1, and temperature range from 20 to
155 °C.
Nuclear magnetic resonance (NMR) spectra in the solid state were acquired using a Bruker AVANCE 400 spectrometer operating at 9.4 Tesla, observing 13C nuclei
at 100.6 MHz, equipped with a multi-core probe for solids (MAS) of 4 mm with spin in the magic angle at 5000 Hz.
13C NMR spectra were acquired through the application
of 90° excitation pulses, followed by cross-polarization for 2.0 ms, high power decoupling during acquisition (0.04 s) and relaxation time of 5 s. 13C NMR spectra were
acquired with 2048 points and accumulation of 1024 for each sample. Spectra were processed by the application of an exponential multiplication in free induction decay (FID) by a factor of 50 Hz, followed by Fourier transformation with 4096 points (real spectrum size, RSS).
Catalytic activity
The catalytic activity of zinc octanoate was investigated for the esterification of octanoic acid (98% of purity) with isopropanol (98% of purity). Tests were performed in a Büchi GlassUster miniclave drive pressurized steel reactor with external rotation at 500 rpm. Temperature control was achieved with a circulatory heating system (Julabo HE-4) coupled to the reactor. For the tests in the reactor, the reaction conditions were established from a Box-Behnken design with three levels and three variables, in which the influence of the variables temperature, molar ratio (isopropanol/octanoic acid) and percentage of catalyst were evaluated. To check the method’s repeatability, the central point was evaluated in triplicate.
Levels of the upper and lower limits for each variable were: temperature 165 and 145 °C (central point of 155 °C), molar ratio (MR) 10:1 and 6:1 (central point with molar ratio of 8:1) and percentages of catalyst relative to the mass of octanoic acid were 10 and 4% (central point 7%). Therefore, 15 experiments were carried out, with three of them being related to the center point.
under reduced pressure, at 80 °C for isopropanol. The system pressure was governed by the vapor pressure of isopropanol, the most volatile component in the reaction medium. For reaction temperatures of 145, 155 and 165 °C, the pressures were respectively 6, 8 and 10 bar.
The conversion of octanoic acid into isopropyl octanoate was measured by the remaining acid quantification method (Ca-40-method) of the American Oil Chemists’ Society (AOCS),15 which involves using a solution of
NaOH 0.1 mol L-1, standardized with potassium biphthalate.
The results were expressed as percentage conversion to ester, based on a well-established commercial sample, in this case the tested octanoic acid.
These reactions can also occur due to the influence of temperature,16 so heat conversion tests were carried
out following the BBD above, but ignoring the variable percentage of added catalyst. This study resulted in a total of nine experiments. The catalytic activity of zinc octanoate was measured by comparing the results of conversion to isopropyl octanoate ester, obtained in each condition, between catalyzed reactions and their respective thermal conversions without the addition of catalyst to the reaction medium.
Three experiments of isopropyl octanoate synthesis catalyzed by zinc octanoate as a function of time were carried out in a 300 mL PARR stainless steel reactor, equipped with a special valve which allowed to take 1.5 mL homogeneous aliquots from each reaction at 0, 30, 60, 90, 120, 180 and 240 minutes without having to stop the reaction.
Statistical analysis
The experimental results were analyzed through a response surface method generated by the Design-Expert 7.1 software (Stat-Ease Inc., USA). Model fit quality was evaluated by analysis of variance (ANOVA) and determination coefficients. The basic model equation used to fit the data was:
Y = β0 + β1X1 + β2X2 + β3X3 + β12X1X2 + β13X1X3 +
β23X2X3 + β11X12 + β22X22 + β33X32 + ε (1)
where: Y = desired response; X1, X2 and X3 = independent
variables representing temperature, molar ratio and catalyst percentage, respectively; β0 = constant; β1, β2
and β3 = coefficients representing the linear weight of
X1, X2 and X3, respectively; β12, β13 and β23 = coefficients
representing the interactions between the variables; β11, β22
and β33 = coefficients representing the quadratic influence
of X1, X2 and X3; ε = pure error.17
Results and Discussion
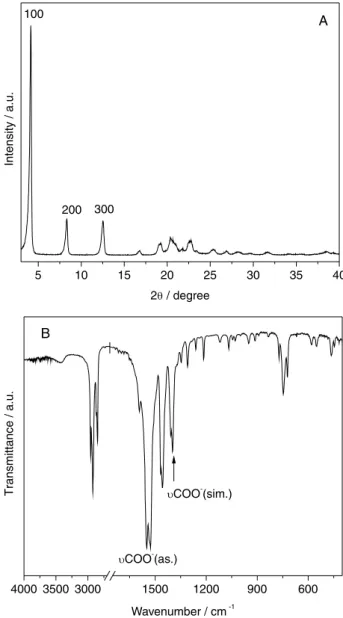
From the X-ray diffraction patterns (Figure 1A), it is possible to observe the typical presence of basal peaks, corresponding to reflection planes in the direction of the plane formed by the interaction between zinc ions and octanoate anions along the crystallographic axis “a”.
The diffraction peaks have a uniform distribution of distances between them, and they can be observed in the region between 3 and 15° in 2θ. All diffraction peaks were indexed in accordance with the literature.18
To calculate the basal cell parameters of zinc octanoate while avoiding errors attributed to the sample displacement from the center of the diffraction goniometer and larger errors at peaks positioned at lower diffraction angles,
5 10 15 20 25 30 35 40
Intensit
y
/
a
.u
.
2/ degree 100
200 300
A
4000 3500 3000 1500 1200 900 600
COO-(as.)
COO-(sim.)
Transmittanc
e
/
a
.u
.
Wavenumber / cm-1 B
Figure 1. (A) X-ray diffraction pattern and (B) FTIR spectrum of zinc
the reported procedure was used.19,20 A basal distance
of 20.83 Å was obtained (see Figure S1 and Table S1 in Supplementary Information), in perfect agreement with the literature.18 The structuring of the layer occurs with the
coordination of carboxylate groups to zinc, a fact that can be confirmed by analysis of the infrared spectrum from the compound, where there is a predominance of vibrational modes characteristic of the organic part of the structure of octanoic acid salts (Figure 1B).
The difference in wavenumber (∆ν) between asymmetric (1550/1530 cm-1) and symmetric (1408/1398 cm-1)
stretching bands with a value of 130 cm-1 indicates that the
carboxylate group is coordinated in the shape of a bridge between two metal centers.21 Therefore, the layer formation
occurs by interaction of oxygen atoms present at the end of the carboxylate with a distinct metallic zinc center.
The doublets from 1500 to 1400 cm-1 correlate with
a reduction of symmetry, relative to the strengths of both zinc-carboxylate bond and Van der Waals interactions between hydrocarbon chains.21 Also, according to the
same authors, the zinc-carboxylate bond is favored for short-chain carboxylates (with up to nine carbons), resulting in a stronger interaction between metal atoms, leading to the splitting of absorption bands.
The absence of a carbonyl absorption band at 1730 cm-1,
along with the presence of new bands in the region of approximately 1500 to 1400 cm-1, also corroborate the
fact that there is complete resonance between C−O bonds of the carbonyl group, as a result of coordination between the zinc atoms and the carboxylate ions.
In addition, the absence of hydroxyl absorption bands in the region of 3500-3300 cm-1 confirms that the obtained
zinc octanoate is anhydrous. Other important bands are: asymmetric stretching ν(CH3) at 2956 cm-1, asymmetric
stretching νa(CH2) at 2924 cm-1, symmetric stretching
ν(CH3) at 2867 cm-1, symmetric stretching νs(CH2)
at 2852 cm-1, twisting ν(CH
2) at 1466 and 1460 cm-1,
deformation ν((C–C)COO-) at 950 cm-1, bending ν(COO-)
at 745 cm-1, rocking ν(CH
2) at 721 cm-1, out-of-plane
twisting ν(COO–) at 580 cm-1, and rocking ν(COO-) at
548 cm-1.14,21-23
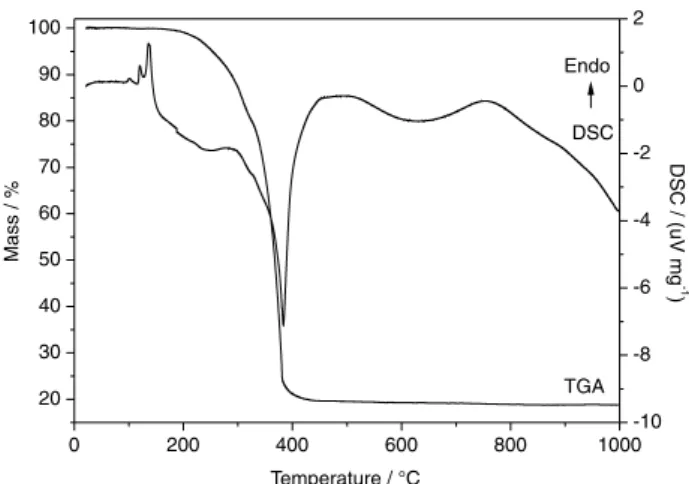
The TGA/DSC curves of zinc octanoate (Figure 2) show that the material is anhydrous, without mass loss up to 180 °C, and the decomposition process occurs in one mass-loss step between 200 and 450 °C, characteristic of the oxidation process of organic material and formation of ZnO. The DSC curve corroborates what was observed in the TGA curve, where an intense exothermic peak was observed with minimum at 383 °C, assigned to the burning of organic matter from the sample, and a broad exothermic band at 632 °C, attributed to the process of
ZnO crystallization. Endothermic peaks in the region of 100 °C will be discussed later in section on the DSC curves obtained by a high resolution device. In the present TGA curve, the results were compatible with the ideal formula for zinc octanoate (Zn[C7H15COO]2), where the observed
ZnO percentage was 23.92%, consistent with the theoretical percentage of the proposed formula (23.13%).18
Catalytic activity
As described in the literature, after reaching 136 °C (melting point of zinc octanoate) during the reaction, a mixture of fragments of the original structure is obtained, where the carboxylate group is coordinated to the metal through two modes: (i) bidentate bridge and (ii) monodentate
mode.11,24,25 After cooling the system, the catalyst is
restructured and separated after the removal of isopropanol in excess, which was used during the reaction. This catalyst melting/dispersion occurs inside the reactor, even under the influence of pressure generated internally by the vapor from the more volatile component in the media, in this case the alcohol used in the reaction. It is important to mention that the alcohol worked both as a reagent and a solvent of octanoic acid. The solvation process of reactants and dispersion of catalyst clusters by isopropanol probably occurred by various intermolecular forces, such as ion-dipole attractions, Van der Waals forces and hydrogen bondings.26 Table 1 shows the
results for conversion of acid to ester.
The greatest value of thermal conversion to ester was 36.83% at 165 °C with 10:1 molar ratio, and the lowest value was 16.96% at 145 °C and 6:1 ratio. The results in all conditions served as comparative bases for the same conditions with addition of the catalyst in the reaction medium. All results (discounting their respective thermal conversions) were positive, which indicates effective contribution of zinc octanoate to convert octanoic acid to
0 200 400 600 800 1000
20 30 40 50 60 70 80 90 100
DS
C/
(u
Vm
g
-1
)
Mass
/
%
Temperature / °C
TGA DSC Endo
-10 -8 -6 -4 -2 0 2
ester, confirming the catalytic behavior of this particular metal carboxylate.
The best ester conversions (74.99, 70.08 and 66.47%) were observed at a temperature of 165 °C, with differences in MR values and percentage of catalyst employed. These experiments still represent, when compared to their equivalent thermal conversion values, gains of 40.31, 38.41 and 29.64%, respectively.
From these results it was possible to establish the positive or negative influence factors, in percentage points, for each variable or interaction between them. The analysis for isolated effects, as well as for combined interactions between each variable (Table 2), provides important data about the magnitude of each term.
Of all the terms, the temperature was the most important factor (12.70 pp). This fact is confirmed by observing experiments 1 and 2 (Table 1), for example: under constant conditions of catalyst percentage and MR, but increasing the temperature from 145 to 165 °C, the conversion rate rose from 38.44 to 70.08%. The same trend was observed in experiment pairs 3/4, 5/6 and 7/8 where the same type of change in temperature led to changes in the conversions from 43.09, 49.71 and 39.89 to 66.47, 61.21 and 74.99%, respectively.
Of all the independent variables, the molar ratio (1.71 pp) presented the least relevance. This fact can be verified by observing that although the increase of the MR led to slight increases in the values of the conversion in reactions at 145 °C and 7% catalyst, and 155 °C with 10% catalyst, there
were reductions in conversion values observed at 165 °C and 7% catalyst and 155 °C with 4% catalyst.
For the percentage of catalyst (3.30 pp), a positive effect in the esterification reactions was also noted, but of lower magnitude in relation to the effect of temperature in the system. The increase in catalyst percentage caused both increases (pairs 9/11, 10/12) and decreases (pair 5/7) of the observed conversion values.
The temperature:MR interaction had a slightly negative effect on the system (−2.07 pp), while the temperature:catalyst (5.90 pp) and catalyst:MR (4.09 pp) interactions had positive effects for esterification reactions. The squared terms MR2 and Catalyst2 also had slightly
negative effects in the system, with the exception of the term temperature2.
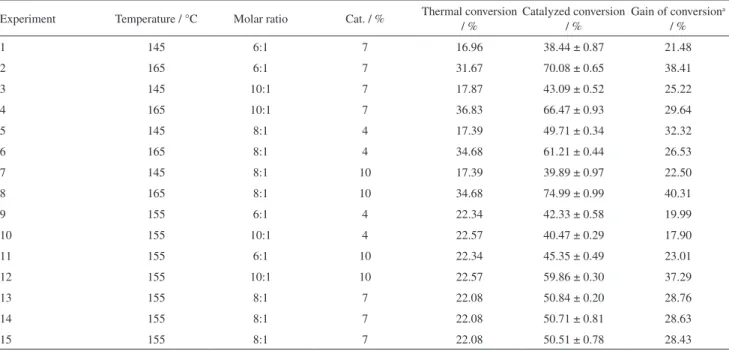
Table 1. Esterification of octanoic acid with isopropyl alcohol
Experiment Temperature / °C Molar ratio Cat. / % Thermal conversion / % Catalyzed conversion / % Gain of conversion/ % a
1 145 6:1 7 16.96 38.44 ± 0.87 21.48
2 165 6:1 7 31.67 70.08 ± 0.65 38.41
3 145 10:1 7 17.87 43.09 ± 0.52 25.22
4 165 10:1 7 36.83 66.47 ± 0.93 29.64
5 145 8:1 4 17.39 49.71 ± 0.34 32.32
6 165 8:1 4 34.68 61.21 ± 0.44 26.53
7 145 8:1 10 17.39 39.89 ± 0.97 22.50
8 165 8:1 10 34.68 74.99 ± 0.99 40.31
9 155 6:1 4 22.34 42.33 ± 0.58 19.99
10 155 10:1 4 22.57 40.47 ± 0.29 17.90
11 155 6:1 10 22.34 45.35 ± 0.49 23.01
12 155 10:1 10 22.57 59.86 ± 0.30 37.29
13 155 8:1 7 22.08 50.84 ± 0.20 28.76
14 155 8:1 7 22.08 50.71 ± 0.81 28.63
15 155 8:1 7 22.08 50.51 ± 0.78 28.43
aGain of conversion = (Catalyzed conversion) − (Thermal conversion).
Table 2. Effects of isolated variables and their interactions
Variable / Interaction Effect / pp
Temperature 12.70
Molar ratio 1.71
Catalyst 3.30
Temperature:molar ratio −2.07
Temperature:catalyst 5.90
Molar ratio:catalyst 4.09
Temperature:temperature 6.64
Molar ratio:molar ratio −2.81
In order to assess which terms were really significant, the results were submitted to analysis of variance (ANOVA) (Table 3).
p-Values higher than 0.05 are considered insignificant,
both for the model and for its respective terms.27 The
ANOVA revealed that only the term C2 showed no
significance. Therefore, this term was removed prior to selecting an appropriate statistical model. Multiple regression analysis was employed on the data, and between the models as suggested by the software (linear, two factor interaction (2FI), quadratic and cubic). The quadratic model was selected as the most suitable, due to the highest significance order among all available models.28
The model’s final equation, of mean 52.26 and standard deviation 2.50, is: Catalyzed conversion = 1530.007 − 20.075 × T + 23.043 × MR − 34.841 × Cat − 0.103 × T:MR + 0.197 × T:Cat + 0.682 × MR:Cat + 0.0671 × T2 −
0.685 × MR2 (T = temperature (°C); MR = molar ratio
(alcohol:acid); Cat = catalyst (%)).
The coefficient of determination (R2) is the proportion
of variation in a determined response that is attributed to the model instead of random errors. A well-adjusted model must possess an R2 value equal or higher than 0.90. When
R2 is close to 1, this means that the empirical model is
perfectly suitable for the obtained data.28
The R2 value for the response (0.962) was greater than
0.90, indicating the good quality of the obtained models. Adding a variable to the model will always increase the R2 value, regardless of its statistical significance. Thus, a
high R2 value does not necessarily mean that the model to
which it corresponds is suitable for evaluation of response surfaces or for response optimization. Hence, it is better to use an adjusted R2 (adj-R2) of over 0.90 to evaluate
adequacy of a model.28 The obtained adj-R2 value, for
catalyzed conversion, was 0.952. This is very important, since a high adj-R2 value means that insignificant terms
were not included in the model.
The coefficient of variation (CV) describes the extent of data dispersion. As a general rule, a CV must be below 10%. The CV value obtained in this work (4.81%) did not exceed this limit, indicating acceptable levels of precision and reliability in the experiments.
Figure 3 shows the response surface graphs for the factors temperature, MR and percentage of catalyst against the response (catalyzed conversion).
For all surfaces, it is possible to perform a graphic interpretation of the magnitude of the effect regarding each variable. For example, the slope of the surface on the temperature axis is consistent with the fact that this variable is the most relevant to the esterification system, while the slight slope on axis B (MR) denotes the low importance of MR. The greatest response values were observed in the surface regions from 7 to 10% catalyst.
Optimal points for each model were obtained by selecting some desirable parameters, such as smaller quantities of reactants and catalyst, but giving maximum priority for high conversion values. Therefore, the suggested point for catalyzed conversion was 165 °C, MR 6:1 and 5.97% catalyst, with a predicted conversion of 65.42%. This point was validated by tests employing the proposed conditions, and an experimental value of 64.76 ± 1.22 was obtained. Therefore, the model is suitable to predict the influence of reactional parameters regarding esterification of octanoic acid with isopropanol.
Conversion of isopropyl octanoate in function of time
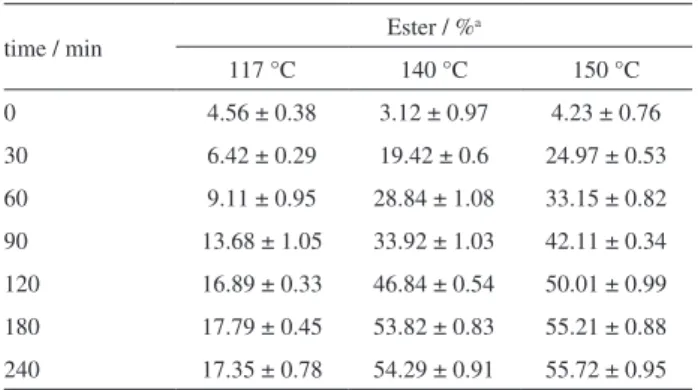
In order to evaluate the time required to reach reaction equilibrium, the synthesis of isopropyl octanoate catalyzed by zinc octanoate was performed as a function of time in three different temperatures, with isopropanol:octanoid acid MR of 8:1, 500 rpm of stirring speed and 7% of catalyst (Table 4). The zero time indicated in Table 4 corresponds to the instant at which the reactor has reached the specified temperature.
At this point, for all temperatures, the percentage of isopropyl octanoate in the reaction medium was not greater than 5%. For the reactions at 140 and 150 °C, it was also noted that the catalyzed conversion shows significant variations from 60 to 90 minutes of reaction time. From 180 minutes of reaction and on, the obtained catalyzed conversions in all cases did not show large statistic differences between themselves, and it can be said that at the time of 240 minutes, the system already had reached the situation of chemical equilibrium. From
Table 3. Analysis of variance
Term Sum of squares F-value p-value
Model 5499.34 97.63 < 0.0001
A (temperature) 3872.48 618.76 < 0.0001
B (molar ratio) 70.28 11.23 0.0019
C (% catalyst) 260.77 41.67 < 0.0001
AB 51.17 8.18 0.0071
AC 417.72 66.74 < 0.0001
BC 200.98 32.11 < 0.0001
A2 488.44 78.04 < 0.0001
B2 87.28 13.95 0.0007
C2 8.52 1.36 0.2512
these experiments, it can be also confirmed the significant effect of temperature during esterification, since at 117 °C no catalyzed conversions greater than 18% were obtained, even after 240 minutes of reaction, while at 140 and 150 °C approximately 19.42 and 24.97% of conversion, respectively, were obtained just after 30 minutes of reaction time. The best catalyzed conversions were achieved at
150 °C, but the ester values from 180 to 240 minutes are not so different from their counterparts at 140 °C.
Tests for reuse of zinc octanoate
From the results of isopropyl octanoate synthesis using zinc octanoate as catalyst, and by observing the catalyst restructuring after the reactions, tests of reuse were carried out to check whether after the first reaction zinc octanoate continued to be active catalytically. The conditions for catalyst reuse tests were: two hours of reaction time, 165 °C, MR 8:1 and 10% catalyst (initially, about 3 g of catalyst was used, and the amounts of the other reagents were adjusted for this catalyst amount).
The values obtained for the first and second reuse of zinc octanoate with these conditions were, respectively, 61.51 and 55.10%. The recovered catalyst masses are 2.78 g from the first reuse and 2.51 g from the second reuse. Therefore, considering the initial catalyst mass of 3 g, the percentages of physical catalyst losses are: 7.25% from the initial experiment to the first reuse, 9.66% from the first to the second reuse and 16.33% from the initial experiment to
Figure 3. Response surface graphs with (A) 4; (B) 7 and (C) 10% of catalyst.
Table 4. Results obtained of isopropyl octanoate conversions in function
of time, using different reaction temperatures
time / min Ester / %
a
117 °C 140 °C 150 °C
0 4.56 ± 0.38 3.12 ± 0.97 4.23 ± 0.76
30 6.42 ± 0.29 19.42 ± 0.6 24.97 ± 0.53
60 9.11 ± 0.95 28.84 ± 1.08 33.15 ± 0.82
90 13.68 ± 1.05 33.92 ± 1.03 42.11 ± 0.34 120 16.89 ± 0.33 46.84 ± 0.54 50.01 ± 0.99
180 17.79 ± 0.45 53.82 ± 0.83 55.21 ± 0.88 240 17.35 ± 0.78 54.29 ± 0.91 55.72 ± 0.95
the second reuse. The results obtained after three reaction cycles, employing the same reuse conditions, showed that zinc octanoate retains its catalytic activity after the first reaction, with a small decrease in the values of conversion in the next two reaction cycles. This behavior can be explained by the fact that not all the mass of the catalyst was recovered, and despite the adjustments for amounts of reagents, the volume of the reactor remained constant, which may have led to a greater amount of isopropanol in the vapor phase, reducing the conversion values. Even so, the progressive loss of catalytic activity from heterogeneous catalysts after consecutive reuses still remains a challenging issue.29
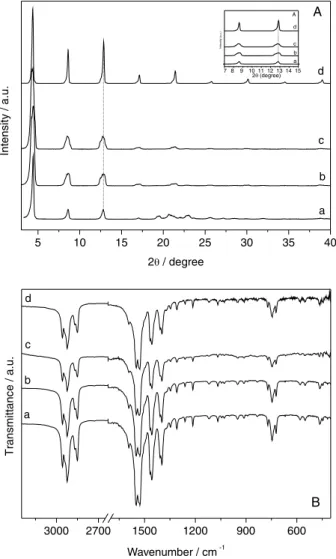
To verify whether there was any structural modification of the catalyst after reactions, we applied the XRD and FTIR techniques (Figure 4).
Through X-ray diffraction patterns of zinc octanoate recovered after the reaction (Figure 4A-b), basal peak broadening and splitting were observed in at least two
peaks. This effect can be attributed mainly to the speed of the reactor cooling, which induces stacking faults during the crystallization (see insert in Figure 4A). This theory is supported by the fact that, in accordance with the FTIR spectra of zinc octanoate after reactions, no energy changes of vibrational modes regarding the constituent groups of its structure were observed when compared to the original, and new functional groups were not detected.
The zinc octanoate recovered after the first use (Figure 4A-b) was subjected to heat treatment at 140 °C and the melted material was slowly cooled to induce better layer packing and minimize the faults. The X-ray diffraction pattern (Figure 4A-c) shows that this objective was partially achieved, since the split basal peaks changed to a broader, but single, diffraction peak. The heat treatment also did not promote energy changes of the vibrational modes regarding zinc octanoate constituent groups when compared to the original substance (Figure 4B-c).
Although diffraction peaks became narrower, indicating better structural order and increase in the size of crystals, the zinc octanoate structure was preserved after two reaction cycles, as indicated both by XRD (Figure 4A-d) and FTIR (Figure 4B-d), demonstrating that the material can be recovered intact and reused.
According to DSC curves (Figure 5), different phase transitions occurred during the heating of zinc octanoate, recovered from the second esterification cycle, up to 155 °C, as well as during its cooling.
For example, after the first heating cycle, two endothermic transitions were noted, assigned to layered crystal-phase I (enantiotropic transitions at 95 °C) and phase I-isotropic liquid (melting at 127 °C).30,31 In the
first cooling, two exothermic transitions were observed.
20 40 60 80 100 120 140 160
-1.6 -1.2 -0.8 -0.4 0.4 0.6 0.8 1.0
(Heating) (Cooling) 2nd
1st
H
e
a
t
fl
o
w
/
(m
W
m
g
-1 )
Temperature / °C Endo
1st
2nd. 3rd
Exo
Figure 5. DSC curves for three zinc octanoate heating/cooling cycles.
5 10 15 20 25 30 35 40
7 8 910 11 12 13 14 15
d
Intensity (a.u.)
2 (degree)
a b c A
d
Intensit
y
/
a
.u
.
2/ degree
a b c
A
3000 2700 1500 1200 900 600
d
T
ra
n
s
m
it
ta
n
c
e
/
a
.u
.
Wavenumber / cm-1 a
b c
B
Figure 4. (A) XRD patterns and (B) FTIR spectra of zinc octanoate,
Besides the observations regarding XRD analysis, it was also possible to see the positive effect of heating on the structural organization of recovered zinc octanoate, by the second and third DSC heating cycles, since these cycles showed three endothermic transitions, associated with a more organized layered structure: layered crystal-phase I (62 °C), phase I-phase II (90 °C) and phase II-isotropic liquid (122 °C). The second and third cooling cycles presented profiles similar to the first cooling cycle, with two endothermic transitions.
Although the catalyst was recovered after each catalytic cycle, it is important to emphasize that the catalytic activity experiments were carried out at temperatures higher to the phase transitions observed in Figure 5, so the zinc octanoate is “melted” in the reaction media, acting approximately in a hydrophobic homogeneous way, just like what occurs for other layered carboxylates.11,25,32
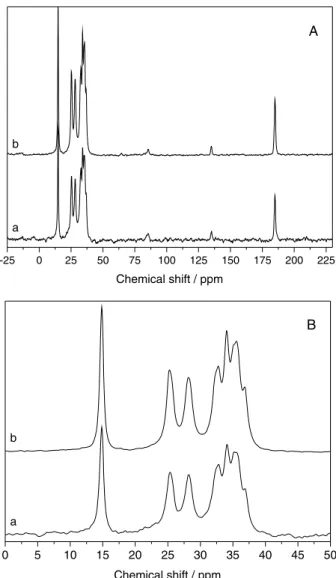
Figures 6A and 6B show the 13C NMR spectra of
synthesized zinc octanoate, as well as the compound which was recovered from esterification reactions and submitted to heat treatment at 140 °C.
Both spectra are consistent with that determined for zinc carboxylates.14,22,23 The chemical shift of the carbonyl
group is assigned to the signal at 184.87 ppm, whereas the observed resonance at 14.84 ppm is attributed to the methyl carbon from the end of the carbon chain. The signals between 24 and 37 ppm correspond to the carbons from the middle of the chain. Therefore, numbering the carbons from the end of the chain until the carbon of the carbonyl gives the following order: C1 (d = 14.84 ppm), C2 (d = 25.35 ppm), C3 (d = 28.22 ppm), C4 (d = 32.79 ppm), C5 (d = 34.11 ppm), C6 (d = 35.21 ppm), C7 (d = 36.85 ppm) and C8 (d = 184.87 ppm).
Even though there were some differences in the packing of the layers, as observed by XRD, no significant differences were noted between the overlapping 13C NMR
spectra of synthesized and recovered/heated zinc octanoate, just like what was determined by FTIR.
Conclusion
Anhydrous zinc octanoate (Zn(C7H15COO)2) was
synthesized and characterized, and showed promising catalytic activity for the synthesis of isopropyl octanoate, especially at 165 °C, isopropanol:octanoic acid molar ratios of 8:1 and 6:1, and with 7 and 10% catalyst. The results corresponding to the center point from the experiment should also be noted, because they presented significant conversion gains.
The analysis of variable interaction effects showed that temperature is the factor that most influences the system,
followed by the synergic effects of temperature:catalyst and molar ratio:catalyst. Even so, according to ANOVA only the term Catalyst2 was not considered a significant term.
All others had some importance to the system.
The ANOVA also allowed obtaining a mathematical model that, expressed through response surfaces, allowed visualizing the information obtained in the analyzing the interaction of the variables. For this model, optimized conditions were obtained for the production of isopropyl octanoate using zinc octanoate as a catalyst: 165 °C, molar ratio 6:1 and 5.97% catalyst.
After the experiments, the catalyst was recovered and the obtained solid presented stacking faults, attributed mainly to imperfect layers’s packing in the crystals. However, when the recovered zinc octanoate was reused, much more organized structures were obtained. Despite the difficult recovery of material, the recovered catalyst maintained its catalytic activity after two reaction cycles,
-25 0 25 50 75 100 125 150 175 200 225
Chemical shift / ppm a
b
A
0 5 10 15 20 25 30 35 40 45 50
Chemical shift / ppm a
b
B
Figure 6.13C NMR spectra of (a) synthesized zinc octanoate and (b) after
demonstrating that zinc octanoate is a promising material for industrial applications.
Supplementary Information
Supplementary information (calculations performed to obtain the basal distances of zinc octanoate) is available free of charge at http://jbcs.sbq.org.br.
Acknowledgments
The present work was executed with support of CNPq, Conselho Nacional de Desenvolvimento Científico e Tecnológico, Brazil, posdoctoral grant Proc.: 502099/2014-3, CAPES and FINEP. We also gratefully acknowledge Lívia Macedo Dutra and Prof Andersson Barisonfor the NMR spectra, Prof Sonia Faria Zawadzki for the DSC measurements, and Angelo Roberto dos Santos Oliveira for the TGA/DSC measurements.
References
1. Claon, P. A.; Akoh, C. C.; Biotechnol. Lett. 1993,15, 1211. 2. Fendri, A.; Louati, H.; Sellami, M.; Gargouri, H.; Smichi,
N.; Zarai, Z.; Aissa, I.; Miled, N.; Gargouri, Y.; Int. J. Biol. Macromol. 2012, 50, 1238.
3. Martins, A. B.; Schein, M. F.; Friedrich, J. L. R.; Ultrason. Sonochem. 2013, 20, 1155.
4. Melo, L. L. M. M.; Pastore, G. M.; Macedo, G. A.; Process Biochem. 2005,40, 3181.
5. Yang, Z.; Zhao, L.; Lei, Z.; Catal. Lett. 2014, 144, 585. 6. Takahashi, K.; Shibagaki, M.; Matsushita, H.; Bull. Chem. Soc.
Jpn.1989, 62, 2353.
7. Solomons, T. W. G.; Fryhle, B. C.; Organic Chemistry, 9th ed.; John Wiley & Sons: New York, 2007.
8. Bouaid, A.; Aparicio.; Martínez, M.; José, J.; Enzyme Microb. Technol. 2007, 41, 533.
9. Deshmane, V. G.; Gogate, P. R.; Pandit, A.; Ultrason. Sonochem.
2009, 16, 345.
10. Cordeiro, C. S.; Silva, F. R.; Wypych, F.; Ramos, L. P.; Quim. Nova2011, 34, 477.
11. Lisboa, F. S.; Gardolinski, J. E. F. C.; Cordeiro, C. S.; Wypych, F.; J. Braz. Chem. Soc.2012, 23, 46.
12. Maruyama, S. A.; Lisboa, F. S.; Ramos, L. P.; Wypych, F.; Quim. Nova2012, 35, 1510.
13. Ferreira, S. L.; Bruns, R. E.; Ferreira, H. S.; Matos, G. D.; David, J. M.; Brandao, G. C.; Silva, E. G.; Portugal, L. A.; Reis, P. S.; Souza, A. S.; Santos, W. N. L.; Anal. Chim. Acta2007, 597, 179.
14. Taylor, R. A.; Ellis, H. A.; Maragh, P. T.; J. Mol. Struct.2009,
921, 118.
15. Sallee, E. M.; Hopper, T. H.; Link, W. E.; Walker, R. O.; Firestone, D.; Mehlenbacher, V. C.; Official Methods and Recommended Practices of the AOCS, 6th ed.; AOCS Press: Illinois, 2010.
16. Aranda, D. A. G.; Santos, R. T. P.; Tapanes, N. C. O.; Ramos, A. L. D.; Antunes, O. A. C.; Catal. Lett. 2008, 122, 20.
17. Khajvand, T.; Chaichi, M. J.; Nazari, O.; Golchoubian, H.;
J. Lumin. 2011, 131, 838.
18. Lacouture, F.; Peultier, J.; François, M.; Steinmetz, J.; Acta Crystallogr., Sect. C: Cryst. Struct. Commun. 2000, 56, 556.
19. Hermans, J. J.; Keune, K.; Van Loon, A.; Corkery, R. W.; Iedema, P. D.; Polyhedron 2014, 81, 335.
20. Noyan, I.; Cohen, J.; Residual Stress: Measurement by Diffraction and Interpretation; Springer Verlag: New York,
1987.
21. Taylor, R. A.; Ellis, H. A.; Spectrochim Acta, Part A2007, 68,
99.
22. Nelson, P. N.; Ellis, H. A.; Taylor, R. A.; J. Mol. Struct. 2007,
986, 10.
23. Nelson, P. N.; Taylor, R. A.; Spectrochim Acta, Part A2015,
138, 800.
24. Barman, S.; Vasudevan, S.; J. Phys. Chem. B2006, 110, 22407.
25. Paiva, E. J. M.; Sterchele, S.; Corazza, M. L.; Murzin, D. Y.; Wypych, F.; Salmi, T.; Fuel2015, 153, 445.
26. Kumar, A.; Easo, S.; Singh, M.; Prasad, B. B.; Polymer1996,
37, 281.
27. Chen, C.; Shao, Y.; Tao, Y.; Wen, H.; LWT -- Food Sci. Technol.
2015, 64, 1263.
28. Neto, B. B.; Scarminio, I. S.; Bruns, R. E.; Como Fazer Experimentos: Pesquisa e Desenvolvimento na Ciência e na Indústria, 1a ed.; Editora da Unicamp: Campinas, 2001. 29. Ferreira, A. B.; Cardoso, A. L.; Silva, M. J.; Catal. Lett. 2013,
143, 1240.
30. Taylor, R. A.; Ellis, H. A.; Liq. Cryst.2009, 36, 257.
31. Taylor, R. A.; Ellis, H. A.; Mol. Cryst. Liq. Cryst. 2011,548, 37.
32. Paiva, E. J. M.; Graeser, V.; Wypych, F.; Corazza, M. L.; Fuel
2014, 117, 125.