Artigo
*e-mail: marigilson.moura@univasf.edu.br #Pós-Graduação em Recursos Naturais do Semiárido
PREPARATION AND CHARACTERIZATION OF NANOEMULSION CONTAINING A NATURAL NAPHTHOQUINONE
Fernando V. S. Rodriguesa,#, Laerte S. Dinizb, Rosa M. G. Sousab, Thalita D. Honoratob, Daniele O. Simãoa,#, Cleônia R.
M. Araújob, Talita M. Gonçalvesb, Larissa A. Rolima,b,#, Patrícia L. Gotoc, Antonio C. Tedescoc and Marigilson P.
Siqueira-Mouraa,b,*,#
aUniversidade Federal do Vale do São Francisco, 56300-000 Petrolina – PE, Brasil
bColegiado Acadêmico de Ciências Farmacêuticas, Universidade Federal do Vale do São Francisco, 56300-000 Petrolina – PE, Brasil cDepartamento de Química, Universidade de São Paulo, 14040-901 Ribeirão Preto – SP, Brasil
Recebido em 02/03/2018; aceito em 10/05/2018; publicado na web em 07/06/2018
Natural naphthoquinones such as lapachol (Lp) have demonstrated promising biological activities. However, these quinones present low systemic biodisponibility due to its poor aqueous solubility. To overcome this problem, nanoemulsions (NE) formed by oily core are able to incorporate hydrophobic molecules thus enabling them to be dispersed into an aqueous phase. The present study reports the development, characterization, and physical stability of NE containing lapachol. NE formulations (F1, F2, F3, F4, and F2-Lp) were prepared using emulsion phase inversion (EPI) method and characterized in relation to droplet size, size distribution (PDI), zeta potential, and physical stability. The formulation chosen to incorporate lapachol (F2-Lp) showed droplet size in nanometric scale with homogeneous size distribution (PDI < 0.2) and negative zeta potential (about −30 mV). In addition, good physical stability of F2 and F2-Lp was demonstrated using analytical centrifugation with photometric detection where the light transmission profiles did not change throughout the dispersions. Nanoemulsion containing lapachol presented a strong reddish aspect; however, the incorporation of this naphthoquinone did not alter the main physicochemical parameters of NE formulation. The in vitro release study demonstrated a sustained release profile from NE with about 60% of lapachol released within 54 h.
Keywords: natural naphthoquinone; lapachol; nanoemulsion; EPI method.
INTRODUCTION
Quinones are ubiquitous compounds in nature and naphthoquinones are considered as an important class of bioactive substances normally extracted from plants of the Bignoniaceae family.1,2 Lapachol is the most abundant quinone compound commonly isolated from the Ipe family trees (Tabebuia spp.) found in South America .3,4 Lapachol and its α- and β-lapachone derivatives have demonstrated different biological activities such as antibacterial, antifungal, antiplasmodial, trypanocidal, anti-inflammatory, anti-angiogenic, and anticancer.2,3,5-7 However, it was widely reported that after oral administration of lapachol in the Phase I clinical trials, this naphthoquinone did not show therapeutic effect, even at high doses unsatisfactory blood levels were obtained.2,3,5
In order to overcome this limitation, several drug delivery systems have been developed for improvement of oral absorption and bioavailability of natural compounds including nanostructured formulations.8,9 The nano-emulsifying systems formed by oil, water, and surfactants have been used to incorporate and deliver many drugs. Among these systems, microemulsions and nanoemulsions are the two main emulsified carriers formed by nano-droplets. Microemulsion is a thermodynamically stable dispersion of at least two immiscible liquids while nanoemulsion is a non-equilibrium system (metastable) but a kinetically stable colloidal dispersion of immiscible liquid phases.10-15 Both nano-emulsifying systems may be a dispersion of oil-in-water (O/W) or water-in-oil (W/O) depending on whether the oil (O/W) or water (W/O) phase is dispersed as fine globules in formulation.11-13
Nanoemulsions were also termed by mini-emulsion, submicron emulsion, translucent emulsions, and ultrafine emulsion. The internal
or dispersed phase of nanoemulsion is composed of very small droplets with sizes lower than 300 nm.10,13,14 By reason of their small droplet size, nanoemulsion appearance may differ significantly from translucent dispersions (r < 50 nm) to those milky opaque. Another phenomenon important with respect to small droplets from nanoemulsion is the substantial increase of gravitational stability provided for this type of colloidal dispersion compared to conventional emulsions or coarse dispersions. Thereby, when droplet radius is less than 100 nm the Brownian movement dominates the gravitational forces preventing development of physical instability such as creaming or sedimentation, as well as globule flocculation on storage.11,15 In addition, lipophilic drugs contained into small oil droplets (r < 100 nm) have its bioavailability enhanced due to significant increase of Laplace pressure and solute local concentration in the water phase very near to globule surface.11
In this sense, the main aim of this study was to develop nanoemulsion formulation containing a natural naphthoquinone (lapachol). The designed colloidal formulations were obtained using a low-energy preparation method, i.e., emulsion phase inversion method (EPI method), and the influence of oil and surfactant types was evaluated on average diameter of droplets, size distribution, and zeta potential. Furthermore, lapachol-loaded nanoemulsion was assessed in relation to its physical stability and in vitro release of this naphtoquinone.
EXPERIMENTAL
Materials
(MCT), POE-40 hydrogenated castor oil (HCO-40), and sorbitan isostearate (SIS) were kindly supplied from Croda do Brasil Ltda (Campinas, SP, Brazil). Lapachol (Lp) was provided by Research Group of Chemistry Applied to Pharmacy from UNIVASF.
Nanoemulsion preparation
Oil-in-water (O/W) nanoemulsions (NE) were prepared using the emulsion phase inversion method.16 Both the oil and aqueous phases were separately prepared, organic phase was obtained by mixing surfactants and oils under moderate stirring while aqueous phase consisted of phosphate buffer solution (PBS pH 7.4). Nanoemulsions were prepared by slowly adding aqueous phase to the organic phase and the resulting systems held in continuous stirring. Colloidal dispersions were formed of oils (MCT and MO), surfactants (HCO-40, SML-20, SIS, and SMO), and phosphate buffer solution as can be seen in Table 1. Organic phase concentration and surfactant-to-oil weight ratio were kept constant at 10.0 wt% and 1.0, respectively. Nanoemulsions were optimized by means of a formulation study in which the influence of the surfactant pairs (final HLB 12) and oil type (Table 1) were assessed on the main physicochemical properties of emulsified droplet. All formulations were prepared in triplicate (n=12) and stored at 4 ± 2° C. NE loaded with lapachol (F2-Lp) were prepared by adding different amounts (0.1, 0.6, 1.0, and 1.25 mg mL-1) of this naphthoquinone in oily phase and using same procedure in order to prepare unloaded F2 nanoemulsion.
Particle size and polydispersity index analysis
Hydrodynamic diameter of the nanoemulsion droplets and polydispersity index (PdI) of the formulations were determined by photon correlation spectroscopy (PCS) at 25 °C and scattering angle of 173° (Zetasizer® Nano ZS, Malvern PCS Instruments, UK). Samples were obtained by diluting 20 µL with 2 mL ultrapure water. The reported values are the average ±SEM of three different batches of each colloidal dispersion.
Zeta potential measurement
Zeta (ζ) potential of the nanoemulsions was measured by electrophoretic mobility using a Zetasizer® Nano ZS apparatus (Malvern PCS Instruments, UK). The Smoluchowski model was used to estimate ζ potential from electrophoretic mobility. The analyses were conducted at 25 °C, and the samples were appropriately diluted (1/100) with ultrapurified water and the pH measured. Values reported are the average ±SEM of three different batches of each colloidal dispersion.
Stability studies
Stability studies were performed by using the analytical centrifugation method with photometric detection at 880 nm (LUMiSizer® 611, LUM GmbH, Germany). The samples of
unloaded nanoemulsions or nanoemulsion containing lapachol were incorporated into polycarbonate cell and equilibrated to 25 °C before the analysis. Measurements were carried out at 3,500 rpm for 3.5 h resulting in accelerated migration of the dispersed droplets and integration of transmission profiles within a selected region of the holding cell allowed to get information about emulsion stability for six months.
Lapachol quantification in nanoemulsion and incorporation efficiency
Lapachol concentration was determined using a UV spectrophotometric method. In order to establish linearity of the proposed method three calibration curves were constructed at eight concentrations levels within the range of 2.0–9.0 µg mL−1 (n = 24). Least square regression analysis was done for the data (y = 0.1337x + 0.0304, r = 0.9986) and for all spectrophotometric analyses the Beer’s law was obeyed. Lapachol amount in the nanoemulsions was determined by solubilizing a known amount of formulation in ethanol. Lapachol concentration in this ethanolic solution was determined by UV spectroscopy conducted on an Even UV/VIS spectrophotometer (Ionlab, Paraná, Brazil) with detection at 280 nm. Free lapachol content was determined by measuring the non-incorporated drug present in a clear ultrafiltrate obtained through separation of the aqueous phase using an ultrafiltration/ ultracentrifugation procedure (Microcon Ultracel YM-100, Millipore, Ireland) at 10,000 rpm for 1 h, at 4 °C (Eppendorf, Centrifuge 5430 R, Hamburg, Germany). All analyses were performed in triplicate and the incorporation efficiency (IE%) of lapachol into nanoemulsion was calculated from following Equation 1:
IE (%) = [(TLC – FLC) ÷ ThLC] × 100 (1)
where TLC is the total lapachol concentration; FLC, free lapachol concentration; ThLC, theoretical lapachol concentration.
In vitro release of lapachol from nanoemulsion
In vitro lapachol release experiments were carried out using the dialysis technique. An aliquot of F2-Lp formulation or free lapachol (hydroalcoholic dispersion 10% v/v) was placed inside a dialysis bag (cellulose membrane, molecular weight cut-off 14,000, Sigma-Aldrich Co., St. Louis, MO), sealed, and immersed in a vessel containing 150 mL of 10 mM phosphate buffer solution (pH 7.4). The releasing system was maintained at 37 ± 1 ºC, under magnetic stirring (100 rpm). One-milliliter aliquots were taken out of the dissolution medium at pre-determined time intervals, replaced with fresh buffer solution (PBS), and analyzed for lapachol release by spectrophotometry UV at 280 nm. The release profile of lapachol was expressed as cumulative amount of released lapachol (average ±SEM) and plotted versus time. The experiments were carried out in triplicate for both samples.
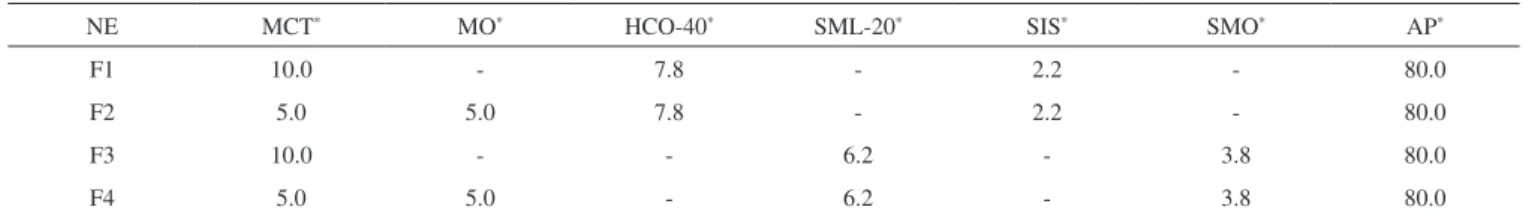
Table 1. Composition (wt%) of unloaded nanoemulsion formulations (NE) prepared by emulsion phase inversion method
NE MCT* MO* HCO-40* SML-20* SIS* SMO* AP*
F1 10.0 - 7.8 - 2.2 - 80.0
F2 5.0 5.0 7.8 - 2.2 - 80.0
F3 10.0 - - 6.2 - 3.8 80.0
F4 5.0 5.0 - 6.2 - 3.8 80.0
Statistical analysis
All the experiments were performed in triplicate and data are expressed as the average value ±SEM. Statistical analysis was performed by One-way ANOVA followed by Tukey’s pairwise comparisons using the Prism GraphPad Software. The statistical significance was set at p < 0.05.
RESULTS AND DISCUSSION
Preparation of nanoemulsion containing lapachol and characterization
Colloidal drug delivery systems based on nanoemulsions are used to carrier lipophilic bioactive molecules and disperse them within aqueous media.10-12 Lapachol is a natural naphthoquinone that has limited water- solubility and low bioavailability,3,5 and so it should be incorporated into the oily droplets from O/W emulsion to enhance its pharmacokinetic profile. In light of this possibility, four different unloaded nanoemulsion formulations (F1-F4) were formerly prepared and their main physicochemical parameters analyzed (Table 2). Emulsion phase inversion or catastrophic phase inversion was used as a low-energy method to prepare nanoemulsions, this method involves adding an aqueous phase in a mixture of oils and surfactants at constant temperature. Initially, the influence of oil and surfactant types was investigated on the droplet size, particle size distribution (PdI), and zeta potential of dispersed oil phase.
Both droplet size and PdI were highly dependent on the surfactant and cosurfactant present in the colloidal formulations. The smallest droplet sizes (< 100 nm) were obtained in the formulations prepared using HCO-40 and SIS surfactants compared to that one prepared with SML-20 and SMO (p < 0.05). In addition, F1 and F2 formulations demonstrated a narrow droplet size distribution (PdI < 0.2) whereas F3 and F4 formulations had the widest size distributions (PdI ≥ 0.4) comprising of a bimodal distribution with larger and more polydisperse droplets (Figure 1). On the other hand, oil type (MCT and MO) did not demonstrate influence on droplet size and PdI (p < 0.05) for all NE formulations. The appearance of NE formulations varied greatly from translucent or slightly turbid to opaque and F2 formulation was the most translucence preparation with strong bluish reflection (Figure 2). For all developed nanoemulsion formulations, highly negative surface charges were observed (Table 2). These negative zeta potential values contribute for storage stability of nanoemulsion since the repulsive forces exceed attractive forces among droplets and such droplet–droplet repulsion prevents the coagulation and/or coalescence of dispersed phase of emulsions.11
The mechanism of nanoemulsion development using EPI method is based on progressive (continuous) water addition to organic phase with initial formation of W/O emulsion and as more water is added, a multiple emulsion (O/W/O) is formed. With more water addition to system, a catastrophic phase inversion takes place
which results in O/W dispersion containing small oil droplets as internal.16 The capacity of oil solubilization in emulsified preparations can be increased by using a combination of different surfactants. Furthermore, type of surfactant has been considered as a determining factor to achieve fine oil dispersion using a low-energy emulsification method. With respect to surfactants, these amphiphilic molecules can affect formation of small droplets due to their molecular geometry and consequent critical packing.16-18 Packing parameter of a surfactant
Figure 1. Particle size distributions of the unloaded nanoemulsions (F1-F4)
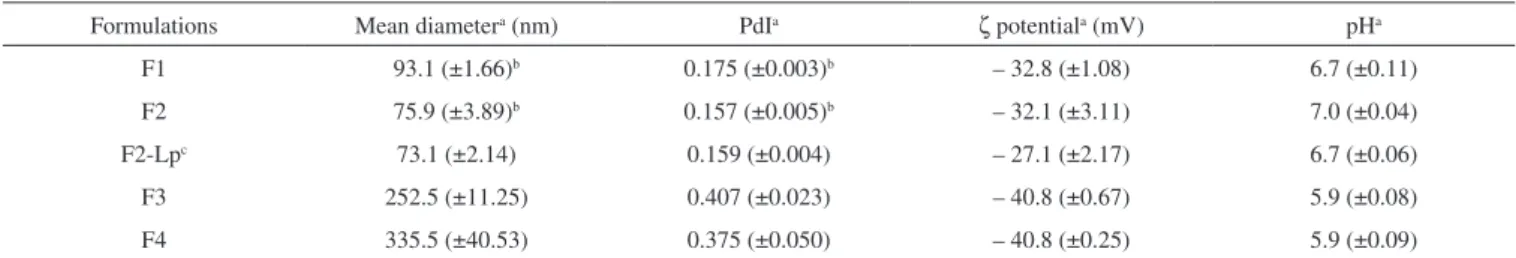
Table 2. Results from physicochemical characterization of unloaded nanoemulsions (F1-F4) and lapachol-loaded nanoemulsion (F2-Lp)
Formulations Mean diametera (nm) PdIa ζ potentiala (mV) pHa
F1 93.1 (±1.66)b 0.175 (±0.003)b – 32.8 (±1.08) 6.7 (±0.11)
F2 75.9 (±3.89)b 0.157 (±0.005)b – 32.1 (±3.11) 7.0 (±0.04)
F2-Lpc 73.1 (±2.14) 0.159 (±0.004) – 27.1 (±2.17) 6.7 (±0.06)
F3 252.5 (±11.25) 0.407 (±0.023) – 40.8 (±0.67) 5.9 (±0.08)
F4 335.5 (±40.53) 0.375 (±0.050) – 40.8 (±0.25) 5.9 (±0.09)
is related to its molecular geometry and reflects the ratio between the tail group area (hydrophobic portion) and the head group area (hydrophilic portion). Such parameter impacts the formation of surfactant monolayers at oil-water interface from droplets of O/W emulsion since a given surfactant tends to have an optimum curvature. For instance, the formation of O/W emulsion is favored when surfactants with p < 1 are used and surfactant monolayers adopting a positive curvature, i.e. with hydrophilic head groups point outward. Therefore, the results obtained using HCO-40 and SIS in the formulations could be explained due to the compact monolayer formation of these surfactants at oil-water boundaries with low interfacial tension creating a bicontinous microemulsion which breaks down in very fine oil droplets.12,19
In view of these results, F2 formulation was chosen to incorporate different lapachol concentrations. Lapachol was added in the organic phase until complete dissolution following aqueous phase addition under continuous stirring. Increasing concentrations of lapachol (0.1 to 1.25 mg mL-1) into F2 formulation were assessed in relation to solubilization of this quinone in oily phase. After preparation of nanoemulsions containing lapachol, only at the highest concentration
of this naphtoquinone (1.25 mg mL-1) were observed yellow crystals at the bottom of glass container as a result of lapachol expulsion from oily core, therefore, lapachol concentration at 1.0 mg mL-1 in nanoemulsion was used in further experiments in this study.
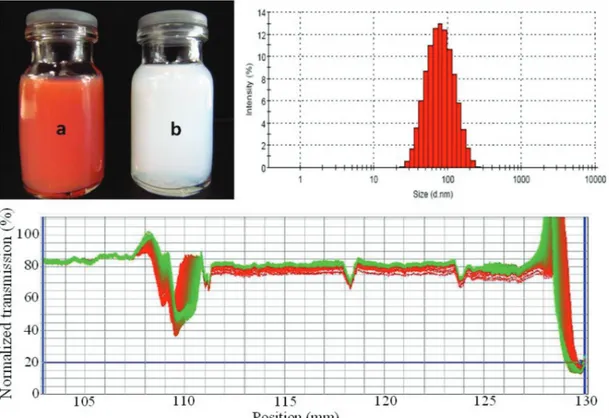
A nanoemulsion formulation with strong reddish-orange color was obtained after lapachol adding to F2 formulation (Figure 3). There was no significant difference between F2 and F2-Lp formulations (p > 0.05) in relation to size, PdI, and zeta potential values. Thus the incorporation of lapachol in nanoemulsion did not alter the main physicochemical parameters of this colloidal dispersion as can be seen in Table 2. Furthermore, physical stability of F2-Lp formulation was not affected by incorporation of naphtoquinone and its stability profile remained similar to that one obtained for unloaded F2 formulation in analytical centrifugation assay (Figure 3), therefore for both samples (F2 and F2-Lp) light transmission profiles measured did not change during all analysis time.
Stability study
Accelerated stability study was carried out for NE formulations using analytical centrifugation with photometric detection. The transmission profiles of NE formulations are shown in Figure 3 for formulation containing lapachol and in Figure 4 for unloaded NE. This study is based on rate of droplet separation, i.e. flocculation and creaming formation, during high centrifugal speeds and transmitted near infrared intensity measurements from samples. The kinetics of the droplet separation process is characterized by shape and progression of light transmission profiles measured as a function of time and position over the entire sample length. The variation of light transmission throughout samples reflects phase separation of dispersion; therefore, an increasing of transmission means droplet migration behavior.20,21 As can be observed in Figure 4, there were significant differences in light transmission profiles among NE formulations. For obtained profiles of unloaded F1 and F2
Figure 3. Photoimages of (a) NE containing lapachol at 1 mg mL-1 (F2-Lp) and (b) unloaded F2 NE. Results from F2-Lp formulation of droplet size distribution (top right) and analytic centrifugation with LUMiSizer® (bottom image)
formulations, there was no significant difference in transmission and the light transmission profiles for F2 formulation did not change with 80 transmission% throughout the dispersion during all analysis time. On the other hand, unloaded F3 and F4 formulations demonstrated strong variation of light transmission (Figure 4) between the first and last profiles. Initially, F3 and F4 presented about 5 transmission% (first red profiles) throughout the formulations and quickly this transmission reached values higher than 85%. These results indicate that both F3 and F4 formulations were unstable dispersions characterized by high flotation velocity with a significant upward moving of oil droplets which results creaming formation. The better physical stability of F1 and F2 formulations could be mainly explained due to gravitational stability of nanoemulsions, i.e. smaller droplets (< 90 nm) in these dispersions may be under influence of Brownian motion only.11 After that the most stable dispersion was considered F2 formulation.
Figure 4. Normalized NIR transmission profiles obtained with unloaded NE (F1-F4) by forced stability analysis during analytical centrifugation with LUMiSizer®.
The first and the last registered profiles are shown in red and in green, respectively
Quantification of lapachol and in vitro release from nanoemulsion
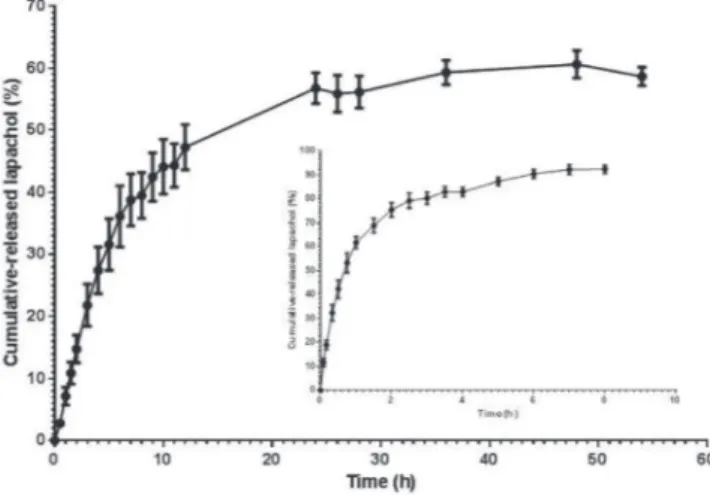
only a slow release of lapachol was observed in PBS (pH 7.4) with less than 50% released in the first 12 h. The kinetic profile of lapachol from F2-Lp showed burst effect of 38.7% (±7.26%) after the first 7 h of experiment. At the end of 54 h of experiment, only 58.7% (±2.54%) of lapcahol were released from F2-Lp. These results are in agreement with Cavalcanti et al.22 which demonstrated that only 60% of β-lapachone were released from liposomes after 24 h of experiment and about 80% of free β-lapachone were released in the first 3 h.
CONCLUSIONS
We have successfully incorporated lapachol into O/W nanoemulsion. Nanoemulsion formulations were prepared by emulsion phase inversion method and the most stable formulation was achieved using HCO-40 and SIS surfactants. The lapachol nanoemulsion presented droplet size of about 70 nm, with homogeneous size distribution (PdI < 0.2), and negative zeta potential. Good physical stability of nanoemulsion containing lapachol was confirmed by analytic centrifugation in which the light transmission did not change throughout colloidal dispersion. In addition, in vitro release profile of lapachol from nanoemulsion demonstrated a sustained release of this quinone. Therefore, submicron emulsions could be considered promising delivery systems applied to drugs of naturally occurring.
ACKNOWLEDGMENT
F.V.S. Rodrigues (IBPG-0968-4.03/14) and L.S. Diniz (BIC-1693-4.03/14 and BIC-1873-4.03/15) would like to thank FACEPE for the individual scholarship. R.M.G. Sousa (PIBIC 155053/2014-0) would like to thank CNPq for the individual scholarship.
REFERENCES
1. Almeida, J. M. S.; Balbin-Tamayo, A. I.; Toloza, C. A. T.; Figueira, I. D. O.; Pérez-Gramatges, A.; Silva, A. R.; Aucélio, R. Q.; Microchem. J.
2017, 133, 629.
2. Sunassee, S. N.; Veale, C. G. L.; Shunmoogam-Gounden, N.; Osoniyi, O.; Hendricks, D. T.; Caira, M. R.; Mare, J.-A.; Edkins, A. L.; Pinto, A. V.; Silva Júnior, E. N.; Davies-Coleman, M. T.; Eur. J. Med. Chem.
2013, 62, 98.
3. Gómez Castellanos, J. R.; Prieto, J. M.; Heinrich, M.; J. Ethnopharmacol. 2009, 121, 1.
4. Delarmelina, M.; Ferreira, G. B.; Ferreira, V. F.; Carneiro, J. W. M.; Vib. Spectrosc. 2016, 86, 311.
5. Hussain, H.; Krohn, K.; Ahmad, V. U.; Miana, G. A.; Green, I. R.;
ARKIVOC 2007, ii, 145.
6. Ríos-Luci, C.; Bonifazi, E. L.; León, L. G.; Montero, J. C.; Burton, G.; Pandiella, A.; Misico, R. I.; Padrón, J. M.; Eur. J. Med. Chem. 2012, 53, 264.
7. Salas, C.; Tapia, R. A.; Ciudad, K.; Armstrong, V.; Orellana, M.; Kemmerling, U.; Ferreira, J.; Maya, J. D.; Morello, A.; Bioorg. Med. Chem. 2008, 16, 668.
8. Bonifácio, B. V.; Silva, P. B.; Ramos, M. A. S.; Negri, K. M. S.; Bauab, T. M.; Chorilli, M.; Int. J. Nanomed. 2014, 9, 1.
9. Liu, Y.; Feng, N.; Adv. Colloid Interface Sci. 2015, 221, 60. 10. Anton, N.; Vandamme, T. F.; Pharm. Res. 2011, 28, 978. 11. McClements, D. J.; Soft Matter. 2012, 8, 1719.
12. Montenegro, L.; Lai, F.; Offerta, A.; Sarpietro, M. G.; Micicchè, L.; Maccioni, A. M.; Valenti, D.; Fadda, A. M.; J. Drug Deliv. Sci. Technol.
2016, 32, 100.
13. Solans, C.; Izquierdo, P.; Nolla, J.; Azemar, N.; Garcia-Celma, M. J.;
Colloid Interface Sci. 2005, 10, 102.
14. Solans, C.; Solé, I.; Curr. Opin. Colloid Interface Sci. 2012, 17, 246. 15. Tadros, T.; Izquierdo, P.; Esquena, J.; Solans, C.; Adv. Colloid Interface
Sci. 2004, 108–109, 303.
16. Ostertag, F.; Weiss, J.; McClements, D. J.; J. Colloid Interface Sci. 2012,
388, 95.
17. Mayer, S.; Weiss, J.; McClements, D. J.; J. Colloid Interface Sci. 2013,
402, 122.
18. Rao, J.; McClements, D. J.; J. Agric. Food Chem. 2010, 58, 7059. 19. Rao, J.; McClements, D. J.; Food Hydrocolloids 2012, 26, 268. 20. Chiu, H.-T.; Chang, C.-Y.; Chiang, T.-Y.; Kuo, M.-T.; Wang, Y.-H.; J.
Polym. Res. 2011, 18, 1587.
21. Sobisch, T.; Lerche, D.; Colloids Surf., A 2008, 331, 114.
22. Cavalcanti, I. M. F.; Mendonça, E. A. M.; Lira, M. C. B.; Honrato, S. B.; Camara, C. A.; Amorim, R. V. S.; Mendes Filho, J.; Rabello, M. M.; Hernandes, M. Z.; Ayala, A. P.; Santos-Magalhães, N. S.; Eur. J. Pharm. Sci. 2011, 44, 332.
Figure 5. In vitro release profile of lapachol from F2-Lp formulation prepared using EPI method. Result shown in the inset represents in vitro release of free lapachol from hydroalcoholic dispersion. All results were reported as average ±SEM (n = 3)