Artigo
*e-mail: [email protected]
ASSOCIATION OF BRANCHED POLYETHYLENE IMINE WITH SURFACTANTS IN AQUEOUS SOLUTION
Ismael C. Bellettinia,d,*, Renato Eisingb, Arlindo C. Felippec, Josiel B. Domingosd, Edson Minattid and Vanderlei G. Machadod aUniversidade Federal de Santa Catarina, Campus Blumenau, 89065–300 Blumenau – SC, Brasil
bUniversidade Tecnológica Federal do Paraná, Campus Toledo, 85902–490 Toledo – PR, Brasil cUniversidade Federal da Fronteira Sul, Campus Chapecó, 89802–265 Chapecó – SC, Brasil
dDepartamento de Química, Universidade Federal de Santa Catarina, 88040–900 Florianópolis – SC, Brasil
Recebido em 16/01/2015; aceito em 06/04/2015; publicado na web em 21/05/2015
Three polymer-surfactant systems comprised of branched polyethylene imine (PEI) with an anionic surfactant (sodium dodecylsulfate; SDS), a cationic surfactant (tetradecyltrimethylammonium bromide; TTAB), and a zwitterionic surfactant (N-tetradecyl-N,N -dimethyl-3-ammonio-1-propanesulfonate; SB3-14) were studied based on the properties of surface tension, pyrene fluorescence emission, dynamic light scattering, pH, and zeta potential measurements. The critical aggregation concentration (cac) and polymer saturation point (psp) were determined for all three systems. The effect of these surfactants on the physico-chemical characteristics (diameter and surface charge) of the complexes formed was determined. Polymer-surfactant interactions occurred in all of the systems studied, with the strongest interactions, electrostatic in nature, occurring in the SDS-PEI system. After the neutralization of the polymer charges with the addition of the surfactant, the hydrophobic effect started to control the interlacing of the polymer chains. For the PEI-TTAB system, a very dense film was formed at surfactant concentrations above 2.0 mmol L−1. In this case, the bromide
counter-ion interacted with both the positively-charged PEI and the head of the surfactant, which is responsible for the formatcounter-ion of double layer coordination complexes. For the system composed of PEI and the zwitterionic surfactant, less cooperative associations occurred in comparison with the other systems.
Keywords: polymer-surfactant interactions; pyrene fluorescence; polyelectrolytes.
INTRODUCTION
Branched polyethylene imine (PEI; Scheme 1) is a polyelectrolyte with variable molar weight, being of great importance due to its large number of applications.1,2 This polymer is of particular interest due to its use for the nanoparticle stabilization in the development of catalytic systems3 and because of its ability to bind nucleic acids, acting in the transfection of genes.4 In addition, PEI has in its structure many amino groups, which allow the design of different modified polymers with the potential to be applied in different fields of knowledge. Recent examples of the applications of PEI include its use in gene therapy,5,6 in the design of nanoparticles in aqueous dispersions,7,8 and in the encapsulation of drugs.9
In aqueous solution, polymer–surfactant mixtures form associated thermodynamically stable complexes with physicochemical proper-ties which differ from those observed in micellar media.10-12 The as-sociation of a polyelectrolyte with an oppositely charged surfactant is generally accepted to involve an anion exchange process, where the electrostatic attraction is enhanced by the cooperative aggregation of surfactant molecules. Once all charges in the polymer chain are
neutralized, the hydrophobic effect begins to control the association, which induces restructuring of the polymer chain due to the formation of complexes with the surfactant.13
Studies on polymer–surfactant complexes show that surfactants can cooperatively interact with the polymer from the critical aggrega-tion concentraaggrega-tion (cac), forming micellar aggregates along the poly-mer. This is the basis for almost all systems that consist of polymers and ionic surfactants.10,14 The values of the cac are lower than those for the critical micelle concentration (cmc) of the surfactant. In these various polymer–surfactant systems,10,15-18 the cac is dependent on the electrostatic forces, the structural characteristics of the charged groups and other factors, such as the flexibility of the polymer chain and of the counter–ions.16,19 At a certain concentration of surfactant, the so–called polymer saturation point (psp), the surfactant no longer forms complexes with the polymer, this concentration being directly proportional to the polymer concentration. Above the psp, regular micelles of surfactant are formed in equilibrium with the polymer– surfactant complexes.20
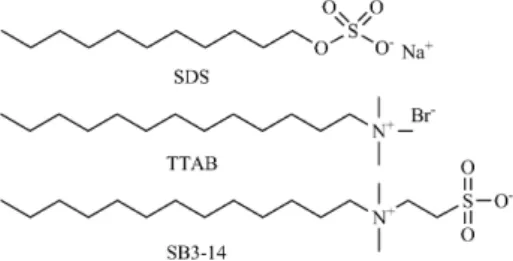
In this paper, the properties of aqueous systems comprised of PEI and a surfactant were investigated by way of surface tension, pyrene fluorescence, dynamic light scattering (DLS), pH, and zeta (ζ) potential measurements. Three surfactants were used (Scheme 2): an anionic surfactant (sodium dodecylsulfate; SDS), a cationic surfactant (tetradecyltrimethylammonium bromide; TTAB), and a zwitterionic surfactant (N–tetradecyl–N,N –dimethyl–3–ammonio–1–propane-sulfonate; SB3–14). Experimental data were used to determine the aggregation parameters for each polymer–surfactant system.
EXPERIMENTAL
Materials and methods
The surfactants (99% pure) and the PEI (Mw 25,000 g mol–1)
were purchased from Sigma–Aldrich. The primary/secondary/tertiary amine ratios for these polymers were 1:2:1, which corresponds to a branch every 3-3.5 nitrogens. Pyrene (99%, Sigma-Aldrich) was purified through recrystallization from methanol. Aqueous stock solutions of PEI were prepared under magnetic stirring for at least 12 h, deionized water, obtained through previous distillation followed by purification employing a Millipore Milli–Q system, was used in all measurements. These stock solutions were used to prepare those containing SDS, SB3–14, and TTAB, in order to maintain a constant PEI concentration (c(PEI) = 2.0 mg mL–1). This concentration was used because it is below the overlap concentration.18
Surface tension experiments
The surface tension experimental data were collected at 25.0 ± 0.1 °C on a Kruss K8 GMBH interfacial tensiometer, equipped with a Pt–Ir–20 ring. All polymer–surfactant solutions were prepared at least two hours before use, to each concentration surfactant.
Fluorescence measurements
Fluorescence emission spectra were made on a Hitachi F4500 spectrofluorimeter equipped with a thermostated cell holder set at 25.0 ± 0.1°C. An aqueous pyrene solution (1.0×10⁻⁶ mol L–1) was used to prepare the surfactant, PEI, and surfactant–PEI solutions. The slits of the excitation and emission were set at 2.5 nm and all the solutions were measured using a quartz cell with excitation wavelength at 336 nm. The intensities of the first emission band at 372.8 nm and of the third emission band at 384.0 nm were used to calculate the I1/I3 ratio.17,21-26
pH measurements
The pH measurements were performed at 25.0 ± 0.1 °C using a Beckman pH meter model φ 71, with a combined glass electrode. The pH meter was previously calibrated with standard solutions with pH = 7.0 and pH = 10.0.
Zeta potential measurements
The ζ values were obtained for the solutions containing SDS–PEI, TTAB–PEI, and SB3–14–PEI. The solutions were prepared from an aqueous solution containing 2.0 mg mL–1 of PEI, in order to keep the PEI concentration constant, and to allow the addition of surfactant to increase its concentration. The ζ measurements were performed with a Malvern Zetasizer Nano ZS system equipped with a 4.0 mW He–Ne laser (632.8 nm) using folded capillary cells with electrodes.
DLS studies
DLS measurements were taken at a fixed angle of 90° on a light scattering spectrometer (Brokhaven Instruments Corporation,
BI–200 goniometer, digital correlator BI–9000 AT, with He–Ne laser, wavelength 632.8 nm) at 25.0 ± 0.1°C. The solutions contain-ing SDS–PEI, TTAB–PEI, and SB3–14–PEI were prepared from an aqueous solution containing 2.0 mg mL–1 of PEI in order to keep the PEI concentration constant and to allow the addition of surfactant to increase concentration. The samples were filtered through cellulose acetate membranes (0.45 µm) and placed in cylindrical cuvettes.
RESULTS AND DISCUSSION
Surface tension measurements
Figure 1 shows the variation in the surface tension as a function of the SDS concentration (c(SDS)) in deionized water, for solutions of pure SDS and SDS–PEI. The plotting of data obtained for pure SDS shows a discontinuity at 38.2 mN m–1 with a cmc value of 7.0 mmol L–1, which is consistent with reports in the literature.14,27 However, a high surface–activity was observed for the SDS–PEI system, because the surface tension decreased sharply at lower surfactant concentrations in comparison with the system without PEI. A plateau occurred at 35.9 mN m–1, this being attributed to the cac at 0.17 mmol L–1, and this behavior is consistent with a densely packed interface.27 Further addition of surfactant leads to lower sur-face tension values compared with those observed for pure SDS. In addition, when the cmc value is reached the surface tension of the SDS–PEI system increases, reaching values that are similar to the micellar SDS. This occurs because of the possible migration of some surfactant ions, initially connected to the PEI chain at the air–liquid interface, into the solution during the micellization process.27 When the surface tension reaches values similar to those obtained for pure SDS solutions, above the cmc, the polymer is saturated and the psp occurs at 37.9 mN m–1 for c(SDS) = 24.9 mmol L–1.
Figure 2 shows the plots for the surface tension data in water as a function of the TTAB concentration (c(TTAB)) for solutions of TTAB and TTAB–PEI. For the solutions of TTAB, the plot exhibits a classical profile28 with a decrease in the air–liquid interface as-sociated with increasing surfactant concentration, until the cmc is reached (this being at 3.30 mmol L–1 of TTAB for a surface tension stabilized at 38.5 mN m–1). For solutions with PEI, the profile changed and with only 0.03 mmol L–1 of TTAB a plateau occurred, which is related to the cac for the polymer–surfactant system. On increasing the surfactant concentration the surface tension decreases again, sta-bilizing at 44.2 mN m–1 with 0.85 mmol L–1 of TTAB. The formation of a very dense film on the solution surface hindered the taking of
Scheme 2. Molecular structures of the surfactants
1E-3 0,01 0,1 1 10
35 40 45 50 55 60 65 70
c(SDS) (mmol L )-1 cac
cmc psp
Surface tension (mN
m
)
-1
measurements at c(TTAB) > 2.0 mmol L–1. Similar behavior has been observed by other authors in studies carried out using mixtures of PEI and cationic surfactants,29-31 this being attributed to the formation of mesostructured thin films at the air–liquid interface. In some cases this formation can be detected by the naked–eye at concentrations close near to the cmc of the surfactant.29,30 At the interface, highly ordered rod–like aggregates have been observed while in the bulk solution el-liptic aggregates have been detected.32 Comas–Rojas et al.29,30 reported similar behavior for the interaction between cetyltrimethylammonium bromide (CTAB) and two PEIs with different molar weights (2,000 and 750,000 g mol–1). They studied the formation of CTAB–PEI films using different techniques and determined 0.77 mmol L–1 as the CTAB concentration in solution above which the film formation reached equilibrium. This concentration is very close to that observed in this study for the saturation of the aqueous system.
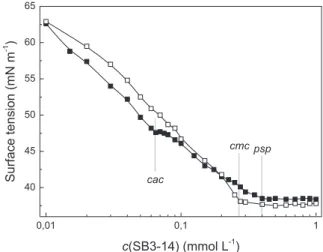
Figure 3 shows the data obtained for the changes in surface tension in water as a function of the SB3–14 concentration (c(SB3–14)) for solutions of SB3–14 and SB3–14–PEI system. The addition of PEI led to almost no alteration in the curve, indicating that the polymer-surfactant system does not exhibit surface properties. The plotting of the data obtained for SB3–14 indicated a cmc for the surfactant of 0.27 mmol L–1 at 37.7 mN m–1, which is in agreement with surface tension measurements reported in the literature (0.27 mmol L–1).33 The profile obtained for the SB3–14–PEI system indicates polymer-surfactant interaction,11,14,34 with a break in the profile and a small plateau being observed at 47.6 mN m–1 for 0.07 mmol L–1 of surfactant, which characterizes the cac for the system. With an increase in the SB3–14 concentration, the surface tension values start to decrease again and stabilize at 38.2 mN m–1 and c(surfactant) = 0.39 mmol L–1. Above this value, which corresponds to the psp, only regular SB3–14 micelles are formed in equilibrium with SB3–14–PEI complexes.
Fluorescence measurements
The steady–state fluorescence technique was used, with pyrene as a fluorescent emission probe, to confirm the formation of poly-mer–surfactant complexes. The fluorescence emission spectrum for pyrene has five vibronic bands and the ratio between the intensities of the first (I1) band at 372.8 nm and the third (I3) band at 384.0 nm is highly sensitive to small changes in the microenvironment of the medium.35,36 For instance, the I
1/I3 value for hexane is equal to 0.6 while a value of 1.8 is reported for water.37 This type of probe is widely used in the study of micelles26,38 and lipophilic environments,39,40 as
well as in the investigation of aqueous mixtures of polyelectrolytes and surfactants.17,18 A micellization process can be followed by the decrease in the I1/I3 ratio due to the migration of pyrene from aqueous solution to the micellar core microenvironment.24,25
Figure 4 shows plots of the I1/I3 ratio for pyrene in aqueous solu-tion as a funcsolu-tion of c(SDS) for solutions of SDS and SDS–PEI. The cmc value was determined to the surfactant concentration at which the upper plateau ends, this being 7.0 mmol L–1.17 The addition of PEI to the system causes a significant change due to the SDS–PEI association. The results indicated that the onset of association (cac) occurred at 0.09 mmol L–1. At low surfactant concentration the I
1/I3 ratio is similar the water polarity (~1.80),36 while for high concentra-tions of SDS, above the cmc and cac, the I1/I3 ratio decreased to around 1.15, which is consistent with values reported for SDS micelles.41
Figure 5 shows the influence of TTAB on the I1/I3 values for pyrene in water for solutions of TTAB and TTAB–PEI. For solutions of pure surfactant a classical behavior was observed, with a well–defined cmc of 1.75 mmol L–1, lower than the value obtained through surface tension measurements (3.30 mmol L–1). In general, the cmc values obtained using the fluorescence technique are slightly lower than the values determined by other methods. This difference is attributable to the fact that pyrene, because of its low solubility in water, induces the formation of pre–micellar aggregates.14 Above the cmc, the I
1/I3 ratio decreased reaching 1.31, which is attributed to the presence of
0,01 0,1 1 10
40 45 50 55 60 65 70
c(TTAB) (mmol L )-1
cac
cmc
Surface tension (mN
m
)
-1
Figure 2. Surface tension with increasing concentrations of TTAB; () pure TTAB and () TTAB–PEI (c(polymer) = 2.0 mg mL–1) at 25.0 ± 0.1 °C
0,01 0,1 1
40 45 50 55 60 65
Surface tension (mN
m
)
-1
c(SB3-14) (mmol L )-1
cac
cmc psp
Figure 3. Surface tension with increasing concentrations of SB3–14; () pure SB3–14 and () SB3–14–PEI (c(polymer) = 2.0 mg mL–1) at 25.0 ± 0.1 °C
1E-3 0,01 0,1 1 10 100
1,0 1,2 1,4 1,6 1,8
I 1
/
I 3
c(SDS) (mmol L-1) cmc
cac
Figure 4. I1/I3 ratio for pyrene fluorescence emission with increasing
concen-tration of SDS; () pure SDS and () SDS–PEI (c(polymer) = 2.0 mg mL–1)
surfactant micelles.36,42 In the presence of PEI the profile changes and shows the cac at c(TTAB) of 0.03 mmol L–1.
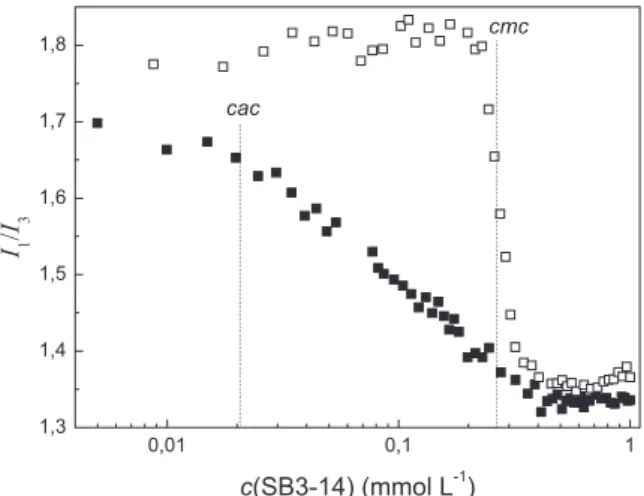
The influence of the addition of SB3–14 on the I1/I3 values of the aqueous solutions of pyrene for solutions of SB3–14 and SB3–14–PEI is shown in Figure 6. The cmc value of 0.25 mmol L–1 was obtained for SB3–14. For SB3–14–PEI solutions the I1/I3 ratio begins to decrease at ca. 0.02 mmol L–1, determining the cac, but the value for the ratio gra-dually decreases, stabilizing at I1/I3= 1.32 with the addition of SB3–14 at a concentration above 0.40 mmol L–1. This behavior is attributed to a less cooperative association,42,43 compared with other systems.14
pH of the surfactant–PEI aqueous solutions
The pH values of the aqueous solutions of PEI at a concentration of 2.0 mg mL–1 were measured alone and with increasing amounts of SDS (Figure7A). The pH value was close to 9.5 for PEI alone and increased to 11.2 for c(SDS) = 20 mmol L–1. The amino groups present in PEI act as a weak base, abstracting protons of the water molecules, with formation of hydroxide,18 which becomes alkaline its aqueous solutions. If SDS is added, the acid–base equilibrium is displaced because of the specific binding of the negative charge from anionic surfactant with the positive charge from PEI, increasing c(OH–) and consequently increasing also the pH.18
Figure 7B shows the influence of the addition of TTAB on the pH of the aqueous solutions of PEI, a large increase in the pH values being observed with an increase in the surfactant concentration: with the addition of TTAB at a concentration as low as 1.25 mmol L–1 the pH increases from 9.5 to 10.30 and above this concentration the pH remains practically constant. The data suggest that the Br– counter–ion influences the pH of the solution and therefore a similar study was carried out adding NaBr to an aqueous solution of PEI. For compari-son, experimental data are also shown in Figure 7B, where it can be observed that there was an increase in the pH value with increasing c(NaBr), but the pH value reaches 9.95 at c(NaBr) = 10.0 mmol L–1, while for the same TTAB concentration the pH value reaches 10.30.
1E-4 1E-3 0,01 0,1 1 10
1,3 1,4 1,5 1,6 1,7 1,8 1,9
cac
I1 /I3
c(TTAB) (mmol L-1)
cmc
Figure 5. I1/I3 ratio for pyrene fluorescence emission with increasing
concentra-tion of TTAB; () pure TTAB and () TTAB–PEI (c(polymer) = 2.0 mg mL−1)
at 25.0 ± 0.1 °C
0,01 0,1 1
1,3 1,4 1,5 1,6 1,7 1,8
I1
/
I3
c(SB3-14) (mmol L-1) cac
cmc
Figure 6. I1/I3 ratio for pyrene fluorescence emission in water with
incre-asing concentration of SB3–14; () pure SB3–14 and () SB3–14–PEI (c(polymer) = 2.0 mg mL–1) at 25.0 ± 0.1 °C
0 10 20 30 40
9,2 9,6 10,0 10,4 10,8 11,2 11,6
pH
c(SDS) (mmol L-1)
A
0,0 2,5 5,0 7,5 10,0
9,4 9,6 9,8 10,0 10,2 10,4
B
pH
c(TTAB or NaBr) (mmol L-1)
0 1 2 3 4 5
9,2 9,4 9,6 9,8 10,0
C
pH
c(SB3-14) (mmol L-1)
Figure 7. Change on the pH of aqueous solutions of (A) SDS–PEI, (B) TTAB– PEI (), NaBr–PEI (), and (C) SB3–14–PEI. (c(polymer) = 2.0 mg mL–1)
These differences suggest that Br– is able to interact with both the positively charged polymer and the head of the surfactant, forming double layer coordination complexes,44,45 which leads to a more ac-centuated increase in the pH value than that observed for the system with only NaBr. The formation of these complexes can explain the films observed when this system was studied by way of surface ten-sion measurements (see above).
For the system comprised of PEI and SB3–14, no significant changes in the pH values occurred (Figure 7C). In this case, the zwit-terionic surfactant was not able to bind specifically with the positively charged sites on the polymeric chains, and thus did not displace the acid–base equilibrium. The interaction of SB3–14 with PEI occurs through hydrophobic effect.
Zeta potential of the surfactant–PEI aqueous solutions
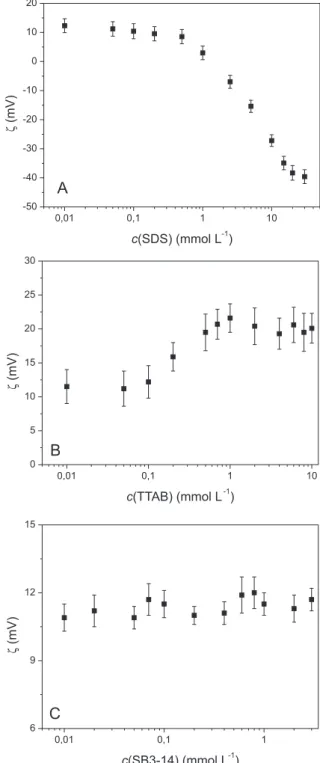
The ζ data are related to the surface charge density of the complexes. The PEI solution (c(PEI) = 2.0 mg mL–1) had a positive ζ value (+15.1 ± 2.0 mV) due to the positive charges of the protonated amino groups. On the other hand, a negative ζ value from –49.8 ± 5.1 mV was obtained for pure SDS aqueous solutions, in a concentration above the cmc. As expected, the addition of SDS to the PEI solutions led to achange in the ζ value from positive to negative (Figure 8A). This behavior should be explained considering the SDS–PEI interactions. Below cac concentration, the specific interaction between SDS and PEI leads to very small changes in ζ values and it remains positive. Above the cac, due to the SDS–PEI complex formation, the ζ value gradually decreases until concentrations near to psp, because of the global charge changes in the SDS–PEI complex. In the TTAB case (Figure 8B), there is no ζ charge inversion and the changes in ζ values are very small compared to SDS–PEI system. These observations are in agreement with surface tension data (Figure 2). Near to cac, the ζ value starts to increase due the TTAB–PEI complex formation, but it stops to increase at ~0.9 mmol L–1, which is the concentration observed for the formation of mesostructured thin films at the air-liquid interface in surface tension measurements. At this point, the ζ values of TTAB–PEI solutions (+20.1 ± 2.2 mV) are very small if compared to the pure TTAB solutions (+51.1 ± 4.3 mV), because in this technique the ζ potential is measured only from the species in solution. The increase in the zwitterionic concentration in presence of PEI had practically no change on the ζ values (Figure 8C), which is in agreement with the results obtained through the other experimental techniques used.
DLS data for PEI and surfactants in aqueous solution
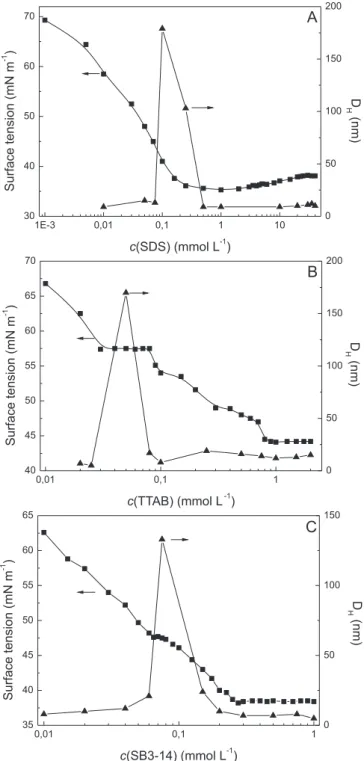
The PEI–surfactant systems were studied by way of DLS measu-rements, in order to understand the influence of the surfactant on the conformation of the polymeric chains in solution through analysis of the hydrodynamic diameter (DH) of the aggregates. Figure 9 shows the DH values for SDS–PEI (A), TTAB–PEI (B), and SB3–14–PEI (C), along with the corresponding surface tension profiles for comparison. Figure 9A indicates that when the c(SDS) was close to the cac (deter-mined by way of the surface tension) a considerable increase in the DH occurred, indicating an association between SDS and PEI, which promotes a conformational change in the polymer chain. The specific binding of SDS molecules to the PEI chain increases the exclusion volume of the polymer in solution and, consequently, its DH value. Since the polymer charges are neutralized, the hydrophobic effect starts to control the interlacing, leading to the relaxation of the poly-mer chains and more folding conformations, as described by Wang et al..13 The D
H value decreased with the further addition of SDS to the solution, probably due to the minimization of the inter chain repulsion
(double electric layer contraction) promoted by an increase in the ionic strength (self–salt effect). The TTAB–PEI system (Figure 9B) shows that at low surfactant concentrations (<0.02 mmol L–1) the behavior was very similar to that observed for the SDS system: at the cac, the DH value increased due to the beginning of the TTAB–PEI interaction. Above the cac, the DH value decreased with the further addition of surfactant, due to the folding of the polymeric chains. Figure 9C shows the data for the SB3–14–PEI system. Its behavior at close to the cac value determined by way of the surface tension was very similar to that of the SDS–PEI system, the observed increase in DH providing evidence for the beginning of the formation of SB3–14–PEI aggregates. In the same way, the addition of more surfactant leads to a folding of the polymeric chains.
0,01 0,1 1 10
-50 -40 -30 -20 -10 0 10 20
A
ζ
(mV)
c(SDS) (mmol L-1)
0,01 0,1 1 10
0 5 10 15 20 25 30
B
ζ
(mV)
c(TTAB) (mmol L-1)
0,01 0,1 1
6 9 12 15
C
ζ
(mV)
c(SB3-14) (mmol L-1)
1E-3 0,01 0,1 1 10 30 40 50 60 70
c(SDS) (mmol L-1)
Surfac e tensio n (m N m -1 )
A
0 50 100 150 200 D H (nm)0,01 0,1 1
40 45 50 55 60 65 70
c(TTAB) (mmol L-1)
Surface tensio n (m N m -1 )
B
0 50 100 150 200 D H (nm)0,01 0,1 1
35 40 45 50 55 60 65
c(SB3-14) (mmol L-1)
Surfac e tensio n (m N m -1 )
C
0 50 100 150 D H (nm)Figure 9. DH values obtained through DLS experiments with (A) SDS–PEI, (B)
TTAB–PEI, and (C) SB3–14–PEI, (c(polymer) = 2.0 mg mL–1). The respective
surface tension plots are included for comparison
Although the anionic SDS was the only surfactant to exhibit a strong electrostatic interaction towards PEI, all of the other surfactants were able to produce complexes with the polymer, mostly due to the minimization of the hydrophobic effect arising from their non-polar chains in water. The DH of the complexes increased with the addition of surfactant up to a maximum value close to the cac; further addition of surfactant produced more compact complexes, due to the folding and entanglement of the PEI chains.
ACKNOWLEDGEMENTS
The financial support of the Brazilian Conselho Nacional de Desenvolvimento Científico e Tecnológico (CNPq), CAPES, and UFSC is gratefully acknowledged. The authors also acknowledge Professora Nádya Pesce da Silveira for providing laboratory facilities for the DLS measurements.
REFERENCES
1. Mészáros, R.; Varga, I.; Gilányi, T.; Langmuir2004, 20, 5026. 2. Nam, Y. S.; Kang, H. S.; Park, J. Y.; Park, T. G.; Han, S.; Chang, I.;
Biomaterials2003, 24, 2053.
3. Signori, A. M.; Santos, K. O.; Eising, R.; Albuquerque, B. L.; Giacomel-li, F. C.; Domingos, J. B.; Langmuir2010, 26, 17772.
4. Shuai, X.; Merdan, T.; Unger, F.; Kissel, T.; Bioconjugate Chem.2005, 16, 322.
5. Tian, H.; Xiong, W.; Wei, J.; Wang, Y.; Chen, X.; Jing, X.; Zhu, Q.; Biomaterials2007, 28, 2899.
6. Liu, Y.; Samsonova, O.; Sproat, B.; Merkel, O.; Kissel, T.; J. Controlled Release2011, 153, 262.
7. Sunintaboon, P.; Duangphet, S.; Tangboriboonrat, P.; Colloids Surf., A
2009, 350, 114.
8. Santos, K. O.; Elias, W. C.; Signori, A. M.; Giacomelli, F. C.; Yang, H.; Domingos, J. B.; J. Phys. Chem. C2012, 116, 4594.
9. Cheng, W. P.; Gray, A. I.; Tetley, L.; Hang, T. L. B.; Schätzlein, A. G.; Uchegbu, I. F.; Biomacromolecules2006, 7, 1509.
10. Zanette, D.; Lima, C. F.; Ruzza, Â. A.; Belarmino, A. T. N.; Santos, S. F.; Frescura, V. L. A.; Marconi, D. M. O.; Froehner, S. J.; Colloids Surf., A1999, 147, 89.
11. Goddard, E. D.; J. Colloid Interface Sci.2002, 256, 228.
12. Borsali, R.; Minatti, E.; Putaux, J.-L.; Schappacher, M.; Deffieux, A.; Viville, P.; Lazzaroni, R.; Narayanan, T.; Langmuir2002, 19, 6. 13. Wang, H.; Wang, Y.; Yan, H.; Langmuir2006, 22, 1526.
14. Zanette, D.; Felippe, A. C.; Schweitzer, B.; Dal Bo, A.; Lopes, A.; Col-loids Surf., A2006, 279, 87.
15. Holmberg, C.; Nilson, S.; Sundelof, L. O.; Langmuir1997, 13, 1392. 16. Winnik, M. A.; Bystryak, S. M.; Macromolecules1999, 32, 624. 17. Felippe, A. C.; Bellettini, I. C.; Eising, R.; Minatti, E.; Giacomelli, F. C.;
J. Brazil. Chem. Soc.2011, 22, 1539.
18. Bellettini, I. C.; Nandi, L. G.; Eising, R.; Domingos, J. B.; Machado, V. G.; Minatti, E.; J. Colloid Interface Sci.2012, 370, 94.
19. Winnik, M. A.; Bystryak, S. M.; Chassenieux, C.; Langmuir2000, 16, 4495.
20. Dal Bó, A.; Schweitzer, B.; Felippe, A. C.; Zanette, D.; Lindman, B.; Colloids Surf., A 2005, 256, 171.
21. Turro, N. J.; Yekta, A.; J. Am. Chem. Soc.1978, 100, 5951.
22. Turro, N. J.; Baretz, B. H.; Kuo, P. L.; Macromolecules1984, 17, 1321. 23. Zana, R.; Yiv, S.; Strazielle, C.; Lianos, P.; J. Colloid Interface Sci.1981,
80, 208.
24. Winnik, F. M.; Regismond, S. T. A.; Colloids Surf., A1996, 118, 1. 25. Zana, R.; Mixed Surfactant Solutions, Marcel Dekker: New York, 1993. 26. Eising, R.; Morés, S.; Bellettini, I. C.; Felippe, A. C.; Dal-Bó, A. G.;
Zanette, D.; Quim. Nova2008, 31, 2065.
CONCLUSIONS
27. Zakharova, L. Y.; Valeeva, F. G.; Kudryavtsev, D. B.; Bilalov, A. V.; Tret’yakova, A. Y.; Kudryavtseva, L. A.; Konovalov, A. I.; Barabanov, V. P.; Russ. Chem. Bull.2005, 54, 641.
28. Shaw, D. J.; Introduction to Colloid and Surface Chemistry; Butterworth-Heinemann: Oxford, 1992.
29. Comas-Rojas, H.; Fernández-Catá, G.; Edler, K. J.; Roser, S. J.; Pérez-Gramatges, A.; J. Colloid Interface Sci.2009, 339, 495.
30. Comas-Rojas, H.; Aluicio-Sarduy, E.; Rodríguez-Calvo, S.; Pérez-Gramatges, A.; Roserb, S. J.; Edlerb, K. J.; Soft Matter2007, 3, 747. 31. Zakharova, L. Y.; Mirgorodskaya, A. B.; Yackevich, E. I.; Yurina, A. V.;
Syakaev, V. V.; Latypov, S. K.; Konovalov, A. I.; J. Chem. Eng. Data
2010, 55, 5848.
32. O’Driscoll, B. M. D.; Milsom, E.; Fernandez-Martin, C.; White, L.; Roser, S. J.; Edler, K. J.; Macromolecules2005, 38, 8785.
33. del Mar Graciani, M.; Rodríguez, A.; Muñoz, M.; Moyá, M. L.; Langmuir2005, 21, 7161.
34. Touhami, Y.; Rana, D.; Neale, G. H.; Hornof, V.; Colloid Polym. Sci.
2001, 279, 297.
35. Nakajima, A.; Bull. Chem. Soc. Jpn.1971, 44, 3272.
36. Kalyanasundaram, K.; Thomas, J.; J. Am. Chem. Soc.1977, 99, 2039. 37. Dong, D. C.; Winnik, M. A.; Photochem. Photobiol.1982, 35, 17. 38. Zana, R.; Surfactant Solutions, Vol. 22; Marcel Dekker: New York, 1986. 39. Glushko, V.; Karp, C.; Sonenberg, M.; Biophys. J.1976, 16, A48. 40. Glushko, V.; Thaler, M. S. R.; Karp, C. D.; Arch. Biochem. Biophys.
1981, 210, 33.
41. Chen, M.; Gratzel, M.; Thomas, J. K.; J. Am. Chem. Soc.1975, 97, 2052. 42. Mylonas, Y.; Bokias, G.; Iliopoulos, I.; Staikos, G.; Eur. Polym. J. 2006,
42, 842.