Article
J. Braz. Chem. Soc., Vol. 24, No. 8, 1267-1275, 2013. Printed in Brazil - ©2013 Sociedade Brasileira de Química 0103 - 5053 $6.00+0.00
A
*e-mail: [email protected]
Determination of Selenium, Chromium and Copper in Food Dyes by GF AAS
Emanueli do Nascimento da Silva,a Nivaldo Baccana,b and Solange Cadore*,a
aInstitute of Chemistry, University of Campinas, PO Box 6154, 13083-970 Campinas-SP, Brazil
bFaculdade de Paulínia, 13140-000 Paulínia-SP, Brazil
A determinação de selênio, crômio e cobre em corantes alimentares por espectrometria de absorção atômica com forno de grafite foi feita utilizando-se uma simples dissolução ácida como tratamento de amostra. Modificadores químicos foram investigados para os três analitos. Utilizando calibração por compatibilização de matriz, temperaturas de pirólise e de atomização de 1300 e 1800 oC, respectivamente, e 5 µg Pd + 3 µg Mg(NO
3)2 como modificador químico foi possível a determinação de selênio em todos os corantes estudados. Para o crômio, 15 µg Mg(NO3)2 foram utilizados como modificador químico e as temperaturas de pirólise e atomização foram de 1500 e 2500 oC, respectivamente, usando calibração externa. A determinação de cobre foi feita sob temperaturas ideais de pirólise (1200 oC) e de atomização (2000 oC) usando 5 µg Pd + 3 µg Mg(NO3)2 como modificador químico e, dependendo do corante, foi necessário o uso de calibração externa ou de adição de padrão. Valores de recuperação entre 90 e 110% foram obtidos com os métodos desenvolvidos. As análises dos corantes utilizados por indústrias alimentícias mostraram concentrações de Cu abaixo dos valores máximos recomendados pela legislação brasileira, no entanto, não existem limites estabelecidos para Se e Cr.
The determination of selenium, chromium and copper in food dyes by graphite furnace atomic absorption spectrometry was carried out using a simple acid dissolution as sample treatment. Different chemical modifiers were investigated for the three analytes. Using the matrix-matching calibration technique, pyrolysis and atomization temperatures of 1300 and 1800 oC, respectively, and 5 µg Pd + 3 µg Mg(NO3)2 as chemical modifier allowed the determination of Se in all the studied dyes. For chromium, 15 µg Mg(NO3)2 were used as chemical modifier, and pyrolysis and atomization temperatures were of 1500 and 2500 oC, respectively, using external calibration. The determination of copper was carried out under the optimized temperatures of pyrolysis (1200 oC) and atomization (2000 oC) using 5 µg Pd + 3 µg Mg(NO
3)2 as chemical modifier and, depending on the dyes, it was necessary to use external or standard addition calibration. Recoveries between 90 and 110% were obtained for the developed methods. The analysis of dyes used by food industries showed concentrations of Cu below the maximum values recommended by Brazilian legislation, however, there are no established limits for Se and Cr.
Keywords: GF AAS, food dyes, selenium, chromium, copper
Introduction
Food additives, mainly dyes, are added to foods as additional substances, without the objective of increasing their nutritional value, having only the function of coloring or enhancing the color, and thereby, the acceptability of the product by consumers.1
The relation between food colorants and harmful effects to human health may be increased by the presence of toxic elements or by the presence of essential elements
in excessive quantity. From the point of view of public health, there are some disagreements concerning the safety of artificial colorants but generally the toxicity of the dyes is related to the amount ingested by the consumer, by either consumption of large amounts of naturally colored foods and/or artificially colored foods, or due to the amount of dye added to the food, which should be minimal, using only an amount that enables the dye to provide the desired color.1-6
Health Surveillance Agency (ANVISA) associated to the Health Ministry. According to Resolutions No. 382 to 388, eleven artificial dyes are allowed for use in foods and beverages in Brazil: Tartrazine (E102, yellow), Sunset Yellow FCF (E110, orange), Azorubine (E122, red), Amaranth (E123, red), Ponceau 4R (E124, red), Erythrosine (E127, pink), Allura Red AC (E129, red), Patent Blue V (E131, blue), Indigotine (E132, indigo), Brilliant Blue FCF (E133, blue) and Fast Green FCF (E143, turquoise shade).5 Resolution CNS/MS No. 04, concerning inorganic contaminants, shows limiting values in food colorants only for arsenic, lead, copper, tin and zinc.7
Many studies in the literature describe the toxicity of dyes, but few of them deal with the inorganic composition, i.e., the ions of inorganic elements that are present in the artificial food colorants. Among these few works, it is possible to find the determination of Cr in FD&C Blue No. 1 dye (for food, drugs and cosmetics).2-4,8-10
A major advantage of GF AAS (graphite furnace atomic absorption spectrometry) for the determination of metal ions is the introduction of the sample with little or no pre-treatment. Although this technique does not present many difficulties in the determination of one analyte in the presence of others, considering that the matrix should be eliminated in the pyrolysis step, some problems can occur in the determination of certain analytes, especially when present in very complex samples, such as food colorants. In these cases it is extremely important to use chemical modifiers, mainly in the determination of selenium. This element has a very low wavelength for absorbance that generates high background values, hindering its determination in various matrices.11,12
The determination of selenium using GF AAS in various matrices shows the difficulty of using an external calibration curve. All the works found in the literature describe the need of chemical modifier, and frequently a matrix-matching procedure is also used in order to allow the determination of Se. The use of a L’vov platform coated with W-Rh proved to be more efficient than ammonium phosphate, magnesium nitrate, and palladium, usually used as chemical modifiers.13 For the determination of Se in plants, however, the use of Pd(NO3)2 showed the best results.14 In another work, the same authors have used W for the determination of Se in soils and obtained recoveries between 80 and 90%, in addition to a significant increase in the lifetime of the graphite tube, corresponding to 750 heating cycles.15 Theodorolea et al.16 have studied Zr, Ir and the mixture of Zr-Ir concluding that the combination of 2 µg Zr + 2 µg Ir showed the best results for the determination of Se. González-Nieto et al.17 have described the effects of Pd, Ni and mixtures of these two different
modifiers to determine Se in soils and they have shown that all combinations evaluated lead to accurate results and good detectability. For the determination of Se in the presence of Pd/Mg(NO3)2, Pd or Ir was also reported for different kinds of matrices.18-21
In contrast, the determination of Cr and Cu does not indicate a great difficulty, but usually it is also necessary to use chemical modifier for the determination of these analytes in complex matrices. Daftsis and Zachariadis22 emphasized the use of standard addition calibration as well as a chemical modifier for the determination of Cr and other analytes by GF AAS in fractions of blood, which is a very complex sample, while Dobrowolski23 did not find difficulties for the determination of Cr using an external calibration curve. Felipe-Sotelo et al.24 have accurately determined Cr, Ni and V in complex matrices by GF AAS using slurry-based procedures. The determination of copper by GF AAS has been the aim of many studies in different kind of samples and the use of chemical modifiers such as Sc + Pd + NH4NO3 25 is described in the literature. Kılıç et al.26 have determined Pb and Cu in chewing gum using various chemical modifiers and obtained good results with W + Pd.
The presence of these analytes in the dyes originates from the use of catalysts in previous stages of the synthesis of these macromolecules.8 The determination of Se and Cu are of great interest because they are considered essential elements at trace levels but they may become toxic at higher concentrations. The inorganic forms of Se are more toxic than organic forms and its particularity is in the small difference between the concentration considered toxic and that recommended in the diet. Related to chromium, the trivalent form is considered essential at trace level, while Cr(VI) is considered toxic at any concentration.8,13,27
Considering the small number of studies related to food dyes and the lack of information in Brazilian law, as well as the commercial interest in this kind of sample and the importance of metal ions in the nutritional and toxicological areas, this work was carried out in order to obtain information about the total inorganic content of Cr, Cu and Se in food dyes.
Experimental
Instrumental
sources were a Se electrodeless discharge lamp (EDL, Perkin Elmer; I = 290 mA) and hollow cathode lamps (HCL, Perkin Elmer, I = 25 mA) for Cr and Cu. The measurements were made at the 196.0 nm resonance line with a bandwidth of 2.0 nm for Se, and at 357.9 nm for Cr and at 324.8 nm for Cu, with a bandwidth of 0.7 nm for both of them. The inert gas used was argon, at 250 mL min-1 flow rate, except during the atomization step when it was interrupted. All the measurements were made in integrated absorbance units. The volumes of sample and chemical modifier, injected during the analysis into the graphite tube, were 20 and 5 µL, respectively. The GF AAS optimized conditions used in the measurements are described in Table 1.
Reagents
All chemical reagents were of analytical grade.
Deionized water (resistivity of 18.2 MΩ cm) was
obtained with a Milli-Q System (Millipore, Bedford, MA, USA). Nitric acid and hydrogen peroxide were obtained from Merck (Merck, Darmstadt, Germany). All sample containers, autosampler cups and other materials were washed with water, soaked in 10% v v−1 nitric acid for 24 h and rinsed with deionized water prior to use.
Stock solutions of Se, Cr and Cu (1000 mg L−1) were prepared by dissolving selenium oxide (Titrisol, Merck), chromic chloride and copper chloride (Titrisol, Merck) with previously distilled 2% v v−1 HNO
3. Analytical standards with concentrations between 2 and 100 µg L−1 were prepared from these solutions using 10% v v-1 HNO
3 for selenium and 0.4% v v-1 HNO
3 for Cr and Cu.
The chemical modifiers were prepared from a 10,000 mg L−1 Pd(NO
3)2 solution in 15% v v−1 HNO3 (Merck), a 10,000 mg L−1 IrCl
3·3H2O solution in 20% v v −1
HCl (VHG Labs, Manchester, USA), solid Mg(NO3)2 (Acros, New Jersey, USA), solid Ni(NO3)2·6H2O (Ecibra, Santo Amaro, SP, Brazil), solid AgNO3 (Avi-Cenna, Guarulhos, SP, Brazil) and solid (NH4)6W7O24·6H2O (Carlo Erba, Milan, Italy).
The food colorants used in this study were the following: Tartrazine - E-102 (BASF) and E-102b (from a food
analysis laboratory), Sunset Yellow FCF - E-110 (BASF), Amaranth - E-123 (BASF) and E-123b (from a food analysis laboratory), Ponceau 4R or New coccine - E-124 (BASF), Indigotine - E-132 (BASF) and E-132b (from a food analysis laboratory), Erythrosine - E-127 (from a food analysis laboratory) and Red 40 - E-129 (from a food analysis laboratory).
Sample treatment
For sample preparation, an acid dissolution was carried out, which consists in dissolving the dye in dilute HNO3 before transferring the sample to the GF AAS.
For the determination of selenium, the samples
were dissolved in 10% v v-1 HNO
3, and to determine chromium and copper, the samples were dissolved in 0.4% v v-1 HNO
3.
Chemical modifiers
The following chemical modifiers were evaluated for the determination of selenium in food dyes: 5 µg Pd; 50 µg Ni; 5 µg Pd + 3 µg Mg(NO3)2; 30 µg Pd + 30 µg Mg(NO3)2; 5 µg Pd + 50 µg Ni; 5 µg Pd + 3 µg Mg(NO3)2 + H2O2 (20, 40 and 60% v v−1), added to the sample solution; thermally coated treatment using 520 µg Ir28 (alone and as a mixture, as follows); 520 µg of thermally coated Ir + 5 µg Pd + 3 µg Mg(NO3)2; 520 µg of thermally coated Ir + 5 µg Pd + 50 µg Ni; 250 µg of thermally coated W29 (alone and as a mixture, as follows); 250 µg W + 5 µg Pd + 90 µg Mg(NO3)2; and 200 µg W + 5 µg Pd + 50 µg Ni. The study was carried out using E-132.
For Cr and Cu, two modifiers were evaluated: 15 µg Mg(NO3)2 and the mixture 5 µg Pd + 3 µg Mg(NO3)2. The study was carried out using the dyes E-102, E-110, E-123, E-124 and E-132.
Figures of merit for analyte determinations
Using the optimized conditions for sample treatment, furnace heating program and modifier, analytical calibration
Table 1. Graphite furnace heating programs used for determination of analytes in food dyes
Step Temperature / °C Ramp / s Hold / s Air flow rate / (mL min-1)
Se Cr Cu
Drying 1 90 90 90 10 20 250
Drying 2 120 120 120 15 30 250
Ashing 1300 1500 1200 10 20 250
Atomization 1800 2500 2000 0 5 0
curves were built and the evaluation of analyte addition and recovery, slope of the calibration curve, relative standard deviation (RSD), and limits of detection (LOD) and of quantification (LOQ) was carried out. Additions of the analytes at three different concentrations were carried out in triplicate for each dye.
The LOD and LOQ values were calculated from the equations: (3 × s/α) for LOD and (10 × s/α) for LOQ,
where s is the standard deviation of the blank, and α the
angular coefficient of the analytical curve.30 To evaluate the precision and accuracy parameters, addition and recovery tests were used, evaluating RSD, considering the lack of certified reference materials for these metal ions in food dyes.
External analytical curves (20-80 µg L-1 Se) were obtained and addition and recovery tests at three levels of concentration were done for each of the studied dyes. For this, 20, 50 and 80 µg L-1 Se were added to 2.5 g L-1 of each dye. Analyte addition curves (16-80 µg L-1 Se) were also built for each dye. The matrix-matching method was evaluated using the curve obtained for E-132 dye and addition and recovery of 60 µg L-1 of Se for each dye.
External analytical curves (2-17.5 and 10-80 µg L-1) were obtained to evaluate low and high concentrations of Cr, and addition and recovery tests were done for each of the studied dyes. For this, 2.0, 7.5 and 15 µg L-1 of Cr were added to 2.5 g L-1 of each dye to evaluate the recoveries of low concentrations, and 10 and 70 µg L-1 of Cr were added to 1.6 g L-1 to evaluate the recoveries of high concentrations of this analyte in food dyes. Analyte addition curves (2-17.5 µg L-1) were also built for each dye.
For Cu, external analytical curves (2-25 and 10-100 µg L-1) were obtained to evaluate low and high concentrations and additions, and recovery tests were also done for each of the studied dyes. For this, (2 and 10 µg L-1), (7, 10 and 17.5 µg L-1) and (12, 17.5 and 25 µg L-1) of Cu were added to 12.5 g L-1 of each dye to evaluate the recoveries of low concentrations. The additions were done depending on the concentration of analyte in each dye. Additions of 10 and 90 µg L-1 of Cu to 5 g L-1 of each dyewere usedto evaluate the recoveries of high concentrations of analyte in food dyes. Analyte addition curves (2-25 µg L-1) were also built for each dye and recovery tests were done with the addition of 10 µg L-1.
Results and Discussion
Optimization of the chemical modifiers and pyrolysis and atomization temperature for Se
Different works described the difficulties of obtaining a chemical modifier that can improve the thermal stability
of selenium in order to be able to apply higher pyrolysis temperatures to eliminate the matrix.17,18,31-33 Considering the complexity of the dye samples, a study of different chemical modifiers was carried out, as described in the Experimental section.
The combination 5 µg Pd + 50 µg Ni gave good results, with recoveries of about 80% although it is necessary to use a matrix-matching calibration to determine Se in food dyes. The presence of Ni decreases the volatility of Se in the dye sample and the signal shows an adequate profile.17,31,34,35 Additionally, high analytical signals were obtained when increasing the amount of Pd in the combination Pd + Mg(NO3)2 due to the trapping of Se in the graphite surface in the presence of large amounts of Pd, although a broad peak and high background signal were observed in the presence of higher Pd concentrations. In the case of 30 µg Pd + 30 µg Mg(NO3)2, for instance, the analytical signals seem to be better than the 5 µg Pd + 3 µg Mg(NO3)2, and the background was efficiently corrected by Zeeman effect and quantitative measurements were allowed. However, usually higher deviations were observed, with RSD above 10%, while for 5 µg Pd + 3 µg Mg(NO3)2, RSD was about 3%, which showed to be suitable for analysis.
The effect of hydrogen peroxide on the determination of Se was also evaluated. Solutions of E-132 dye containing 100 µg L-1 Se were prepared in the presence of 20, 40 and 60% v v-1 H
2O2 and the analyses were done in the presence of 5 µg Pd + 3 µg Mg(NO3)2 as chemical modifier. Instead of an increase in the analytical signals, double peaks were observed for all amounts of hydrogen peroxide studied, suggesting that different selenium species are being formed.
Permanent modifiers have been studied for the determination of various elements in different matrices. The use of coated W (250 µg) or coated Ir (520 µg), in the absence of other modifiers, did not stabilize Se at temperatures higher than 1000 oC, probably because the analyte remains entrapped in the platform (Se-W and Se-Ir), affecting atomization. The combinations of 200 µg W + 5 µg Pd + 50 µg Ni and 250 µg W + 5 µg Pd + 90 µg Mg(NO3)2 or 520 µg Ir + 5 µg Pd + 50 µg Ni and 520 µg Ir + 5 µg Pd + 3 µg Mg(NO3)2 allowed pyrolysis temperatures of 1200 oC but recovery tests showed values lower than 60%, in comparison with the aqueous standard solution.
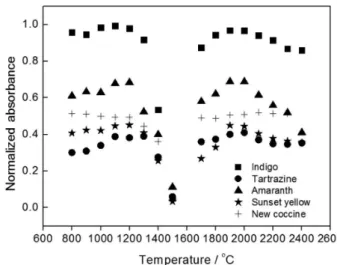
Figure 3 shows pyrolysis and atomization curves for Se in the presence of the Pd/Mg chemical modifiers and without modifier. Considering the absorbance values, the background and the profile signals, the conventional modifier 5 µg Pd + 3 µg Mg(NO3)2 was selected for Se determination.
Selenium determination
Considering the results obtained in the study of chemical modifiers, the most used conventional modifier 5 µg Pd + 3 µg Mg(NO3)2 was shown to be the most suitable for the determination of Se and was used in association with 1300 °C for pyrolysis and 1800 °C for atomization, in order to obtain two calibration curves, an external standard calibration and a standard addition calibration, for each of the dyes studied.
Table 2 shows the figures of merit for these curves, for all the dyes studied in this work. Observing the curves and comparing the slopes, it is possible to verify the presence of a matrix effect, confirming the results obtained during the evaluation of the chemical modifiers. The same behavior was observed in the addition and recovery studies using external calibration. Considering the recovery values of about 50%, for three different levels of Se concentration, it is mandatory to use the matrix-matching calibration for the determination of selenium in food dyes.
As the slopes from the standard addition calibration curve were similar, it is possible to use the curve of any dye
Figure 1. Absorbance for 0.6 ng Se in the aqueous standard and E-132 dye, using the optimized conditions for each modifier evaluated (*30 µg Mg(NO3)2 + 30 µg Pd; **5 µg Pd + 3 µg Mg(NO3)2).
Figure 2. Background absorbance for the aqueous standard and E-132 dye, using the optimized conditions for each modifier evaluated (*30 µg Mg(NO3)2+30 µg Pd; **5 µg Pd + 3 µg Mg(NO3)2).
Figure 3. Pyrolysis and atomization temperature curves for 2 ng of Se added to E-132 dye using different combinations of Pd/Mg and without chemical modifier (normalized absorbance is the signal ratio Se-dye/Se-aqueous standard).
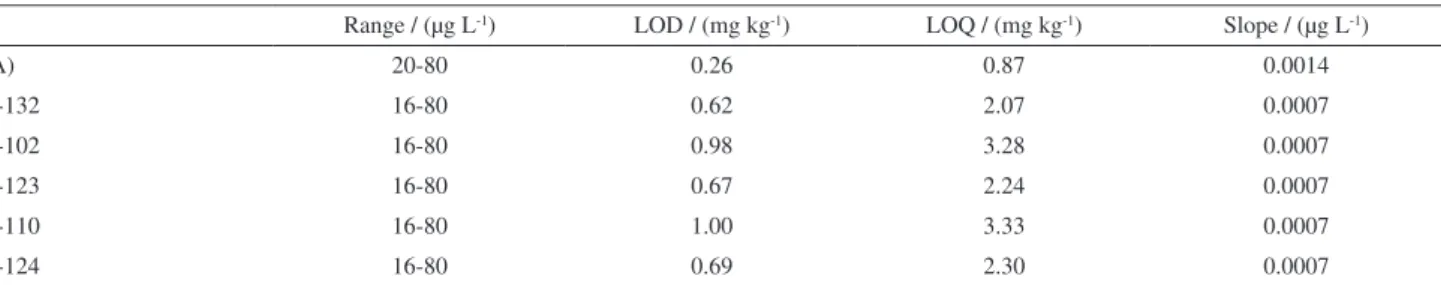
Table 2. Figures of merit for the dyes studied in the determination of Se using an external calibration curve (A) and for E-132, E-102, E-123, E-110 and E-124 analytical curves using the standard addition method
Range / (µg L-1) LOD / (mg kg-1) LOQ / (mg kg-1) Slope / (µg L-1)
(A) 20-80 0.26 0.87 0.0014
E-132 16-80 0.62 2.07 0.0007
E-102 16-80 0.98 3.28 0.0007
E-123 16-80 0.67 2.24 0.0007
E-110 16-80 1.00 3.33 0.0007
to determine the others. In order to confirm this possibility, an addition and recovery study of 60 µg L-1 Se in the dyes was carried out. Table 3 shows the values of recovery for the studied dyes using the curve for E-132 dye. The obtained results are quantitative showing the possibility to use standard addition calibration of one dye for the determination of others.
Selenium was not detected in the dyes studied in this work but if its concentration is higher than the LOD value, the use of matrix-matching calibration allows detecting this analyte since the absolute use of chemical modifiers alone is not able to overcome the matrix effect of food dyes. Using this procedure, good accuracies, recoveries between 90 and 100% and relative standard deviations lower than 10% were obtained. The main advantage of the proposed procedure is the possibility of determining selenium when present in concentrations above the LOD value, in undigested solutions, using only sample dilution with 10% HNO3 v v
-1, reducing the possibilities
of experimental errors and contamination due to more complicated sample treatment.
Optimization of the pyrolysis and atomization temperatures for chromium and copper
After evaluating different reagents, 15 µg Mg(NO3)2 were selected as chemical modifier for chromium determination and 5 µg Pd + 3 µg Mg(NO3)2 were used for copper. Figures 4 and 5 show the pyrolysis and atomization curves for Cr and Cu, respectively, in the presence of some dyes. Observing the curves obtained for Cr, it was possible to select the temperature of 1500 °C for the pyrolysis step and 2500 °C for the atomization since the absorbance decreases below this temperature for E-102, E-123 and E-110 dyes. The pyrolysis and atomization temperatures selected for Cu were 1200 and 2000 ºC, respectively.
The pyrolysis and atomization temperatures for Cr did not change significantly when different matrices are
studied22-24,36,37 because when in contact with the platform, the analyte forms a very stable carbide that must be disrupted in the atomization step.
For Cu, however, the pyrolysis and atomization temperatures vary widely25,26 depending on the matrix since this analyte is more affected by matrix interference. This is because the carbide compounds formed are not as stable as the Cr compounds.
Chromium and copper determinations
External standard calibrations for two concentration levels and standard addition calibration were obtained for each studied dye in order to investigate the matrix effect to determine Cr and Cu in dyes. Table 4 shows the figures of merit for Cu and Cr in all the curves.
Comparing the slopes obtained for curve A (external calibration for low concentration of the analyte) and the
Table 3. Recoveries for the addition of 60 µg L-1 Se in the dyes using
standard addition method for E-132 dye and 5 µg Pd + 3 µg Mg(NO3)2 as chemical modifier
Dye Recovery Se dye ± s / %
E-132 90.8 ± 0.9
E-102 89.4 ± 0.7
E-123 90.2 ± 0.9
E-110 98.8 ± 3.8
E-124 92.4 ± 2.9
s: standard deviation for n = 3.
Figure 4. Pyrolysis and atomization temperature curves for 0.2 ng of Cr added to different dyes using 15 µg Mg(NO3)2 as chemical modifier.
standard addition curves for Cr, less than 10% of variation between them were observed, which means that there is no significant matrix effect. However, 15 µg Mg(NO3)2 as chemical modifier were needed in order to avoid analyte loss in the pyrolysis step.
The curves for Cu did not follow the same trend observed for Cr. In the case of E-132 dye, the slope is lower than those of other dyes and also than that of the external calibration curve (A). The opposite effect was observed for E-123 dye. For these dyes, it is advisable to use the standard addition calibration for copper determination, while for the other dyes, external calibration may be used. Additionally, 5µg Pd + 3 µg Mg(NO3)2 must be used for the determination of copper.
Addition and recovery experiments for Cr and Cu were carried out using the external standard calibration for all the dyes. Considering precision, accuracy and repeatability in the determination of Cr in dyes, the quantification method using the external calibration curve showed a good performance with recoveries better than 90%. For Cu, the
same results were obtained, except for E-123 and E-132 dyes. In this case, as commented before, standard addition calibration is necessary.
It is important to emphasize that curve A represents the expected concentration of these analytes in this kind of samples and curve B was obtained taking into account the values established by legislation. The Brazilian legislation limit for Cu in food dyes is 20 mg kg-1, but there is no value for chromium. However, JECFA (Joint FAO/WHO Expert Committee on Food Additives) establishes the maximum limit of 50 mg kg-1 for Cr in some dyes.5-7
Application of the proposed methods
The methods developed were applied for the determinations of Cr and Cu in some food dyes in industrial use. The experiments were conducted using external calibration curves under the optimized conditions for each analyte and the results are presented in Table 5. The values for selenium are not shown as they were all below the LOQ
Table 4. Figures of merit for external calibration to monitor lower (A) and higher (B) concentrations, as well as the curves of standard addition method for Cr and Cu
Cr Cu
Range / (µg L-1) LOQ / (mg kg-1) Slope / (µg L-1) Range / (µg L-1) LOQ / (mg kg-1) Slope / (µg L-1)
(A) 2-17,5 0.248 0.0128 2-25 0.102 0.0044
(B) 10-80 0.556 0.0089 10-100 0.290 0.0039
E-132 2-10 0.140 0.0126 2-25 0.364 0.0032
E-102 2-10 0.800 0.0134 2-25 0.204 0.0046
E-123 2-10 0.200 0.0142 2-25 0.211 0.0056
E-110 2-10 0.136 0.0125 2-25 0.091 0.0048
E-124 2-10 0.248 0.0132 2-25 0.102 0.0044
Table 5. Chromium and Cu contents determined in the dyes using the external calibration curves
Dye Cr Cu
Content ± s / (mg kg-1) RSD / % Content ± s / (mg kg-1) RSD / %
E-102 (n = 3) − − < 0.102 −
E-102b (n = 2) 0.40 ± 0.03 7 < 0.102 −
E-110 (n = 3) 0.10 ± 0.01 6.1 < 0.102 −
E-123 (n = 3) 0.69 ± 0.01 1.3 0.32 ± 0.0a 2.8
E-123b (n = 2) < 0.248 − < 0.102 −
E-124 (n = 3) 0.10 ± 0.01 9.9 < 0.102 −
E-127 (n = 2) 0.30 ± 0.01 4 0.75 ± 0.07 9
E-129 (n = 2) − − 1.68 ± 0.05 3
E-132 (n = 3) 1.16 ± 0.09 7.9 1.70 ± 0.04a 4.0
E-132b (n = 2) 0.59 ± 0.05 8 0.13 ± 0.02 13
value for all the dyes, and there is no value for Se in dyes in any legislation.
Analyzing the results obtained it is possible to conclude that the consumption of foods containing these dyes does not present any risk to health concerning the concentration of Cr and Cu.
Conclusions
A simple acid dissolution proved to be a suitable procedure for dye sample preparation without the need of many steps of sample manipulation.
During the pyrolysis of the sample, Se cannot be completely stabilized, independent of the modifier studied in this work, showing the difficulty of an effective analyte thermal stabilization. In order to overcome this difficulty, matrix-matching calibration may be used, allowing better accuracy and precision for these kinds of samples.
The methods for the determination of Cr and Cu in food dyes were also good, showing appropriate precision, repeatability and accuracy.
The consumption of these dyes does not represent a serious health problem considering the results obtained, i.e., when only its inorganic content is considered, because according to the legislation,5-7 the amount of dye added to the food must be in the range of 5-600 mg kg-1. So, the quantities of the analytes found in this study are low, and thus the relationship between the amount ingested per day and the allowed daily intake shows that the metal concentrations ingested from the dyes are below this daily intake.27
Acknowledgements
The authors gratefully acknowledge Dr. Carol H. Collins for assistance with English in this manuscript, the Conselho Nacional de Desenvolvimento Científico e Tecnológico (CNPq), the Fundação de Amparo à Pesquisa do Estado de São Paulo and INCTAA (Instituto Nacional de Ciências e Tecnologias Analíticas Avançadas) for financial support of this work.
References
1. Prado, M. A.; Godoy, H. T.; Quim. Nova 2007, 30, 268. 2. Lindino, C. A.; Gonçalves Junior, A. C.; Schreiner, G. G. O.;
Schreiner, J. S.; de Farina, L. O.; Acta Sci. Technol. 2001, 16, 1202.
3. Vi ñ a s , P. ; Pa r d o - M a r t í n e z , M . ; L ó p e z - G a r c í a , I . ; Hernández-Córdoba, M.; J. Agric. Food Chem. 2002, 50, 949. 4. Vi ñ a s , P. ; Pa r d o - M a r t í n e z , M . ; L ó p e z - G a r c í a , I . ;
Hernández-Córdoba, M.; J. Anal. At. Spectrom. 2001, 16, 1202.
5. ANVISA. Resolução RDC nº 273, de 22 de setembro de 2005, http://portal.anvisa.gov.br/wps/wcm/connect/b683960047457a 8b8736d73fbc4c6735/RDC_273_2005.pdf?MOD=AJPERES accessed in June 2013.
6. Joint FAO/WHO Expert Committee on Food Additives (JECFA). FAO Nutrition Meetings Report Series No. 46A WHO/FOOD ADD/70.36, 1970.
7. Conselho Nacional de Saúde/Ministério da Saúde (CNS/MS); Resolução No. 04, 24 de novembro de 1988, aprova revisão das tabelas I, III, IV e V referentes a Aditivos Intencionais, bem como os anexos I, II, III, e VII, todas do Decreto No. 55.871, de 26 de março de 1965; Diário Oficial da União, Brasília, Brasil, 1988. 8. Hepp, N. M.; J. AOAC Int. 1996, 79, 1189.
9. Hepp, N. M.; J. AOAC Int. 1999, 82, 327.
10. Hepp, N. M.; Cargil, A. M.; Shields, W. B.; J. AOAC Int. 2001, 84, 117.
11. Aleixo, P. C.; Nóbrega, J. A.; Santos Júnior, D.; Müller, R. C. S.; Quim. Nova 1999, 23, 310.
12. Welz, B.; Sperling, M.; Atomic Absorption Spectrometry, 3rd ed.;
Wiley-VCH: Weinheim, Germany, 1999.
13. Lima, E. C.; Krug, F. J.; Jackson, K. W.; Spectrochim. Acta, Part B 1998, 53, 1791.
14. Rosa, C. R.; Freschi, G. P. G.; de Moraes, M.; Gomes Neto, J. A.; Nóbrega, J. A.; Nogueira, A. R. A.; Food Chem. 2002, 79, 517.
15. Rosa, C. R.; de Moraes, M.; Gomes Neto, J. A.; Nóbrega, J. A.; Nogueira, A. R. A.; Sacramento, L. V.; J. Agric. Food Chem. 2003, 51, 3920.
16. Theodorolea, S.; Thomaidis, N. S.; Piperaki, E.; Anal. Chim. Acta 2005, 547, 132.
17. González-Nieto, J.; López-Sánchez, J. F.; Rubio, R.; Talanta 2006, 69, 1118.
18. Sousa, R. A.; Santos, M. C.; Baccan, N.; Cadore, S.; Food Anal. Methods 2010, 3, 31.
19. Bertelsmann, H.; Kyriakopoulos, A.; Oezaslan, M.; Hammadeh, M.; Behne, D.; Microchem. J. 2007, 85, 239. 20. Ieggli, C. V. S.; Bohrer, D.; Noremberg, S.; Nascimento, P. C.;
Carvalho, L. M.; Vieira, S. L.; Reis, R. N.; Spectrochim. Acta, Part B 2009, 64, 605.
21. Shrivas, K.; Patel, D. K.; Food Chem. 2011, 124, 1673. 22. Daftsis, E. J.; Zachariadis; G. A.; Talanta 2007, 71, 722. 23. Dobrowolski, R.; Spectrochim. Acta, Part B 1996, 51, 221. 24. Felipe-Sotelo, M.; Carlosena, A.; Andrade, J. M.; Cal-Prieto,
M. J.; Fernández, E.; Prada, D.; Microchem. J. 2005, 81, 217. 25. Acar, O.; Talanta 2005,65, 672.
26. Kılıç, Z.; Kenduzler, E.; Acar, O.; Food Chem. 2002, 77, 85. 27. Altman, T. A.; FDA and USDA Nutrition Labeling Guide:
Decision diagrams, checklist, and regulations; Technomic Publishing Co.: Lancaster, USA, 1998, ch. 5.
29. Lima, E. C.; Krug, F. J.; Jackson, K. W.; Spectrochim Acta, Part B 1998, 53, 1791.
30. Thomsen, V.; Roberts, G.; Burgess, K.; Spectroscopy 2000, 15, 33.
31. Dias, V. M. C.; Cadore, S.; Baccan, N.; J. Anal. At. Spectrom. 2003, 18, 783.
32. Zanão, R. A.; Barbosa, F.; Souza, S. S.; Krug, F. J.; Abdalla, A. L.; Spectrochim. Acta, Part B 2002, 57, 291.
33. Aleixo, P. C.; Nóbrega, J. A.; Food Chem. 2003, 83, 457. 34. Bettinelli, M.; Baroni, U.; Pastorelli, N.; J. Anal. At. Spectrom.
1988, 3, 1005.
35. Ediger, R. D.; At. Absorpt. Newsletter 1975, 14, 127. 36. Oliveira, S. R.; Oliveira, A. P.; Gomes Neto, J. A.; Food Chem.
2007, 105, 236.
37. Fariñas, M. V.; García, J. B.; Martín, S. G.; Crecente, R. M. P.; Latorre, C. H.; Food Chem. 2008, 110, 177.
Submitted: March 15, 2013
Published online: July 2, 2013