Aggregation of Aß(25-35) on DOPC and
DOPC/DHA Bilayers: An Atomic Force
Microscopy Study
Matilde Sublimi Saponetti1, Manuela Grimaldi3, Mario Scrima3, Cristiano Albonetti2,5, Stefania Lucia Nori4, Annamaria Cucolo1,2, Fabrizio Bobba1,2, Anna Maria D’Ursi3*
1.Physics Department and Research Centre for Nanomaterials and Nanotechnology, University of Salerno, Via Giovanni Paolo II, 132, 84084, Fisciano (SA), Italy,2.Institute for Superconductivity and Innovative Materials of the Italian National Research Council, Via Giovanni Paolo II, 132, 84084, Fisciano (SA), Italy,3.
Department of Pharmacy, University of Salerno, Via Giovanni Paolo II, 132, 84084, Fisciano (SA), Italy,4.
Department of Medicine and Surgery, University of Salerno, Via Salvatore Allende, 84081, Baronissi (SA), Italy,5.Institute Study Nanostructurated Materials of the Italian National Research Council, Via P. Gobetti 101, 40129, Bologna, Italy
Abstract
bamyloid peptide plays an important role in both the manifestation and progression of Alzheimer disease. It has a tendency to aggregate, forming low-molecular weight soluble oligomers, higher-molecular weight protofibrillar oligomers and insoluble fibrils. The relative importance of these single oligomeric-polymeric species, in relation to the morbidity of the disease, is currently being debated. Here we present
an Atomic Force Microscopy (AFM) study of Ab(25–35) aggregation on
hydrophobic dioleoylphosphatidylcholine (DOPC) and DOPC/docosahexaenoic 22:6 acid (DHA) lipid bilayers. Ab(25–35) is the smallest fragment retaining the biological activity of the full-length peptide, whereas DOPC and DOPC/DHA lipid bilayers were selected as models of cell-membrane environments characterized by different fluidity. Our results provide evidence that in hydrophobic DOPC and
DOPC/DHA lipid bilayers, Ab(25-35) forms layered aggregates composed of mainly
annular structures. The mutual interaction between annular structures and lipid surfaces end-results into a membrane solubilization. The presence of DHA as a membrane-fluidizing agent is essential to protect the membrane from damage caused by interactions with peptide aggregates; to reduces the bilayer defects where the delipidation process starts.
OPEN ACCESS
Citation:Sublimi Saponetti M, Grimaldi M, Scrima M, Albonetti C, Nori SL, et al. (2014) Aggregation of Aß(25-35) on DOPC and DOPC/DHA Bilayers: An Atomic Force Microscopy Study. PLoS ONE 9(12): e115780. doi:10.1371/journal.pone. 0115780
Editor:Andrea Cavalli, University of Bologna & Italian Institute of Technology, Italy
Received:April 19, 2014
Accepted:December 1, 2014
Published:December 31, 2014
Copyright:ß2014 Sublimi Saponetti et al. This is an open-access article distributed under the terms of theCreative Commons Attribution License, which permits unrestricted use, distribution, and reproduction in any medium, provided the original author and source are credited.
Data Availability:The authors confirm that all data underlying the findings are fully available without restriction. All data are within the paper.
Funding:This work was supported by fund of the University of Salerno ORSA131088. The funders had no role in study design, data collection and analysis, decision to publish, or preparation of the manuscript.
Introduction
b-amyloid plaques composed ofb-sheet-rich fibrillar aggregates of peptides Ab (1-40) and Ab(1-42), are the hallmark of the brain in Alzheimer disease (AD) patients. Ab peptides are produced in the form of soluble molecules but, in response to environmental factors, they aggregate into low-molecular-weight soluble oligomers and higher-molecular-weight protofibrillar oligomers (PFOs), which in turn give rise to insoluble fibrils, forming amyloid plaques [1–3].
Although insoluble fibrils have long been considered as being responsible for the disease, the correlation between the presence of insoluble fibrillar deposits and the manifestation of the disease is currently under debate. Conversely soluble Ab
oligomers, ranging in size from dimers up to particles of one million daltons or larger prove to correlate better with dementia [4–7], suggesting that oligomeric forms of Abmay be the primary toxic species. Soluble oligomers are recognized as the primary toxic species in AD, as well as in many other degenerative diseases, whereas the accumulation of large fibrillar deposits is considered either inert, even protective, or pathological but by different mechanisms [8–11].
In the early stages of the aggregation process, Ab(1-40) and Ab(1-42) PFOs appear as globular aggregates with diameter ranging from 3 to 10 nm, as shown by Atomic Force Microscopy (AFM) images. PFOs evolve into fibrils and plaques at a later time or, may combine to form curved strings of globular aggregates, ring- or pore-like structures, generally referred to as annular protofibrils (APFs). [7,12–
13]
The toxicity of amyloidogenic Ab protein is significantly related to its ability to interact with neuronal cell membranes: the membrane surface may be catalytic due to misfolding and aggregation of amyloidogenic proteins, and conversely amyloidogenic proteins can affect membrane structure and functionality in a still-debated mechanism that may involve membrane thinning, permeabilization, [14–
15] and delipidation. The composition and physiochemical state of the cell membrane can regulate the size and shape of Ab aggregates as well as their aggregation kinetic.
The highly unsaturated omega-3 fatty acids docosahexaenoic 22:6 (DHA) and eicosapentaenoic 20:5 (EPA) confer hyper-fluidizing properties to the membrane and enhance crucial membrane processes [16]. These compounds are found to be decreased in AD brain tissue [15], suggesting a neuroprotective role [17]. Nowadays, omega-3 fatty acids are increasingly being proposed as dietary supplements that may reduce the risk of disease development or progression [18–
20].
We previously carried out NMR studies of the syntheticb-amyloid fragments Ab(25–35) in different membrane-mimicking conditions, revealing the impact of specific membrane composition on the conformational state of soluble amyloid peptides [24–26]. Moreover, using EPR spectroscopy, we analyzed the effect of Ab(25–35) on several membrane-mimicking bilayers characterized by different composition, and in the presence of several different bioactive compounds [27–
35].
This work aims to visualize the Ab(25–35) aggregates on lipid bilayers with and without DHA by AFM performed in buffer solution,in situand in quasi real time. Ab(25-35) aggregation was investigated on three surfaces: i) freshly-cleaved mica; ii) dioleoylphosphatidylcholine (DOPC) bilayer; and iii) DOPC/DHA bilayer. The mica was used as a reference surface for Ab(25-35) aggregation, whereas DOPC and DOPC/DHA were selected as model bilayers mimicking the chemical/physical properties of the membrane environment. Our results provide evidence that in hydrophobic DOPC and DOPC/DHA lipid bilayers, Ab(25-35) forms layered aggregates composed of mainly annular structures. The mutual interaction between annular structures and lipid surfaces end-results into a membrane solubilization. The presence of DHA as a membrane-fluidizing agent is essential to protect the membrane from damage caused by interactions with peptide
aggregates; to reduces the bilayer defects where the delipidation process starts.
Materials and Methods
Materials
Dichloromethane and methanol, HPLC-grade solvents, were purchased from Merck (Darmstadt, Germany), while 1,1,1,3,3,3-hexafluoroisopropanol (HFIP) was supplied by Sigma-Aldrich (St. Louis, MO, USA). 1,2-dioleoyl-sn-glycero-3-phosphocholine (DOPC) and 1,2-didocosahexaenoyl-sn-glycero-3 phosphocho-line (22:6(cis)PC) were obtained from Avanti Polar Lipids (Birmingham, AL, USA).
Peptide synthesis
The Ab(25–35) peptide, GSNKGAIIGLM, was manually synthesized by conven-tional solid-phase chemistry using the Fmoc/tBu strategy and subsequently purified as previously reported (27) The peptide was characterized on a Finnigan LCQ Deca ion trap instrument equipped with an electrospray source (LCQ Deca Finnigan, San Jose´, CA, USA). The samples were directly infused into the ESI source using a syringe pump at a flow rate of 5 ml/min. Data were analyzed with Xcalibur software. Sample purity was .98%.
Lipid bilayer preparation
The DOPC molecule and the molecular mixture DOPC/DHA (in a ratio of 4:1) were dissolved in chloroform solutions, dried by means of nitrogen gas flow and, lastly, placed in a vacuum drier for 8 h in order to remove traces of solvent. Then, DOPC and DOPC/DHA were hydrated with a Sodium phosphate buffer solution (PBS) pH57.4 until a final concentration of 1 mg ml21 was reached. Both solutions were stirred at room temperature for dispersing the lipid suspensions and tip-sonicated for 45 minutes to obtain small unilamellar vesicles (SUVs) ranging from 40 to 50 nm [36]. To prepare the lipid bilayers, 100 ml of DOPC and DOPC/DHA SUVs solutions were drop-casted on freshly-cleaved high-grade V-1 muscovite mica discs previously glued onto a Teflon disc. After 1 hour at room temperature, the vesicle fusion process which occurs at the mica surface forms ordered and compact lipid bilayer films [37]. Therefore, the residual SUVs solutions were gradually replaced with fresh buffer in order to remove the excess lipid material and keep DOPC and DOPC/DHA bilayers fully wetted. In order to optimize the mica surface coverage (H), 20 bilayers were prepared and the lipid bilayer stability was checked by a continuous AFM imaging of the same area for about 3 hours.
Peptide deposition
For experiments under dry conditions, Ab(25-35) was dissolved in PBS (pH57.4) until a concentration of 200 mM and incubated at 37
˚
C for 7 hours. At regular time intervals (1 hour), AFM samples were prepared by dropping 10 ml of the Ab(25-35) solution onto a freshly-cleaved mica surface. After 5 minutes, samples were rinsed twice with ultrapure water, dried with nitrogen and transferred to the AFM microscope for imaging [38].For experiments under liquid conditions, Ab(25-35) was dissolved in PBS (pH57.4) up to a concentration of 20mM, then 100ml of the peptide solution was injected into the AFM fluid cell. Within the fluid cell, the peptide solution evaporates less than when exposed to the air, allowing up to 6 hours of
continuous measurements. As a rule of thumb, the aggregation process finishes when the system reaches equilibrium, viz. aggregates saturate in size and shape. We performed four experiments on mica surface and ten experiments on lipid bilayers.
Atomic Force Microscopy measurements
AFM measurements were performed using a Multimode Nanoscope V system (VEECO, Santa Barbara, CA), equipped with a 15 mm scanner (EVLR-scanner), in tapping mode configuration.
For experiments under liquid conditions, the AFM microscope used a fluid cell with an O-ring seal. AFM imaging was performed in tapping mode using silicon nitride cantilevers with a spring constant of 0.2 N/m (DNP-S VEECO) and a nominal tip radius of 10 nm. In liquid, the cantilever resonant frequency was about 7 kHz, with a quality factor Q of 20. The scan rate ranged from 1 to 2 Hz. All in-liquid AFM measurements were performed in PBS solution, in quasi real time and in situ. The time evolution of the Ab(25-35) aggregation was followed for 6 hours (at most) with time-steps of 30 minutes in the first 2 hours and every hour for the remaining 4 hours. Each AFM image takes up to 17 minutes, so experiments are de factoin quasi real time. They are alsoin situbecause the same surface area is investigated over time. The aggregation process was monitored until saturation, i.e. when the Ab(25-35) aggregates were stable in size and shape
vs. time. Ab(25-35) aggregation on the mica surface was monitored with an average tip-sample force ,Fts. of 55pN, whereas peptide aggregation on lipid
bilayers was monitored with an,Fts.well below the rupture force of the bilayer
(about 300 pN for DOPC and 150 pN for DOPC/DHA) to avoid any damage induced by the movement of the tip. Changes in ,Fts. during experiments are
reported in the Results section. Experiments were performed in a glove-box in order to keep the temperature constant (over one hour it oscillates by less than 0.3
˚
C) and to reduce any acoustic noise interferences.The arithmetic average of the absolute values of heights and depths from the height mean value of the image, commonly called Ra parameter, has been used to measure the surface roughness of images and it is indicated across the manuscript with the symbol s.
Results
Aggregation of Ab(25-35)
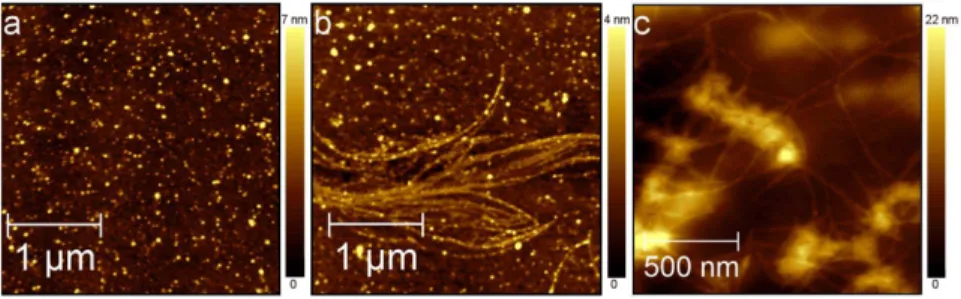
As a reference experiment, the time evolution of Ab(25-35) aggregates grown in PBS at 200 mM was monitored by AFM measurements of dry samples prepared at successive times throughout the aggregation process. After 1 hour of PBS incubation, the Ab(25-35) solution deposited on mica surface showed globular aggregates characterized by heights ranging from 2 to 13 nm (Fig. 1a). Four hours later, globular aggregates and linear protofibrils with lengths ranging from 0.5 to 5 mm were observed (Fig. 1b). Seven hours later, protofibrils had evolved into mature fibrils similar to those extensively described for the full-length peptide Ab(1-42) [39] (Fig. 1c).
Aggregation of Ab(25-35) on mica
On freshly-cleaved mica, Ab(25-35) aggregation was monitored by adding 100ml of peptide solution into the fluid cell, while AFM scans continuously for about 6 hours. From the beginning of the deposition, Ab(25-35) forms a smooth homogeneous layer which increased the roughness s of the bare mica surface from 0.06 nm to 0.11 nm.
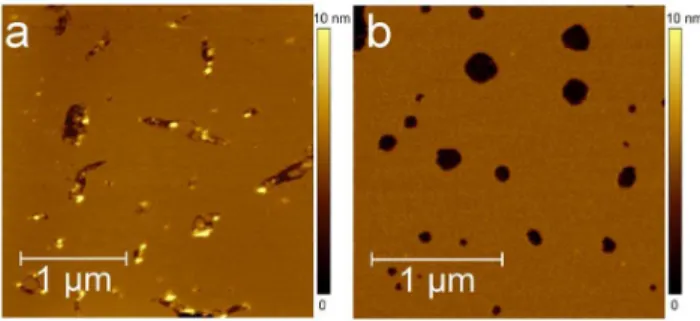
After 6 hours (Fig. 2a), we did not observe any Ab(25-35) well-formed aggregates similar to the ones discussed for Fig. 1, though on a smaller scale, (Fig. 2b) a texturing driven by protrusions such as the one highlighted by the white ellipse can be discerned. By Power Spectral Density Function (PSDF) analysis, the average protrusion size was deduced to be 50 nm [40].
Aggregation of Ab(25-35) on the DOPC bilayer
The DOPC bilayer was formed at room temperature on freshly-cleaved mica by the previously described vesicle fusion method. Before Ab(25-35) deposition, DOPC morphology was investigated in buffer solution by AFM to check mica surface coverage and lipid bilayer stability during imaging. In order to optimize the lipid coverage (HDOPC) of the mica surface, lipid bilayers were prepared
several times (seeMaterial and Methods) obtaining a maximum coverage of 96% and an average coverage of (92¡4)%.
Fig. 3ashows a DOPC bilayer covering 92% of the mica surface. Defects characterized by different shapes and sizes expose the remaining 8% of the underlying mica surface. Some lipid particles with an average diameter of 70¡7 nm and height 5¡1 nm, as evaluated by measuring the full width at half maximum (FWHM) of ten particle profiles, are collected at the border or within defects. The disrupted lipid areas were characterized with the respective profile line analysis showing a thickness of 4.5¡0.5 nm, which is consistent with the known thickness of a lipid bilayer. Following the experimental protocol reported by Atwood et al. [41], DOPC bilayer thickness was also more carefully measured by indentation curve analysis (Figure S1 in S1 File). Among all the acquired Fig. 1. Aggregation of Ab(25-35).Topographic AFM images of Ab(25-35) aggregates grown in PBS at 200mM and deposited on mica. AFM measurements were performed in tapping mode and in air. (a) After 1 hour Ab(25-35) is organized into dispersed spherical aggregates (363mm2, 6156615px2); (b) after
5 hours into beaded protofibrils (363mm2, 6156615px2); (c) after 7 hours into mature fibrils (1.561.5mm2,
3076307px2).
approaching curves only one single jump of rupture occurred, consistently with the presence of a single bilayer film. From the statistical analysis, the rupture force FB56.8¡1.1nN (Figure S2 inS1 File) and the thickness ZB-C54.3¡0.3 nm
(Figure S3 in S1 File) were deduced. DOPC stability was verified by repeating AFM scans on the same area over about 3 hours. To avoid damage to the sample or the tip, the tip-sample force,Fts.applied during scans was about 300pN, well
below the rupture force of the bilayer.
Ab(25-35) aggregation on the DOPC bilayer was monitored by injecting Ab(25-35) previously dissolved in PBS into the AFM fluid cell. This was
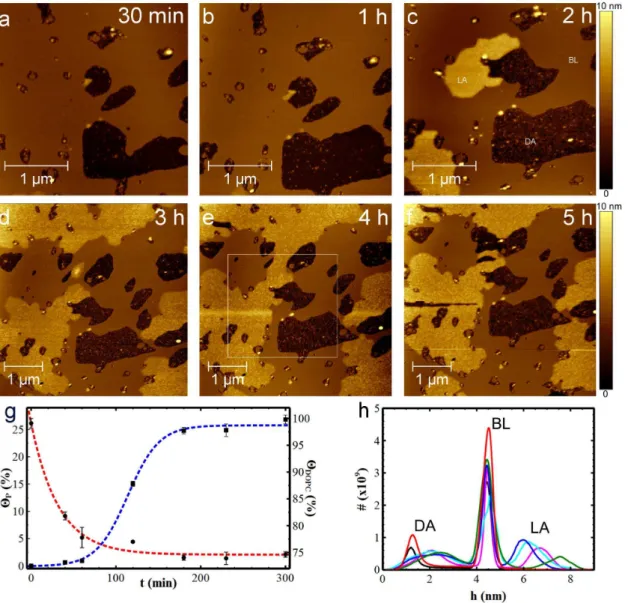
considered to be the starting time, t50, after which continuous AFM scans were carried out at different sampling times. Fig. 4a-4fshow Ab(25-35) on the DOPC bilayer at 30 min, 1 h, 2 h, 3 h, 4 h and 5 h respectively. After 30 minutes (Fig. 4a), the bilayer defects observable even in the absence of the peptide grew to 10%. At the same time, two different peptide aggregates appeared: i) layered aggregates (LA) starting from the edges of the disrupted areas and growing as an additional film on the lipid surface; and ii) disordered aggregates (DA) deposited on the mica surface of the disrupted areas.
Fig. 2. Aggregation of Ab(25-35) on mica.Topographic AFM images of Ab(25-35) aggregates grown on mica. Images were acquired in tapping mode and in PBS. (a) After 6 hours, Ab(25-35) forms a smooth homogeneous layer without any well-formed aggregates (363mm2, 245962459px2). (b) On a smaller scale
the peptide tends to organize into a texture with some discernible protrusions (white ellipse) (5006500 nm2,
122861228px2).
doi:10.1371/journal.pone.0115780.g002
Fig. 3. DOPC and DOPC/DHA lipid bilayers.(a) Height AFM images of DOPC (2.562.5mm2
Inspection ofFig. 4a-fshows the time evolution of the dimension of both lipid film and LA domains. This evolution is quantitatively evaluable in the graph in
Fig. 4g. The DOPC bilayer has a variable surface coverage,HDOPC,from a starting value of 92% at t50 min to 76% at t5100 min and, lastly, to 75% at t55 h. On the other hand, LA coverage increases slowly during the first hour, from 0.5% to 0.7% (Fig. 4a and 4b), and enlarges faster from 0.7% to 26% during the following two hours, with a linear rate of 0.2%/min (Fig. 4d). Finally, LA domains reach a Fig. 4. Ab(25-35) aggregation on DOPC lipid bilayer.363mm2 (a-c), and 565mm2 (d-f), topographic AFM images (102461024px2) showing the time
evolution of Ab(25-35) on DOPC lipid bilayer. AFM measurements were performed in tapping mode and in PBS with a continuous scanning of the same area after the addition of the peptide. Over time, Ab(25-35) forms layered aggregates (LA) on the bilayer surface, bilayer defect areas increase in size and Ab (25-35) gradually covers the disrupted areas with disordered aggregates (DA). (g) Graph showing the increase in surface area covered by LA (blue line) and the evolution of lipid bilayer over time (red line). Data were qualitatively fitted by rational and sigmoidal functions for the DOPC bilayer (hDOPC) and the LA domains (hP), respectively. Fitting curves act as a guide-to-the-eye. (h) Height distribution histograms measured at t530 min (black), 1 h (red), 2 h (green), 3 h (blue), 4 h (cyan) and 5 h (magenta). The squared dashed-line in (e) indicates the area where statistical analyses on 565mm2 AFM images were
plateau at t53 h, when equilibrium between adsorbed and desorbed peptides is reached.
Analysis of DA aggregates indicates that they essentially consist of a smooth layer of peptide showing a roughness sDA50.35 nm at t530 min [42] and
evolving to sDA50.73 nm at t5180 min.
During scanning we did not observe any accumulation of material at the edge of the image area as a consequence of tip scan motion and this was verified after enlarging the scanned area from 363 mm2 to 565 mm2.
The time evolution of LA and DA thicknesses can be measured by the height distribution plot in Fig. 4h, as deduced by a statistical analysis performed on the common subarea indicated by the squared dashed line inFig. 4e. Moreover, to compare the histograms at different times, the bilayer surface, which is the most statistically relevant surface in AFM images, was taken as reference height.
Consequently, the histograms at the different times were adjusted to fit the BL peaks at the value hBL54.5 nm. Over time, the DA peak moves towards the BL peak,
reducing their reciprocal separation from 2.9¡0.3 nm to 2.3¡0.2 nm, corre-sponding to thicknesses of the peptide layer increasing from
hDA(30 min)51.6¡0.7 nm to hDA(5 h)52.2¡1.0 nm. In addition, the DA peak
broadens from 0.4 nm at the initial time to about 1 nm for the subsequent times, as measured by FWHM, suggesting a wider size distribution of the peptide aggregates formed above the mica surface. Regarding the LA aggregates, they become visible after two hours, having an average thickness hLA(2 h)53.1¡0.9 nm, as calculated
by the separation between the LA peak and BL peak. The thickness decreases over time to the value hLA(3 h–4 h)51.6¡0.7 nm and finally reaches the value
hLA(5 h)52.2¡0.7 nm. This decrease in LA domain thickness is consistent with
re-organization phenomena similar to those observed in organic ultra-thin films [43].
Aggregation of Ab(25–35) on DOPC/DHA bilayer
The time evolution of Ab(25–35) aggregation was also studied on DOPC bilayers enriched with 20% DHA. Before Ab(25-35) deposition, the morphology of the DOPC/DHA bilayer was analyzed in buffer solution by AFM. To optimize lipid bilayer coverage (HDOPC/DHA) of the mica surface, the DOPC/DHA bilayer was prepared several times (see Material and Methods), obtaining an average surface coverage of 96¡2%, with a maximum extent of 99%. Fig. 3bshows the DOPC/ DHA bilayer before Ab(25–35) addition. The bilayer covers 96% of the mica surface with sparse defects on the remaining 4%. Analysis of indentation curves as previously described for DOPC indicates a rupture force FB54.6¡0.4nN and a
thickness ZB-C54.1¡0.1 nm (seeS1 File). The stability of the bilayer was verified
by scanning the same area for about 3 hours using an ,Fts. of about 150pN.
This force, well below the rupture force of the bilayer, did not induce any damage in the bilayer due to tip movement.
force values between DOPC and DOPC/DHA entail a change in the mechanical response of the bilayer correlated to the different lipid composition.
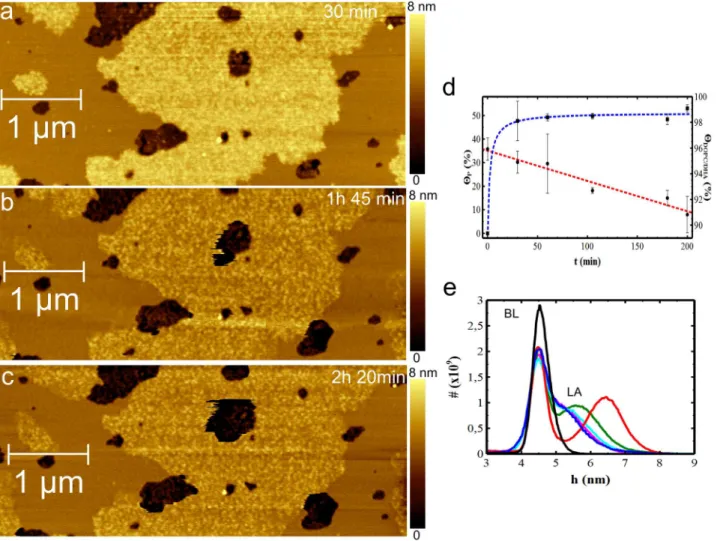
In order to monitor Ab(25-35) aggregation on the DOPC/DHA bilayer, the peptide previously dissolved in PBS was injected into the AFM fluid cell. This time was considered to be the starting time (t50). Continuous AFM scans were carried out on an area of 363 mm2 and the growth of Ab(25-35) aggregates was
monitored with sampling times of 30 min, 1 h, 1 h45 min, 2 h and 2 h20 min (Fig. 5a-c shows representative images for 30 min, 1 h45 min and 2 h20 min). Even in the case of DOPC/DHA the peptide expands as a layer above the bilayer surface. Fig. 5d shows the evolution of coverage for both lipid film and LA domains. HDOPC/DHAdecreases from 96% (t50) to 91% (t52 h20 min). LA
domains slowly increase in size, reaching an almost stable dimension (49%) after 1 hour, and 51% at the end time (t52 h20 min).
Comparison of Ab(25-35) aggregation on DOPC and on DOPC/DHA bilayers indicates that in the first 30 minutes LA domains grow faster on DOPC/DHA than on DOPC and, in addition the DOPC/DHA bilayer’s propensity to delipidate appears to be lower than in the case of DOPC.
As 30 min is a time interval comparable to the time needed to scan one image, the previous growth steps of LA domains on DOPC/DHA bilayer are not measurable under our experimental conditions.
Fig. 5eshows an overlapping of the plots relative to the height distributions for DOPC/DHA (BL) and peptide aggregates extending above the bilayer (LA). Again, the height histograms corresponding to each scanning time are fitted at the level of the BL peak that was set at the value of 4.5 nm. The DA peak is statistically negligible, hence it was not considered in the plot. At t530 min, the LA peak is already visible, measuring a thickness of hLA(30 min)51.9¡0.7 nm. After 1 hour,
LA thickness appears to have reduced to hLA(1 h)51.1¡0.8 nm while at
t51 h 45 min, the LA peak almost overlaps the BL peak, indicating a thickness of about 0.7 nm which is maintained until the experiments end at 2 h20 min.
Similarly to the case of DOPC, LA thickness initially increases but then falls, suggesting peptide re-organization in the peptide/lipid system.
LA domains
In order to understand the morphology of LA domains, high-resolution AFM images were acquired on a small scan area of 360 nm6360 nm (Fig. 6a) by
Fig. 6aand Fig. 6ccorrespond to two images of the same area scanned from right to left (Fig. 6a) and from left to right (Fig. 6c). By comparingFig. 6a and 6c, it is evident that the globular aggregates are present in both images but, as a consequence of the interaction with the tip, they appear to have shifted away from the centre of the rings, in the same direction as the tip scanning (see the cropped image insets in Fig. 6a, c).
Fig. 6e and 6f show the topographic and phase profiles measured across globular and annular aggregates respectively (white dashed line inFig. 6a, 6c). The height profile indicates that the globule is about 1.5 nm in height, whereas the annular corona protrudes about 0.2nm from the lipid surface. Note that, across the whole profile, the phase angle remains positive throughout, ranging between 6
˚
–10˚
respect to the 0˚
phase angle value centred at the resonance frequency. This Fig. 5. Ab(25-35) aggregation on DOPC/DHA lipid bilayer.(a-c) 562.2mm2(10246431px2) topographic AFM images of Ab(25-35) aggregation onmeans that by operating AFM in tapping mode with this chosen set-point amplitude, tip-sample interaction is kept always attractive both across the profile line and across the whole image (Fig. 6b, 6d) [44]. This rules out the possibility that the appearance of these linked globular and annular aggregates could be an experimental artifact due to instability of the tip-surface interaction during the image scan.
Moreover we emphasize that such soft aggregates were not modified by the repeated image scans when operating with a tip-sample force lower than 300pN.
Taken all together, these data indicate that the globular and annular structures visible in Fig. 6a, care two distinct objects and are not a consequence of contrast inversion induced by instability of the tip-surface interaction. Accordingly, the structure at the upper right-hand corner ofFig. 6ais a globular peptide aggregate positioned immediately to the right of an underlying annular structure (enlarged in the insets to Fig. 6a) and similarly the aggregate in the centre of Fig. 6a is a globular oligomer nucleated on an annular structure partially exposed on the bilayer surface.
The imaging of the complex LA domains at the bottom right-hand corner of
Fig. 6a and 6c shows that these annular aggregates favour the aggregation of further soft and less structured peptide material, forming a layer about 1.6 nm thick.
AFM images were also acquired using different tapping forces systematically varied within the range of 220-234pN. In Fig. 6g and 6h, globular aggregates composing the LA domains are imaged with an average force of 220pN and 234 pN, respectively. While the use of a 220pN tapping force does not induce any modification of the globular aggregate topography, a 234pN tapping force causes the complete removal of globular aggregates, with the simultaneous appearance of underlying annular structures. Accordingly with the previous observation (Fig. 6a, c), the globular aggregates appear positioned above the annular structures. As shown inFig. 6h, defective mechanical stripping can occur when the tapping force is applied to both globular and annular structures: i) aggregates can be fragmented so that residual peptides can fill annular structures (large white ellipse in Fig. 6g and hwhere one annular structure is missing); and ii) annular structures are filled Fig. 6. Ab(25-35) high resolution analysis.Topographic AFM images (a, c) and corresponding phase images (b, d) performed in PBS on the same area (3606360 nm2, 102461024 px2) of Ab(25-35) LA domains
on the DOPC bilayer. Images were acquired with an average tip-sample force of 170pN by scanning from left to right (a, b) and from right to left (c, d). Topographies clearly show both globular aggregates (circled) and annular structures (squared). The complex LA aggregate (arrow) in the bottom right-hand corner and the globular aggregate in the top right-hand corner (insets) are perturbed by the tip movement. (e, f) Height (black) and phase (red) line profiles of globular (e) and annular structures (f) measured along the white dashed line in Fig. 6a and 6c. (g,h) Height images of a highly dense globular structure region (2866286 nm2, 5746574px2)
acquired with two different tip-sample forces. At 220 pN (g), the globular structures are not perturbed, while at 234 pN (h) they are mechanically removed leaving the underlying annular structures. (i, l) AFM height images (7706770 nm2, 6336633 px2) of LA on two different regions of the DOPC/DHA bilayer. After 1 h45 min of
peptide deposition (i) the LA presents a linear organization highlighted by grey fibres. After 2 h20 min (l) the LA forms a structured layer where linear organization is less visible though still distinguishable. In some locations, it is organized into annular structures (red circles) similar in dimension but more sporadic and of different nature compared to the ones observed on DOPC.
by peptide and, through mechanical stripping, are depleted (the small white ellipse highlights an annular structure filled inFig. 6gthat is depleted inFig. 6h). From a statistical analysis of the radial cross-sections, annular structures with an average diameter of 20.0¡0.5 nm protrude above the lipid surface by about 1 nm.
FinallyFig. 6i and 6lshow high-resolution AFM images of LA on DOPC/DHA at t5105 min and t5140 min from Ab(25-35) deposition. At 105 minutes (Fig. 6i), the peptide layer presents a linear re-organization of material as highlighted by fiber segment analysis (SPIP software). After 140 min, the LA domain is denser throughout, while linear organization is less visible though still distinguishable, as a consequence of both the growth process and sedimentation. In some locations, the LA is organized into annular structures that even though similar in dimension to the ones observed on DOPC (red circles in Fig. 6i) are more sporadic in number and of different nature.
Discussion
The cell membrane defines a complex environment modulated by a plethora of chemical, physical and biological factors. Abpeptide amyloidogenic aggregation is affected by the size, shape and relative content of molecules in such an
environment. Indeed, the DHA molecule has recently been correlated with membrane fluidity and plasticity. In this work, AFM was used to visualize Ab(25– 35) aggregation on two surfaces with different fluidity, i.e. lipid DOPC and lipid DOPC/DHA bilayers. Experimental results are compared to the peptide grown on mica as reference surface.
Ab(25–35) corresponds to the shortest fragment able to form large b-sheet aggregate and DOPC as well as DOPC/DHA bilayers are paradigm surfaces for mimicking cell-membrane environments with different fluidities in physiological solutions. As shown in the AFM measurements performed in PBS, in situ and in real time, peptide aggregation on DOPC and DOPC/DHA forms peptide layers driven by coalescence of globular aggregates nucleated on annular structures embedded in the lipid bilayers. DHA content affects the lipid environment, hence the peptide aggregation. Indeed, the growth of peptide layers on DOPC/DHA is faster than on DOPC. Both DOPC and DOPC/DHA show annular structures that, as a matter of principle, might be associated with oligomeric rings affecting the lipid membrane environment. This is a possible toxicity mechanism ofb-amyloid peptide which damages the membrane by forming pores. [13–15]
DHA solubilization is much less evident than in DOPC. Such differences for DOPC/DHA vs. DOPC, i.e. faster LA growth and lower detergent effect, may be due to the enhanced fluidity of the DOPC/DHA bilayer that promotes aggregate mobility, layer growth and reduced solubilization.
The increased fluidity of the bilayer containing DHA also reduces defects when it is formed on mica (Fig. 3). The morphological comparison of bilayers in PBS, without peptide addition, shows that DOPC/DHA is less defective (HDOPC/DHA
varies from 94 to 98%) than DOPC which has larger defects (HDOPCfrom 88 to
96%). The pre-existence of defects may be considered an enhanced factor of bilayer sensitivity to the toxic action of the amyloid peptide. Indeed, regions where membranes are lacerated (defects) are micro-environments where LAs grow. In particular, defect edges, where phospholipids are poorly organized, are preferential sites for the detergent action of Ab(25–35) whose amphipathic properties enable it to interact with the disordered phospholipids, thus enlarging the defects.
From the experimental results, the role of DHA in the bilayer is twofold:
N
It protects the membrane from damage caused by interactions with peptide aggregates;N
It reduces the bilayer defects where the delipidation process starts.Growing evidence has been accumulating to clarify the correlation between amyloid cascade and etiology of AD: i) amyloid peptide toxicity is prevalent when early oligomers affect neuronal membrane integrity and therefore neuronal functionality. In this case, amyloid plaques may be considered non toxic but neuroprotective [45]; ii) amyloid peptide toxicity is prevalent in conditions where neuronal cell compartments, including membranes, are already damaged. These conditions may be related to chronic inflammatory diseases, according to the known role of proinflammatory molecules, interleukin 1 (IL-1b) and TNFa converting enzyme, in the etiology of AD.
In this scenario, our data provide indications that a suitable amount of unsaturated DHA fatty acids could be the preliminary condition for preventing both chronic inflammatory processes and toxic actions of amyloid peptide and other similar neurodegenerative proteins.
Supporting Information
S1 File. Figures S1-S3. Figure S1: Representative force-distance approaching curve. Figure S2: Rupture force distributions for DOPC (A) and DOPC/DHA (B). Figure S3: Statistical distribution of ZA-C and ZB-C for DOPC.
Acknowledgments
The authors thank Prof. G. Sorrentino from the University of Naples and A. Green from the University of Bari for their help and useful discussions.
Author Contributions
Conceived and designed the experiments: AMD MSS FB. Performed the
experiments: MSS CA FB MG. Analyzed the data: MSS CA FB MS. Contributed reagents/materials/analysis tools: AC AMD FB. Wrote the paper: AMD CA MSS FB. Planning of experiments: SLN.
References
1. Hardy JA, Higgins GA(1992) Alzheimer’s disease: the amyloid cascade hypothesis. Science 256, 184.
2. Kirschner DA, Abraham C, Selkoe DJ (1986) X-ray diffraction from intra neuronal paired helical filaments and extraneuronal amyloid fibers in Alzheimer disease indicates cross-beta conformation. Proc Natl Acad Sci USA 83: 503–507.
3. Kayed R, Pensalfini A, Margol L, Sokolov Y, Sarsoza F, et al. (2009) Annular protofibrils are a structurally and functionally distinct type of amyloid oligomer. J Biol Chem 284: 4230–4237.
4. Soto C, Castano EM, Frangione B, Inestrosa NC(1995) The alpha-helical to beta-strand transition in the amino-terminal fragment of the amyloid beta-peptide modulates amyloid formation. J Biol Chem 270: 3063–3067.
5. Walsh DM, Klyubin I, Fadeeva JV, Cullen WK, Anwyl R, et al.(2002) Naturally secreted oligomers of amyloid beta protein potently inhibit hippocampal long-term potentiation in vivo. Nature 416: 535–539
6. Walsh DM, Hartley DM, Kusumoto Y, Fezoui Y, Condron MM, et al. (1999) Amyloid b-protein fibrillogenesis Structure and biological activity of protofibrillar intermediates. J Biol Chem 274: 25945– 25952.
7. Harper JD, Wong SS, Lieber CM, Lansbury Jr PT (1997) Observation of metastable Abamyloid protofibrils by atomic force microscopy. Chem Biol 4: 119–125.
8. McLean CA, Cherny RA, Fraser FW, Fuller SJ, Smith MJ, et al.(1999) Soluble pool of Abamyloid as a determinant of severity of neurodegeneration in Alzheimer’s disease. Ann Neurol 46: 860–866.
9. Lue LF, Kuo YM, Roher AE, Brachova L, Shen Y, et al.(1999) Soluble amyloidbpeptide concentration as a predictor of synaptic change in Alzheimer’s disease. Am J Pathol 155: 853–862.
10. Baglioni S, Casamenti F, Bucciantini M, Luheshi LM, Taddei N, et al.(2006) Prefibrillar amyloid aggregates could be generic toxins in higher organisms. J Neurosci 26: 8160–8167.
11. Haass C, Selkoe DJ (2007) Soluble protein oligomers in neurodegeneration: lessons from the Alzheimer’s amyloidb-peptide. Nat Rev Mol Cell Biol 8: 101–112.
12. Jang H, Arce FT, Ramachandran S, Capone R, Azimova R, et al.(2010) Truncated beta-amyloid peptide channels provide an alternative mechanism for Alzheimer’s Disease and Down syndrome. Proc Natl Acad Sci U S A 107(14): 6538–43.
13. Anguiano M, Nowak RJ, Lansbury PT (2002) Protofibrillar islet amyloid polypeptide permeabilizes synthetic vesicles by a pore-like mechanism that may be relevant to type II diabetes. Biochemistry 41: 11338–11343.
14. Lin H, Bhatia R, Lal R(2001) Amyloidbprotein forms ion channels: implications for Alzheimer’s disease pathophysiology. FASEB J 15: 2433–2444.
16. Valentine RC, Valentine DL(2004) Omega-3 fatty acids in cellular membranes: a unified concept. Prog Lipid Res 43: 383–402.
17. Cole GM, Ma QL, Frautschy SA(2009) Omega-3 fatty acids and dementia. Prostaglandins Leukot Essent Fatty Acids 81: 213–221.
18. Hooijmans CR, Pasker-de Jong PC, de Vries RB, Ritskes-Hoitinga M(2012) The effects of long-term omega-3 fatty acid supplementation on cognition and Alzheimer’s pathology in animal models of Alzheimer’s disease: a systematic review and meta-analysis. J Alzheimers Dis 28: 191–209.
19. Cunnane SC, Plourde M, Pifferi F, Be´gin M, Fe´art C, et al.(2009) Fish, docosahexaenoic acid and Alzheimer’s disease. Progress Lipid Res 48: 239–256.
20. Boudrault C, Bazinet RP, Ma DW (2009) Experimental models and mechanisms underlying the protective effects of n-3 polyunsaturated fatty acids in Alzheimer’s disease. J Nutr Biochem 20: 1–10.
21. Terzi E, Hoelzemann G, Seelig J (1994) Alzheimer. beta.-Amyloid Peptide 25-35: Electrostatic Interactions with Phospholipid Membranes. Biochemistry 33: 7434–7441.
22. Pike CJ, Burdick D, Walencewicz AJ, Glabe CG, Cotman CW(1993) Neurodegeneration induced by beta-amyloid peptides in vitro: the role of peptide assembly state. J Neurosci 13: 1676–1687.
23. Pike CJ, Walencewicz-Wasserman AJ, Kosmoski J, Cribbs DH, Glabe CG, et al.(1995) Structure-Activity analyses ofb-amyloid peptides: contributions of theb25–35 region to aggregation and neurotoxicity. J Neurochem 64: 253–265.
24. Grimaldi M, Scrima M, Esposito C, Vitiello G, Ramunno A, et al.(2010) Membrane charge dependent states of theb-amyloid fragment Ab(16–35) with differently charged micelle aggregates. BBA-Biomembranes 1798: 660–671.
25. D’Ursi AM, Armenante MR, Guerrini R, Salvadori S, Sorrentino G, et al.(2004) Solution structure of amyloid beta-peptide (25-35) in different media. J Med Chem 47: 4231–4238.
26. Crescenzi O, Tomaselli S, Guerrini R, Salvadori S, D’Ursi AM, et al.(2002) Solution structure of the Alzheimer amyloid beta-peptide (1-42) in an apolar microenvironment. Similarity with a virus fusion domain. Eur J Biochem 269: 5642–5648.
27. Vitiello G, Di Marino S, D’Ursi AM, D’Errico G(2013) Omega-3 fatty acids regulate the interaction of the Alzheimer’s abeta(25-35) peptide with lipid membranes. Langmuir 29: 14239–14245.
28. Vitiello G, Grimaldi M, D’Ursi AM, D’Errico G(2012) The iAb5pb-breaker peptide regulates the Ab
(25–35) interaction with lipid bilayers through a cholesterol-mediated mechanism. Biochem Biophys Res Commun 417: 88–92.
29. Tedeschi A, D’Errico G, Lauro MR, Sansone F, Di Marino S, et al.(2010) Effect of flavonoids on the Ab(25-35)-phospholipid bilayers interaction. Eur J Med Chem 45: 3998–4003.
30. Vitiello G, Grimaldi M, Ramunno A, Ortona O, De Martino G, et al.(2010) Interaction of ab-sheet breaker peptide with lipid membranes. J Pept Sci 16: 115–122.
31. Campiglia P, Scrima M, Grimaldi M, Cioffi G, Bertamino A, et al.(2009) A new series of 1,3-dihidro-imidazo[1, 5-c]thiazole-5,7-dione derivatives: synthesis and interaction with Ab(25-35) amyloid peptide. Chem Biol Drug Des 74: 224–233.
32. Chini MG, Scrima M, D’Ursi AM, Bifulco G(2009) Fibril aggregation inhibitory activity of theb-sheet breaker peptides: a molecular docking approach. J Pept Sci 15: 229–234.
33. D’Errico G, Vitiello G, Ortona O, Tedeschi A, Ramunno A, et al. (2008) Interaction between Alzheimer’s Ab(25–35) peptide and phospholipid bilayers: The role of cholesterol. BBA-Biomembranes 1778: 2710–2716.
34. Campiglia P, Esposito C, Scrima M, Gomez-Monterrey I, Bertamino A, et al.(2007) Conformational stability of Ab(25–35) in the presence of thiazolidine derivatives. Chem Biol Drug Des 69: 111–118.
35. Esposito C, Tedeschi A, Scrima M, D’errico G, Ottaviani MF, et al.(2006) Exploring interaction ofb -amyloid segment (25–35) with membrane models through paramagnetic probes. J Pept Sci 12: 766– 774.
37. Kiessling V, Domanska MK, Murray D, Wan C, Tamm LK, et al.(2007) Supported Lipid Bilayers. Wiley Encyclopedia of Chemical Biology: John Wiley & Sons, Inc.
38. Kad NM, Myers SL, Smith DP, Smith DA, Radford SE, Thomson NH(2003) Hierarchical Assembly of ß2-Microglobulin Amyloid In Vitro Revealed by Atomic Force Microscopy. J Mol Biol 330: 785–797.
39. Harper JD, Lieber CM, Lansbury Jr PT (1997) Atomic force microscopic imaging of seeded fibril formation and fibril branching by the Alzheimer’s disease amyloid-ß protein. Chem Biol 4: 951–959.
40. Biscarini F, Ong QK, Albonetti C, Liscio F, Longobardi M, et al.(2013) Quantitative Analysis of Scanning Tunneling Microscopy Images of Mixed-Ligand-Functionalized Nanoparticles, Langmuir 29 (45): 13723–13734.
41. Attwood SJ, Choi Y, Leonenko Z (2013) Preparation of DOPC and DPPC Supported Planar Lipid Bilayers for Atomic Force Microscopy and Atomic Force Spectroscopy. Int J Mol Sci 14: 3514–3539.
42. Xu S, Miller S, Laibinis PE, Liu G (1999) Fabrication of Nanometer Scale Patterns within Self-Assembled Monolayers by Nanografting. Langmuir 15: 7244–7251.
43. Liscio F, Albonetti C, Broch K, Shehu A, Quiroga SD, et al. (2013) Molecular Reorganization in Organic Field-Effect Transistors and Its Effect on Two-Dimensional Charge Transport Pathways. ACS Nano 7: 1257–1264.
44. Garcı´a R, Pe´rez R(2002) Dynamic atomic force microscopy methods. Surf Sci Rep 47: 197–301.