ACPD
8, 20463–20500, 2008Direct and indirect radiative forcings of
dust in the LGM
T. Takemura et al.
Title Page
Abstract Introduction
Conclusions References
Tables Figures
◭ ◮
◭ ◮
Back Close
Full Screen / Esc
Printer-friendly Version
Interactive Discussion
Atmos. Chem. Phys. Discuss., 8, 20463–20500, 2008 www.atmos-chem-phys-discuss.net/8/20463/2008/ © Author(s) 2008. This work is distributed under the Creative Commons Attribution 3.0 License.
Atmospheric Chemistry and Physics Discussions
This discussion paper is/has been under review for the journalAtmospheric Chemistry
and Physics (ACP). Please refer to the corresponding final paper inACPif available.
Global distribution and radiative forcing
of soil dust aerosols in the Last Glacial
Maximum simulated by the aerosol
climate model
T. Takemura1, M. Egashira2, K. Matsuzawa2, H. Ichijo3, R. O’ishi3, and
A. Abe-Ouchi3
1
Research Institute for Applied Mechanics, Kyushu University, Fukuoka, Japan
2
Interdisciplinary Graduate School of Engineering Sciences, Kyushu Univ., Fukuoka, Japan
3
Center for Climate System Research, University of Tokyo, Chiba, Japan
Received: 12 September 2008 – Accepted: 15 October 2008 – Published: 9 December 2008 Correspondence to: T. Takemura (toshi@riam.kyushu-u.ac.jp)
ACPD
8, 20463–20500, 2008Direct and indirect radiative forcings of
dust in the LGM
T. Takemura et al.
Title Page
Abstract Introduction
Conclusions References
Tables Figures
◭ ◮
◭ ◮
Back Close
Full Screen / Esc
Printer-friendly Version
Interactive Discussion
Abstract
The integrated simulation for the global distribution and radiative forcing of soil dust aerosols in the Last Glacial Maximum (LGM) is done by an aerosol climate model, SPRINTARS, in this study. It is compared with another simulation in the present cli-mate condition. The global total emission flux of soil dust aerosols in the LGM is
5
simulated to be about 2.4 times as large as that in the present climate, and the sim-ulated deposition flux is in general agreement with estimations from ice core and ma-rine sediment samplings though it might be underestimated over the Antarctic. The calculated direct radiative forcing of soil dust aerosols in the LGM is close to zero at
the tropopause and−0.4 W m−2at the surface, which are about twice as large as those
10
in the present climate. SPRINTARS also includes the microphysical parameterizations of the cloud-aerosol interaction both for liquid water and ice crystals, which affect the radiation budget. The positive radiative forcing of the indirect effect due to soil dust aerosols, that is mainly caused by a role of ice nuclei, is simulated to be smaller in the LGM than in the present. It is suggested that atmospheric dust might contribute to
15
the cold climate during the glacial periods both through the direct and indirect effects, relative to the interglacial periods.
1 Introduction
The air temperature during the glacial and interglacial periods has been analyzed with ice cores, marine sediments, and pollens. It is assumed that the annual mean surface
20
air temperature is about 3 and 10 K lower in the Last Glacial Maximum (LGM), which is about twenty-one thousands years ago, than in the present climate over the tropics and southern Europe, respectively, and 3 to 6 K lower on the global mean (Jouzel et al., 1993; Kucera et al., 2005; Masson-Delmotte et al., 2005; Wu et al., 2007). It is thought to be impossible to quantitatively explain the remarkable low temperature and extended
25
ACPD
8, 20463–20500, 2008Direct and indirect radiative forcings of
dust in the LGM
T. Takemura et al.
Title Page
Abstract Introduction
Conclusions References
Tables Figures
◭ ◮
◭ ◮
Back Close
Full Screen / Esc
Printer-friendly Version
Interactive Discussion
the lower greenhouse gas concentrations, extended ice sheets, and feedback mech-anisms within and among the atmosphere, ocean, cryosphere, and vegetation play important roles in the LGM climate. Jansen et al. (2007) reported based on the Pa-leoclimate Modeling Intercomparison Project 2 (PMIP-2) (Braconnot et al., 2007) that
the radiative perturbation in the LGM, which do not include the effects of vegetation
5
and aerosol changes, is estimated to be−4 to−7 W m−2due to lower greenhouse gas
concentrations, extended continental ice, and lower sea level than the present climate, and that the scientific understanding of the radiative perturbation due to atmospheric mineral dust is very low.
From analyses of ice cores and sediments, it has been found that the deposition
10
flux of atmospheric soil dust aerosols varies between the glacial and interglacial peri-ods. Soil dust aerosols are considered as one of the factors inducing climate change principally through two effects. One is the direct effect in which they scatter and
ab-sorb the solar and thermal radiation. The other is the indirect effect in which they
alter the microphysical and optical properties of cloud droplets and ice crystals acting
15
as cloud condensation nuclei (CCN) and ice nuclei (IN). Soil dust is one of the
es-sential aerosols for IN although it has less effect for CCN because of hydrophobicity
in the external mixing with other aerosols. The aerosol semi-direct effect is also dis-cussed, in which aerosols that absorb the solar and/or thermal radiation, such as soil dust, warm the surrounding atmosphere, resulting in changes in the atmospheric
sta-20
bility and cloud production. Therefore the difference in the concentration of soil dust aerosols between the glacial and interglacial periods may contribute to large difference in the climate condition between them. Petit et al. (1999) indicated that the concentra-tion of soil dust aerosols in the ice core from Vostok, Antarctica is order-of-magnitude larger in the glacial than in the interglacial periods, especially in the LGM. The data of
25
ACPD
8, 20463–20500, 2008Direct and indirect radiative forcings of
dust in the LGM
T. Takemura et al.
Title Page
Abstract Introduction
Conclusions References
Tables Figures
◭ ◮
◭ ◮
Back Close
Full Screen / Esc
Printer-friendly Version
Interactive Discussion
To simulate and analyze the soil dust emission, concentration, and deposition in the LGM, several modeling studies have proceeded. Joussaume (1993) demonstrated the desert dust cycle in the LGM with an atmospheric general circulation model (AGCM), however only a weak increase was simulated. Andersen et al. (1998) simulated larger dust amounts almost everywhere over the globe in the LGM than in the present-day
5
considering variation of the soil moisture, but they were still lower than values reported from ice cores. They indicated that inclusion of more realistic boundary conditions for the dust emission (e.g., vegetation) could also improve the LGM dust cycle. Mahowald et al. (1999) showed that the simulated dust deposition flux in the LGM were roughly in agreement with observed data from marine sediments and ice cores by including
10
a difference in vegetation between the glacial and interglacial periods. They suggested that changes in source areas are required to predict any substantial increase in the dust deposition over the polar region. Werner et al. (2002) suggest from their simulation that one third of an increase in the total global dust emission flux in the LGM is related to source-region changes, while two thirds is caused by glacial wind speed changes over
15
modern dust emission regions. Mahowald et al. (2006) indicated that the impact of
CO2 fertilization on arid vegetation and the glaciogenic dust sources are sensitive to
dust sources. Mentioned above, the previous studies have improved the reproductivity of the atmospheric dust condition in the LGM by the simulations.
Soil dust aerosols affect the radiation budget through the direct and indirect effects
20
as mentioned above, so that they may have important potential to compound the
cli-mate system in the glacial period. The PMIP-2, however, did not treat the dust effects
on the climate system as well as the coupled ocean-atmosphere system. Claquin et al. (2003) simulated the direct radiative forcing of dust based on Mahowald et al. (1999). In this study, the radiative forcings both of the direct and indirect effects by soil
25
ACPD
8, 20463–20500, 2008Direct and indirect radiative forcings of
dust in the LGM
T. Takemura et al.
Title Page
Abstract Introduction
Conclusions References
Tables Figures
◭ ◮
◭ ◮
Back Close
Full Screen / Esc
Printer-friendly Version
Interactive Discussion
general circulation model. One of the significant features of this study is inclusion of the interaction between ice crystals and aerosol particles in order to calculate the aerosol indirect effect. The model description is given in Sect. 2. Section 3 shows the simulated emission, distribution, and deposition of soil dust aerosols as well as sea salt aerosols both in the LGM and present-day. The simulated deposition fluxes of soil dust aerosols
5
are compared with their estimations from ice cores and marine sediments in order to understand reproductivity and problems of the present model. Section 4 presents the calculated direct and indirect radiative forcings of soil dust aerosols and discuss their effects on the climate system in the LGM. This study is concluded in Sect. 5.
2 Model description
10
In this study, global distributions and radiative forcings of aerosol particles in the LGM climate condition are simulated by SPRINTARS (Takemura et al., 2000, 2002, 2005). It is fully coupled with an AGCM developed by the Center for Climate System Research (CCSR)/University of Tokyo, National Institute for Environmental Studies (NIES), and Frontier Research Center for Global Change (FRCGC) (K-1 Model Developers, 2004).
15
In this study, the horizontal resolution is T42 (approximately 2.8◦ by 2.8◦ in latitude and longitude) and the vertical resolution is 20 layers (sigma levels based on the sur-face pressure at 0.995, 0.980, 0.950, 0.900, 0.830, 0.745, 0.650, 0.549, 0.454, 0.369, 0.295, 0.230, 0.175, 0.124, 0.085, 0.060, 0.045, 0.035, 0.025, and 0.008).
SPRINTARS predicts mass mixing ratios of the main tropospheric aerosols, that is,
20
carbonaceous (black carbon (BC) and organic carbon (OC)), sulfate, soil dust, and sea salt, and the precursor gases of sulfate, that is, sulfur dioxide (SO2) and
dimethylsul-fide (DMS). The aerosol transport processes include emission, advection, diffusion,
sulfur chemistry, wet deposition, dry deposition, and gravitational settling. The emis-sion flux of soil dust aerosols depends on the near-surface wind speed, vegetation,
25
ACPD
8, 20463–20500, 2008Direct and indirect radiative forcings of
dust in the LGM
T. Takemura et al.
Title Page
Abstract Introduction
Conclusions References
Tables Figures
◭ ◮
◭ ◮
Back Close
Full Screen / Esc
Printer-friendly Version
Interactive Discussion
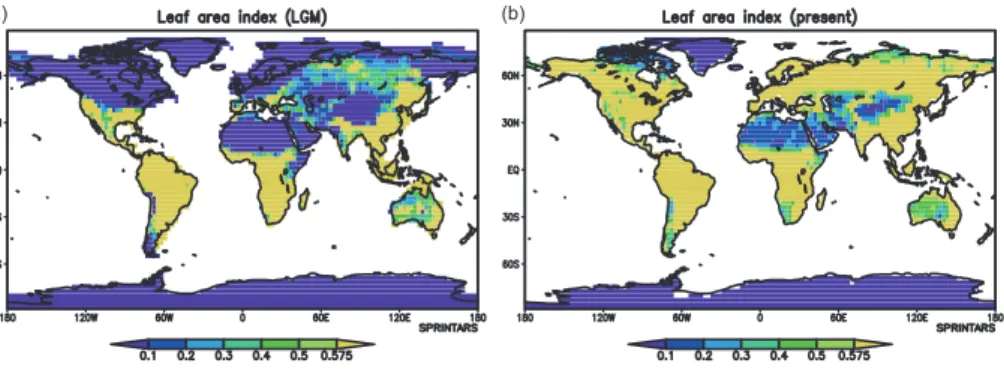
CCSR/NIES/FRCGC AGCM coupled with the Lund-Potsdam-Jena Dynamic Global Vegetation Model (LPJ-DGVM) (Sitch et al., 2003; Gerten et al., 2004). The poten-tial vegetation types for dust emission are wooded c4 grassland, bare ground/shrub, tundra, and warm grassland/shrub in this study (Fig. 1). The bare ground/shrub in the LGM expands over the inland Asia, Middle and Near East, and southern Sahara in
5
comparison with the present condition. The tundra also increases in the LGM, which is partly due to expansion of land because of sea level falling, although there are large-scale ice sheets over the North America and Northern Europe. The prescribed vegeta-tion distribuvegeta-tion in the LGM is confirmed to be in general agreement with reconstrucvegeta-tion data (Harrison and Prentice, 2003). Figure 2 shows the annual mean LAI distribution,
10
and it is possible to emit soil dust aerosols if the LAI is less than about 0.575 accord-ing to Eqs. (A3)–(A4). The other natural emissions included in this study is sea salt
aerosols (see Appendix B), BC, OC, and SO2from biomass burning, OC from the
gas-to-particle conversion of terpene (Guenther et al., 1995), and dimethylsulfide (DMS) from oceanic phytoplankton and land. The global distribution of emission for biomass
15
burning BC is based on the monthly mean data of the Global Fire Emissions Database version 2 (GFEDv2) from the year 1997 to 2006 (Randerson et al., 2005), and the nat-ural sources are assumed to be 10% of the total GFEDv2 emission (Andreae, 1991). The natural emissions of BC and OC mentioned above are assumed to be the same between the simulations for the LGM and a present climate condition. A scheme of the
20
DMS emission from oceanic phytoplankton which is a function of the downward surface solar radiation is the same as Takemura et al. (2000) and that from land vegetation and soil which is function of LAI, solar zenith angle, and temperature is according to Spiro et al. (1992). The other transport processes are according to Takemura et al. (2000, 2002, 2005).
25
ACPD
8, 20463–20500, 2008Direct and indirect radiative forcings of
dust in the LGM
T. Takemura et al.
Title Page
Abstract Introduction
Conclusions References
Tables Figures
◭ ◮
◭ ◮
Back Close
Full Screen / Esc
Printer-friendly Version
Interactive Discussion
refractive indices of dry aerosols and water are according to Deepak and Gerber (1983) and d’Almeida et al. (1991), respectively, except the imaginary part of soil dust aerosols which is a quarter of values in Deepak and Gerber (1983) because their weaker ab-sorption of the solar radiation has been recently reported (e.g., Kaufman et al., 2001).
The detailed description of the aerosol direct effect in SPRINTARS is in Takemura et
5
al. (2002, 2005).
The aerosol indirect effect is also included both for water and ice clouds in SPRINT-ARS. The cloud droplet and ice crystal number concentrations are prognostic variables. The nucleation of the cloud droplets depends not only on the aerosol particle number concentrations but also on the size distributions, curvature effect, and solute effect of
10
each kind of aerosol, and the updraft velocity. The nucleation of the ice crystal num-ber concentration includes both the homogeneous and heterogeneous processes (see Appendix C). The growth and collision processes for cloud droplets and ice crystals are described also in Appendix C. Changes in the cloud droplet and ice crystal num-ber concentrations induce changes in the cloud droplet and ice crystal effective radii,
15
respectively, that is the first indirect effect, which result in a change in the radiation bud-get. The precipitation rate for warm rain is according to the Berry’s parameterization depending on the cloud droplet number concentration, that is the second indirect effect.
The detailed description of the aerosol indirect effect for water coluds in SPRINTARS
is in Takemura et al. (2005). Note that a change in the precipitation rate for cold rain is
20
not included in the present version of SPRINTARS.
The initial condition and the climatological monthly mean data of SST and sea ice in the LGM are prescribed with the simulated result by the CCSR/NIES/FRCGC atmo-sphere-ocean coupled general circulation model (AOGCM), MIROC (Model for Inter-disciplinary Research on Climate) which is based on PMIP-2 (Yanase and Abe-Ouchi,
25
2007). The model result shows about 2.5 to 3 K SST change in the low latitude and about 5 K global change, which is in the range of uncertainty of reconstructed data
of different proxies and also comparable performance to other coupled AOGCMs in
ref-ACPD
8, 20463–20500, 2008Direct and indirect radiative forcings of
dust in the LGM
T. Takemura et al.
Title Page
Abstract Introduction
Conclusions References
Tables Figures
◭ ◮
◭ ◮
Back Close
Full Screen / Esc
Printer-friendly Version
Interactive Discussion
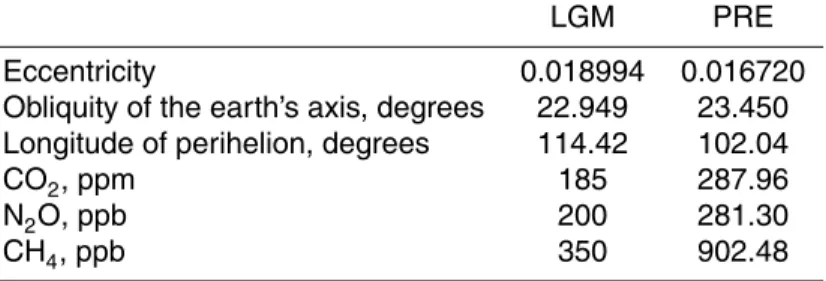
erence simulation SPRINTARS also calculates global distributions and radiative forc-ings of aerosols in the pre-industrial era as a present climate condition (PRE). The HadISST (Rayner et al., 2003) averaged from the year 1870 to 1879 is used as the monthly SST and sea ice in the PRE simulation. The solar radiative flux at the top of the atmosphere is calculated with the eccentricity, obliquity of the earth’s axis, and
5
longitude of perihelion (Table 1). The atmospheric CO2, N2O, and CH4concentration
are set to be constant globally and annually (Table 1). Each experiment is integrated for 6 years and analyzed for the last 5 years.
3 Aerosol emission, distribution, and deposition in the LGM
Figure 3a and b shows simulated global distributions of the annual dust emission in
10
the LGM and PRE, respectively. In the PRE, the main emission sources are distributed
between 50◦N to 40◦S; the Sahara, Middle East, Central Asia, Kalahari Desert,
Patag-onia, and Australia. In the LGM, they expand into south over the Sahara and into north over the Eastern Europe and Central Asia due to extended arid regions (Fig. 1). The other sources appear over the northern Siberia during the glacial period because of the
15
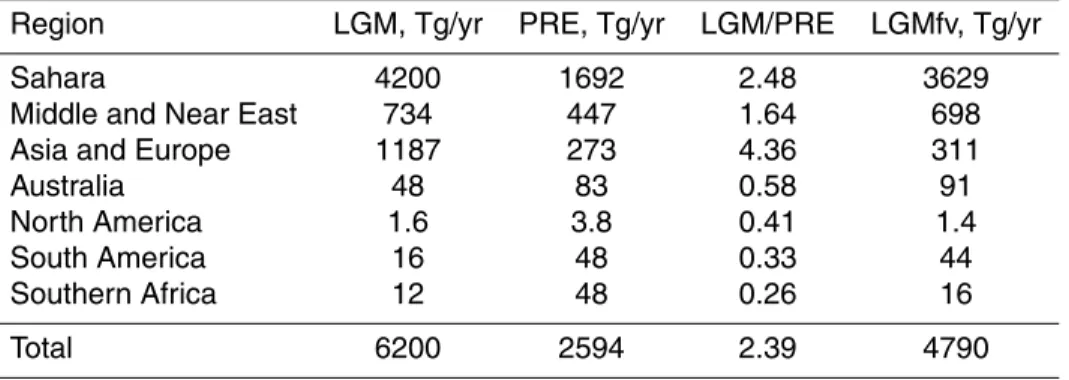
sea level falling. As well as expansion of emission sources, the dust emission flux is also larger over the Sahara, Middle and Near East, Asia, and Europe in the LGM than in the PRE (Table 2). The global total flux in the LGM is calculated to be 6200 Tg/yr, about 2.4 times as large as that in the PRE. Werner et al. (2002) estimated 2.2-fold higher dust emission flux in the LGM, which is close to this study, though their
estima-20
tion of the total flux was smaller (2383 Tg/yr). The dust emission flux under the present climate condition was estimated to be 2594 Tg/yr in this study, which is in agreement with most past studies, ranging about from 1500 to 3000 Tg/yr (e.g., Tegen and Fung, 1994; Dentener et al., 1996; Chin et al., 2002; Tanaka and Chiba, 2005), while Werner et al. (2002) estimated it to be 1060 Tg/yr.
25
ACPD
8, 20463–20500, 2008Direct and indirect radiative forcings of
dust in the LGM
T. Takemura et al.
Title Page
Abstract Introduction
Conclusions References
Tables Figures
◭ ◮
◭ ◮
Back Close
Full Screen / Esc
Printer-friendly Version
Interactive Discussion
separate the influence of extended arid regions from the other meteorological factors on the dust emission flux, an additional experiment (LGMfv) is done with the present-day vegetation distribution as shown in Fig. 1b and with the same conditions as LGM for others. Table 2 shows that the large emission flux of soil dust aerosols in the LGM is
more affected by the meteorological condition than the vegetation over the Sahara and
5
Middle and Near East, and vice versa over Asia and Europe. The simulation suggests that about 60% of the increase in the global total dust emission in the LGM relative to PRE is due to a difference in the meteorological condition, especially the strong wind, and the other is due to a difference in vegetation. These rations of contributing to an increase in the LGM dust emission are close to those in Werner et al. (2002).
10
Figure 3c and d shows simulated global distributions of the annual dust column load-ing in the LGM and PRE, respectively, and Table 3 shows zonal column loadload-ing and deposition flux of soil dust aerosols. Those emitted from the Sahara are transported to west by the trade winds and from Asia to east by the westerlies. The atmospheric dust loading is larger in the LGM than in the present all over the Northern Hemisphere,
15
especially in the high latitudes mainly due to expansion of the emission sources. The distribution of the dust deposition flux is similar to that of the mass column loading (not shown). The zonal mean mass column loading and deposition flux in the LGM are
about 7 and 20 times, respectively, as large as those in the present between 90◦N and
60◦N, and 2 to 3 times between 60◦N to 0◦. The ratio of the dry deposition to the total
20
deposition flux is high near the source regions, and the wet deposition becomes a pre-dominant deposition process with being away from the sources. One of the simulated characteristics in the LGM is a high ratio of the dry deposition in the high latitudes of the Northern Hemisphere. Ratio of the dry deposition is also larger in the LGM in the low- and mid-latitude of the Northern Hemisphere than in the PRE because of the drier
25
atmospheric condition in the LGM as well as the larger mass column loading.
ACPD
8, 20463–20500, 2008Direct and indirect radiative forcings of
dust in the LGM
T. Takemura et al.
Title Page
Abstract Introduction
Conclusions References
Tables Figures
◭ ◮
◭ ◮
Back Close
Full Screen / Esc
Printer-friendly Version
Interactive Discussion
marine sediments. It is best database for understand the simulated results, though there are some uncertainty factors, for example, that the fluxes from ice cores rely on estimates of ice accumulation rate in the cores and that ocean currents can advect dust substantially before it is deposited (Kohfeld and Harrison, 2001; Mahowald et al., 2006). It has been suggested from DIRTMAP that the dust deposition fluxes during the
5
LGM are 2 to 5 times as large as those during interglacial periods in the tropical and mid-latitudes, and over 20 times in the polar regions. Figure 4 shows comparisons of the annual dust deposition fluxes between DIRTMAP and the simulation by SPRINT-ARS in the LGM and PRE. They are in general agreement in the PRE, though there is a little underestimation over the Indian Ocean. Also in the LGM, the simulation
gen-10
erally captures the five order of magnitude range in the deposition fluxes except the Antarctic region. The isotopic measurement has suggested that the ice-core dust in the Antarctic during glacial periods have a primary origin from Patagonia with a small amount (10 to 15%) from southern Africa and/or Australia (Basile et al., 1997). There are three possible reasons for underestimating the dust emission from Patagonia in the
15
LGM simulated in this study as shown in Fig. 3 and Table 2. The first is inappropriate vegetation indices and underestimation of emerging land due to the sea level falling
because there is a large difference in the emission flux from the South America
be-tween the LGM and LGMfv. The second is underestimation of wind speed because the emission flux in the LGMfv experiment is smaller than in the PRE, in spite of vice versa
20
in the Northern Hemisphere. The other additional reason is underestimation of precip-itation, because the deposition flux over the high latitudes of the Southern Hemisphere in the LGM is a half of that in the present though the mass column loading in the LGM is a little larger than that in the present and because the wet deposition is a primary process in the total dust deposition (Table 3).
25
ACPD
8, 20463–20500, 2008Direct and indirect radiative forcings of
dust in the LGM
T. Takemura et al.
Title Page
Abstract Introduction
Conclusions References
Tables Figures
◭ ◮
◭ ◮
Back Close
Full Screen / Esc
Printer-friendly Version
Interactive Discussion
present in the tropics and mid-latitudes, though the emission flux in the LGM is slightly larger due to the stronger wind. On the other hand, the emission is prevented by
ex-tended sea ice in the LGM in the high latitudes. This study cannot analyze differences
in natural carbonaceous and sulfate aerosols between the LGM and PRE because their setup is almost same both in the simulations.
5
4 Dust radiative forcing in the LGM
The direct radiative forcing of soil dust aerosols is calculated as a difference in the radiative budget between inclusion and exclusion of soil dust aerosol in the radiative process within one simulation. Figure 6 shows the annual mean distributions of the direct radiative forcing due to soil dust aerosols under the all-sky condition. The
forc-10
ing at the tropopause is basically negative over oceanic and forest areas, while it is positive over arid regions due to high surface albedo. Even over the ocean where the surface albedo is low, it is partly positive, in spite of small values, because soil dust aerosols multiply absorb scattered solar radiation enhanced by the lower cloud layer than the aerosol layer. It has been known that the aerosol direct radiative forcing at
15
the tropopause and top of the atmosphere is much sensitive to the vertical structure of cloud layers for aerosol species absorbing the solar radiation (Haywood and Ra-maswamy, 1998; Takemura et al., 2002). A significant characteristic in the LGM is the strong positive forcing over the northern Europe and Arctic Ocean due to extended and continuous ice sheets and sea ice through the year. At the surface, the direct radiative
20
forcing is negative almost over the globe because the solar radiation is attenuated at the surface whether soil dust aerosols scatter or absorb it. The negative forcing is gen-erally in correspondence to the column loading (Fig. 3c and d) and larger in the LGM than in the present.
Table 5 shows the annual global mean direct forcing both under the clear-sky and
25
ACPD
8, 20463–20500, 2008Direct and indirect radiative forcings of
dust in the LGM
T. Takemura et al.
Title Page
Abstract Introduction
Conclusions References
Tables Figures
◭ ◮
◭ ◮
Back Close
Full Screen / Esc
Printer-friendly Version
Interactive Discussion
radiation with lower cloud layer as mentioned above and due to absorption of the ter-restrial radiation by clouds, respectively. A difference in the global mean direct forcing between the LGM and PRE both in the shortwave and longwave radiation is
approxi-mately proportional to a difference in the emission flux and column loading (Tables 2
and 3). In the LGM, the direct radiative forcing of soil dust aerosols is close to zero at
5
the tropopause and−0.4 W m−2at the surface.
The indirect radiative forcing of soil dust aerosols in the LGM is also estimated in this study. Soil dust aerosols play an important role as ice nuclei in forming ice crys-tals through the heterogeneous nucleation (Lohmann and Feichter, 2005), though they
are not much effective in forming water cloud droplets. Appendix C shows the
micro-10
physical treatment for the relationship between ice crystals and aerosol particles in the model. The indirect radiative forcing is calculated as a difference in the cloud ra-diative forcing between inclusion and exclusion of the dust emission. Figure 7 shows the annual mean distribution of the indirect radiative forcing due to soil dust aerosols both in the LGM and PRE. Inclusion of soil dust aerosol as ice nuclei results in smaller
15
ice crystals, which leads to absorption of the longwave radiation more effectively than scattering of the shortwave radiation. Therefore the indirect forcing is positive at the tropopause almost over the globe. At the surface, on the other hand, attenuation of the shortwave radiation due to the smaller ice crystals is prominent. The indirect radiative
forcing is large where the ice water content is large. The obvious difference between
20
the LGM and PRE is the large positive forcing at the tropopause and the large negative forcing at the surface in the PRE, especially over the tropics because of the reduced ice crystal concentration due to inactive convection in the LGM.
The global mean indirect forcing is larger in the PRE at the tropopause both in the negative shortwave and positive longwave radiations than in the LGM though the dust
25
ACPD
8, 20463–20500, 2008Direct and indirect radiative forcings of
dust in the LGM
T. Takemura et al.
Title Page
Abstract Introduction
Conclusions References
Tables Figures
◭ ◮
◭ ◮
Back Close
Full Screen / Esc
Printer-friendly Version
Interactive Discussion
in the LGM (+2.0 W m−2) is smaller than that in the PRE (+2.9 W m−2), therefore atmo-spheric dust might contribute to the cold climate during the glacial periods through the indirect effect as well as the direct effect relative to the interglacial periods.
5 Conclusions
Global dust distribution and radiative forcings both of the direct and indirect effect in the
5
LGM were simulated by the global aerosol climate model, SPRINTARS, in this study. The global total dust flux in the LGM is calculated to be about 2.4 times as large as that in the present climate mainly because of the extended arid regions and strong wind. The simulated dust deposition flux was in general agreement with estimations from ice core and marine sediment samplings. Further studies are, however, needed
10
to solve underestimation of the simulated dust deposition over the Antarctic through, for example, detailed sensitivity experiments for analyzing what important factors are to determine the emission, atmospheric loading, and deposition of soil dust aerosols. The global mean negative value of the direct radiative forcing due to soil dust aerosols at the tropopause in the LGM was simulated to be larger than that in the present climate,
15
and the positive value of the indirect effect in the LGM was smaller. Therefore this
study suggested that they contribute to the lower temperature during the glacial periods relative to the interglacial periods.
The detailed and progressive studies with atmosphere-ocean coupled general cir-culation models or earth system models will be important to quantitatively analyze the
20
effects of atmospheric dust on the climate system including feedback processes in the
ACPD
8, 20463–20500, 2008Direct and indirect radiative forcings of
dust in the LGM
T. Takemura et al.
Title Page
Abstract Introduction
Conclusions References
Tables Figures
◭ ◮
◭ ◮
Back Close
Full Screen / Esc
Printer-friendly Version
Interactive Discussion
Appendix A
Emission flux of soil dust aerosols
A scheme of the emission mass flux of soil dust aerosolsFed in this study has been
improved from the previous version of SPRINTARS (Takemura et al., 2000):
5
Fed =
AeC |v10| −ut
|v10| 2
for |v10| ≥ut
0 for |v10|< ut
, (A1)
where |v10| is the wind speed at 10-m height, ut is the threshold velocity set to be
6.5 m s−1, C is the emission coefficient depending on the soil moisture Wg, snow
amountWs, and region defined as,
C=
(
CdWgt−Wg
Wgt forWg ≤Wgt andWs ≤Wst
0 for others
, (A2)
10
whereCd,Wgt are the coefficient and threshold soil moisture depending on the region andWstis the threshold snow amount, andAeis the effective area in emitting soil dust
aerosols according to Tegen et al. (2002):
Ae=
1−FPAR for FPAR≤0.25
0 for FPAR>0.25 , (A3)
FPAR=1−exp (−0.5×LAI), (A4)
15
ACPD
8, 20463–20500, 2008Direct and indirect radiative forcings of
dust in the LGM
T. Takemura et al.
Title Page
Abstract Introduction
Conclusions References
Tables Figures
◭ ◮
◭ ◮
Back Close
Full Screen / Esc
Printer-friendly Version
Interactive Discussion
Appendix B
Emission flux of sea salt aerosols
A scheme of the emission mass flux of sea salt aerosolsFes in this study has been
changed from the previous version of SPRINTARS (Takemura et al., 2000). The new
5
scheme is based on Monahan et al. (1986):
d Fes dr =
4
3πρsa|v10|
b
r−31+crd×10fexp
h
−{(g−logr)/h}2i
, (B1)
wherer andρsare the radius and density of sea salt aerosol, respectively, anda,b,c,
d,f,g, andhare constants according to Monahan et al. (1986). SPRINTARS predicts
the mass mixing ratio of sea salt aerosols dividing radii into 4 bins from 0.1 to 10 µm
10
(Table 1).
Appendix C
Parameterization of interaction between aerosols and ice crystals
The latest version of SPRINTARS treats the cloud droplet number concentrationnl and
15
ice crystal number concentrationni as prognostic variables:
∂nl
∂t =R(nl)+Nnuc−Nsel−Nf rc−Nf ri− nl ql
(Qaut+Qarl +Qasl), (C1)
∂ni
∂t =R(ni)+Nf rh+Nf rc+Nf ri −Nagg− ni
qiQasi, (C2)
whereR indicates the advection and diffusion terms,ql and qi are the in-cloud mass
mixing ratios of cloud water and ice, respectively, and the time-varying terms N and
20
ACPD
8, 20463–20500, 2008Direct and indirect radiative forcings of
dust in the LGM
T. Takemura et al.
Title Page
Abstract Introduction
Conclusions References
Tables Figures
◭ ◮
◭ ◮
Back Close
Full Screen / Esc
Printer-friendly Version
Interactive Discussion
homogeneous freezing of supercooled aerosols, Nf rc is the contact freezing, Nf ri is
the immersion/condensation freezing,Nsel is the self-collection of cloud droplets,Nagg
is the aggregation of ice crystals,Qaut is the autoconversion of cloud droplets,Qarl and Qasl are the accretion of cloud droplets by rain and snow, respectively, andQasi is the
accretion of ice crystals by snow. The nucleation of cloud dropletsNnuc is according
5
to Eqs. (1)–(4) in Takemura et al. (2005). The homogeneous freezingNf rhis based on
K ¨archer and Lohmann (2002). BC and soil dust aerosols act as IN for the heteroge-neous freezing including the contact and immersion/condensation processes. Ratios of activated IN to the total number concentration of BC and dust for the contact freezing
ff rcand the immersion/condensation freezingff ri are based on Fig. 1 in Lohmann and
10
Diehl (2006):
ff rc=ac(273.15−T)−bc, (C3)
ff ri =
exp
( −
Ti0−T
Ti 2)
forT ≥Ti0
1 forT < Ti0
, (C4)
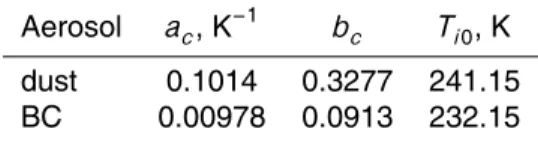
whereTis the temperature in K,ac,bc,Ti0are constants depending on aerosol species (Table 1), andTi =3 K. The terms ofNf rcandNf ri are according to Lohmann and Diehl
15
(2006) and Diehl et al. (2006). The deposition freezing is neglected in this study be-cause it generally takes place at lower temperatures and higher supersaturation than the other heterogeneous freezing processes (Lohmann and Diehl, 2006). The self-collection of cloud dropletsNsel and the aggregation of ice crystalsNagg are following
Lohmann et al. (1999) and Levkov et al. (1992), respectively. The Berry’s
parameteri-20
zation (Berry, 1967) is adopted as the autoconversion of cloud dropletsQaut (Eq. (6) in Takemura et al., 2005). The accretion of cloud droplets by rain and snow is calculated as:
ACPD
8, 20463–20500, 2008Direct and indirect radiative forcings of
dust in the LGM
T. Takemura et al.
Title Page
Abstract Introduction
Conclusions References
Tables Figures
◭ ◮
◭ ◮
Back Close
Full Screen / Esc
Printer-friendly Version
Interactive Discussion
whereFpis the in-cloud flux of rain or snow andEl is a constant, 1.0 for rain and 0.5 by snow. The accretion of ice crystals by snow is also calculated as:
Qasi =FpEiqi, (C6)
whereEi is 0.05.
Acknowledgements. We would like to thank the contributors of development of SPRINTARS
5
and MIROC, DIRTMAP investigators, and anonymous reviewers. The simulation in this study was performed by the NIES supercomputer system (NEC SX-8R). This study is supported by the Grant-in-Aid for Young Scientists of the Ministry of Education, Culture, Sports, Science, and Technology of Japan.
References
10
Andersen, K. K., Armengaud, A., and Genthon, C.: Atmospheric dust under glacial and inter-glacial conditions, Geophys. Res. Lett., 25, 2281–2284, 1998. 20466
Andreae, M. O.: Biomass burning: Its history, use, and distribution and its impact on environ-mental quality and global climate, in: Global Biomass Burning: Atmospheric, Climatic, and Biospheric Implications, edited by: Levine, J. S., MIT Press, Cambridge, Mass., USA, 3–21,
15
1991. 20468
Basile, I., Grousset, F. E., Revel, M., Petit, J. R., Biscaye, P. E., and Barkov, N. I.: Patagonian origin of glacial dust deposited in East Antarctica (Vostok and Dome C) during glacial stages 2, 4 and 6, Earth Planet. Sc. Lett., 146, 573–589, 1997. 20472
Berry, E. X.: Cloud droplet growth by collection, J. Atmos. Sci., 24, 688–701, 1967. 20478
20
Braconnot, P., Otto-Bliesner, B., Harrison, S., Joussaume, S., Peterchmitt, J.-Y., Abe-Ouchi, A., Crucix, M., Driesschaert, E., Fichefet, Th., Hewitt, C. D., Kageyama, M., Kitoh, A., Laˆın ´e, A., Loutre, M.-F., Marti, O., Merkel, U., Ramstein, G., Valdes, P., Weber, S. L., Yu, Y., and Zhao, Y.: Results of PMIP2 coupled simulations of the Mid-Holocene and Last Glacial Maximum – Part 1: experiments and large-scale features, Clim. Past, 3, 261–277, 2007,
25
http://www.clim-past.net/3/261/2007/. 20465
GO-ACPD
8, 20463–20500, 2008Direct and indirect radiative forcings of
dust in the LGM
T. Takemura et al.
Title Page
Abstract Introduction
Conclusions References
Tables Figures
◭ ◮
◭ ◮
Back Close
Full Screen / Esc
Printer-friendly Version
Interactive Discussion
CART model and comparisons with satellite and sun photometer measurements, J. Atmos. Sci., 59, 461–483, 2002. 20470
Claquin, T., Roelandt, C., Kohfeld, K. E., Harrison, S. P., Tegen, I., Prentice, I. C., Balkanski, Y., Bergametti, G., Hansson, M., Mahowald, N., Rodhe, H., and Schulz, M.: Radiative forcing of climate by ice-age atmospheric dust, Clim. Dynam., 20, 193–202, 2003. 20466
5
d’Almeida, G. A. and Sch ¨utz, L.: Number, mass and volume distributions of mineral aerosol and soils of the Sahara, J. Clim. Appl. Meteorol., 22, 233–243, 1983. 20476
d’Almeida, G. A., Koepke, P., and Shettle, E.: Atmospheric Aerosols: Global Climatology and Radiative Forcing, A. Deepak, Hampton, Va., USA, 561 pp., 1991. 20469
Deepak, A. and Gerber, H. G. (Eds.): Report of the experts meeting on aerosols and their
10
climatic effects, World Meteorological Organization, Geneva, Switzerland, Rep. WCP-55, 107 pp., 1983. 20469
Dentener, F. J., Carmichael, G. R., Zhnag, Y., Lelieveld, J., and Crutzen, P. J.: Role of mineral aerosol as a reactive surface in the global troposphere, J. Geophys. Res., 101, 22 869– 22 889, 1996. 20470
15
Diehl, K., Simmel, M., and Wurzler, S.: Numerical sensitivity studies on the impact of aerosol properties and drop freezing modes on the glaciation, microphysics, and dynamics of clouds, J. Geophys. Res., 111, D07202, doi:10.1029/2005JD005884, 2006. 20478
Gerten D., Schaphoff, S., Haberlandt, U., Lucht, W., and Sitch, S: Terrestrial vegetation and water balance: Hydrological evaluation of a dynamic global vegetation model, J. Hydrol.,
20
286, 249–270, 2004. 20468
Guenther, A., Hewitt, C. N., Erickson, D., Fall, R., Geron, C., Graedel, T., Harley, P., Klinger, L., Lerdau, M., McKay, W. A., Pierce, T., Scholes, B., Steinbrecher, R., Tallamraju, R., Taylor, J., and Zimmerman, P.: A global model of natural volatile organic compound emissions, J. Geophys. Res., 100, 8873–8892, 1995. 20468
25
Harrison, S. P., Kohfeld, K. E., Roelandt, C., and Claquin, T.: The role of dust in climate changes today, at the last glacial maximum and in the future, Earth-Sci. Rev., 54, 43–80, 2001. 20465 Harrison, S. P. and Prentice, I. C.: Climate and CO2controls on global vegetation distribution at the last glacial maximum: analysis based on palaeovegetation data, biome modelling and palaeoclimate simulations, Global Change Biol. 9, 983–1004, 2003. 20468
30
ACPD
8, 20463–20500, 2008Direct and indirect radiative forcings of
dust in the LGM
T. Takemura et al.
Title Page
Abstract Introduction
Conclusions References
Tables Figures
◭ ◮
◭ ◮
Back Close
Full Screen / Esc
Printer-friendly Version
Interactive Discussion
Jansen, E., Overpeck, J., Briffa, K. R., Duplessy, J.-C., Joos, F., Masson-Delmotte, V., Olago, D., Otto-Bliesner, B., Peltier, W. R., Rahmstorf, S., Ramesh, R., Raynaud, D., Rind, D., Solomina, O., Villalba, R., and Zhang, D.: Palaeoclimate, in: Climate Change 2007: The Physical Science Basis, Contribution of Working Group I to the Fourth Assessment Report of the Intergovernmental Panel on Climate Change, edited by: Solomon, S., Qin, D., Manning,
5
M., Chen, Z., Marquis, M., Averyt, K. B., Tignor, M., and Miller, H. L., Cambridge University Press, Cambridge, UK and New York, NY, USA, 2007. 20465
Joussaume, S.: Paleoclimatic tracers: An investigation using an atmospheric general circula-tion model under ice age condicircula-tions 1. Desert dust, J. Geophys. Res., 98, 2767–2805, 1993. 20466
10
Jouzel, J., Barkov, N. I., Barnola, J. M., Bender, M., Chappellaz, J., Genthon, C., Kotlyakov, V. M., Lipenkov, V., Lorius, C., Petit, J. R., Raynaud, D., Raisbeck, G., Ritz, C., Sowers, T., Stievenard, M., Yiou, F., and Yiou, P.: Extending the Vostok ice-core record of palaeoclimate to the penultimate glacial period, Nature, 364, 407–412, 1993. 20464
K-1 Model Developers: K-1 coupled GCM (MIROC) description, edited by: Hasumi, H., and
15
Emori, S., K-1 Tech. Rep. 1, 34 pp., Center for Climate System Research, University of Tokyo, Tokyo, Japan, 2004. 20467
Kageyama, M., Laine, A., Abe-Ouchi, A., Braconnot, P., Cortijo, E., Crucifix, M., de Vernal, A., Guiot, J., Hewitt, C. D., Kitoh, A., Kucera, A., Marti, O., Ohgaito, R., Otto-Bliesner, B., Peltier, W. R., Rosell-Mel ´e, A., Vettoretti, G., Weber, S. L., Yu, Y., and MARGO Project Members:
20
Last Glacial Maximum temperatures over the North Atlantic, Europe and Western Siberia: A comparison between PMIP models, MARGO sea-surface temperatures and pollen-based reconstructions, Quaternary Sci. Rev., 25, 2082–2102, 2006. 20469
K ¨archer, B. and Lohmann, U.: A parameterization of cirrus cloud formation: Homogeneous freezing of supercooled aerosols, J. Geophys. Res., 107, 4010, doi:10.1029/2001JD000470,
25
2002. 20478
Kaufman, Y. J., Tanr ´e, D., Dobovik, O., Karnieli, A., and Remer, L. A.: Absorption of sunlight by dust as inferred from satellite and ground-based remote sensing, Geophys. Res. Lett., 28, 1479–1482, 2001. 20469
Kohfeld, K. E. and Harrison, S.: DIRTMAP: The geological record of dust, Earth Sci. Rev., 54,
30
81–114, 2001. 20471, 20472
ACPD
8, 20463–20500, 2008Direct and indirect radiative forcings of
dust in the LGM
T. Takemura et al.
Title Page
Abstract Introduction
Conclusions References
Tables Figures
◭ ◮
◭ ◮
Back Close
Full Screen / Esc
Printer-friendly Version
Interactive Discussion
24, 813–819, 2005. 20464
Levkov, L., Rockel, B., Kapitza, H., and Raschke, E.: 3D mesoscale numerical studies of cirrus and stratus clouds by their time and space evolution, Beitr. Phys. Atmos., 65, 35–58, 1992. 20478
Lohmann, U., Feichter, J., Chuang, C. C., and Penner, J. E.: Prediction of the number of cloud
5
droplets in the ECHAM GCM, J. Geophys. Res., 104, 9169–9198, 1999. 20478
Lohmann, U., and Feichter, J.: Global indirect aerosol effects: a review, Atmos. Chem. Phys., 5, 715–737, 2005,
http://www.atmos-chem-phys.net/5/715/2005/. 20474
Lohmann, U., and Diehl, K.: Sensitivity studies of the importance of dust ice nuclei for the
10
indirect aerosol effect on stratiform mixed-phase clouds, J. Atmos. Sci., 63, 968–982, 2006. 20478
Mahowald, N., Kohfeld, K., Hansson, M., Balkanski, Y., Harrison, S. P., Prentice, I. C., Schulz, M., and Rodhe, H.: Dust sources and deposition during the last glacial maximum and current climate: A comparison of model results with paleodata from ice cores and marine sediments,
15
J. Geophys. Res., 104, 15 895–15 916, 1999. 20466
Mahowald, N. M., Muhs, D. R., Levis, S., Rasch, P. J., Yoshioka, M., Zender, C. S., and Luo, C.: Change in atmospheric mineral aerosols in response to climate: Last glacial period, preindustrial, modern, and doubled carbon dioxide climates, J. Geophys. Res., 111, D10202, doi:10.1029/2005JD006653, 2006. 20466, 20472
20
Masson-Delmotte, V., Kageyama, M., Braconnot, P., Charbit, S., Krinner, G., Ritz, C., Guilyardi, E., Jouzel, J., Abe-Ouchi, A., Crucix, M., Gladstone, R. M., Hewitt, C. D., Kitoh, A., LeGrande, A. N., Marti, O., Merkel, U., Motoi, T., Ohgaito, R., Otto-Bliesner, B., Peltier, W. R., Ross, I., Valdes, P. J., Vettoretti, G., Weber, S. L., Wolk, F., Yu, Y.: Past and future polar amplication of climate change: climate model intercomparisons and ice-core constraints, Clim. Dynam.,
25
26, 513–529, doi:10.1007/s00382-005-0081-9, 2005. 20464, 20469
Monahan, E. C., Spiel, D. E., and Davidson, K. L.: A model of marine aerosol generation via whitecaps and wave disruption, in: Oceanic Whitecaps, edited by: Monahan, E. and Niocaill, G. M., D. Reidel, Norwell, Mass., USA, 167–174, 1986. 20477
Nakajima, T., Tsukamoto, M., Tsushima, Y., Numaguti, A., and Kimura, T.: Modeling of the
30
radiative process in an atmospheric general circulation model, Appl. Optics, 39, 4869–4878, 2000. 20468
ACPD
8, 20463–20500, 2008Direct and indirect radiative forcings of
dust in the LGM
T. Takemura et al.
Title Page
Abstract Introduction
Conclusions References
Tables Figures
◭ ◮
◭ ◮
Back Close
Full Screen / Esc
Printer-friendly Version
Interactive Discussion
J. B., White, J. W. C., DeFries, R. S., and Kasischke, E. S.: Fire emissions from C3 and C4 vegetation and their influence on interannual variability of atmospheric CO2 and d13CO2, Global Biogeochem. Cy., 19, GB2019, doi:10.1029/2004GB002366, 2005. 20468
Rayner, N. A., Parker, D. E., Horton, E. B., Folland, C. K., Alexander, L. V., Rowell, D. P., Kent, E. C., and Kaplan, A.: Global analysis of sea surface temperature, sea ice, and
5
night marine air temperature since the late nineteenth century, J. Geophys. Res., 108, 4407, doi:10.1029/2002JD002670, 2003. 20470
Petit, J. R., Jouzel, J., Raynaud, D., Barkov, N. I., Barnola, J.-M., Basile, I., Bender, M., Chap-pellaz, J., Davis, M., Delaygue, G., Delmotte, M., Kotlyakov, V. M., Legrand, M., Lipenkov, V. Y., Lorius, C., P ´epin, L., Rits, C., Saltzman, E., and Stievenard, M.: Climate and atmospheric
10
history of the past 420,000 years from the Vostok ice core, Antarctica, Nature, 399, 429–436, 1999. 20465
Sitch, S., Smith, B., Prentice, I. C., Arneth, A., Bondeau, A., Cramer, W., Kaplan, J., Levis, S., Lucht, W., Sykes, M., Thonicke, K., and Venevsky, S.: Evaluation of ecosystem dynamics, plant geography and terrestrial carbon cycling in the LPJ Dynamic Vegetation Model, Global
15
Change Biol., 9, 161–185, 2003. 20468
Spiro, P. A., Jacob, D. J., and Logan, J. A.: Global inventory of sulfur emissions with 1◦×1◦ resolution, J. Geophys. Res., 97, 6023–6036, 1992. 20468
Takemura, T., Okamoto, H., Maruyama, Y., Numaguti, A., Higurashi, A., and Nakajima, T.: Global three-dimensional simulation of aerosol optical thickness distribution of various
ori-20
gins, J. Geophys. Res., 105, 17 853–17 873, 2000. 20467, 20468, 20476, 20477
Takemura, T., Nakajima, T., Dubovik, O., Holben, B. N., and Kinne, S.: Single-scattering albedo and radiative forcing of various aerosol species with a global three-dimensional model, J. Climate, 15, 333–352, 2002. 20467, 20468, 20469, 20473
Takemura, T., Nozawa, T., Emori, S., Nakajima, T. Y., and Nakajima, T.: Simulation of climate
25
response to aerosol direct and indirect effects with aerosol transport-radiation model, J. Geo-phys. Res., 110, D02202, doi:10.1029/2004JD005029, 2005. 20467, 20468, 20469, 20478 Tanaka, T. and Chiba, M.: Global simulation of dust aerosol with a chemical transport model,
MASINGAR, J. Meteorol. Soc. Japan, 83A, 255–278, 2005. 20470
Tegen, I. and Fung, I.: Modeling of mineral dust in the atmosphere: Sources, transport, and
30
optical thickness, J. Geophys. Res., 99, 22 897–22 914, 1994. 20470
ACPD
8, 20463–20500, 2008Direct and indirect radiative forcings of
dust in the LGM
T. Takemura et al.
Title Page
Abstract Introduction
Conclusions References
Tables Figures
◭ ◮
◭ ◮
Back Close
Full Screen / Esc
Printer-friendly Version
Interactive Discussion
J. Geophys. Res., 107, 4576, doi:10.1029/2001JD000963, 2002. 20476
Werner, M., Tegen, I., Harrison, S. P., Kohfeld, K. E., Prentice, I. C., Balkanski, Y., Rodhe, H., and Roelandt, C.: Seasonal and interannual variability of the mineral dust cycle under present and glacial climate conditions, J. Geophys. Res., 107, 4744, doi:10.1029/2002JD002365, 2002. 20466, 20470, 20471
5
Wu, H., Guiot, J., Brewer, S., and Guo, Z.: Climatic changes in Eurasia and Africa at the last glacial maximum and mid-Holocene: reconstruction from pollen data using inverse vegeta-tion modelling, Clim. Dynam., 29, 211–229, 2007. 20464
Yanase, W. and Abe-Ouchi, A.: The LGM surface climate and atmospheric circulation over East Asia and the North Pacic in the PMIP2 coupled model simulations, Clim. Past, 3, 439–451,
10
2007,
ACPD
8, 20463–20500, 2008Direct and indirect radiative forcings of
dust in the LGM
T. Takemura et al.
Title Page
Abstract Introduction
Conclusions References
Tables Figures
◭ ◮
◭ ◮
Back Close
Full Screen / Esc
Printer-friendly Version
Interactive Discussion Table 1.Earth’s planetary constants and main greenhouse gas concentrations in the LGM and
PRE.
LGM PRE
Eccentricity 0.018994 0.016720
Obliquity of the earth’s axis, degrees 22.949 23.450 Longitude of perihelion, degrees 114.42 102.04
CO2, ppm 185 287.96
N2O, ppb 200 281.30
ACPD
8, 20463–20500, 2008Direct and indirect radiative forcings of
dust in the LGM
T. Takemura et al.
Title Page
Abstract Introduction
Conclusions References
Tables Figures
◭ ◮
◭ ◮
Back Close
Full Screen / Esc
Printer-friendly Version
Interactive Discussion Table 2. Regional and global total annual emission fluxes of soil dust aerosols in the LGM,
PRE, and LGMfv and their ratio of LGM to PRE.
Region LGM, Tg/yr PRE, Tg/yr LGM/PRE LGMfv, Tg/yr
Sahara 4200 1692 2.48 3629
Middle and Near East 734 447 1.64 698
Asia and Europe 1187 273 4.36 311
Australia 48 83 0.58 91
North America 1.6 3.8 0.41 1.4
South America 16 48 0.33 44
Southern Africa 12 48 0.26 16
ACPD
8, 20463–20500, 2008Direct and indirect radiative forcings of
dust in the LGM
T. Takemura et al.
Title Page
Abstract Introduction
Conclusions References
Tables Figures
◭ ◮
◭ ◮
Back Close
Full Screen / Esc
Printer-friendly Version
Interactive Discussion Table 3.Zonal and global total mass column loading and deposition fluxes of soil dust aerosols
in the LGM and PRE and their ratio of LGM to PRE. Numbers in parentheses in the deposition fluxes are percentages of the wet deposition fluxes to the total ones.
Mass column loading Deposition
ACPD
8, 20463–20500, 2008Direct and indirect radiative forcings of
dust in the LGM
T. Takemura et al.
Title Page
Abstract Introduction
Conclusions References
Tables Figures
◭ ◮
◭ ◮
Back Close
Full Screen / Esc
Printer-friendly Version
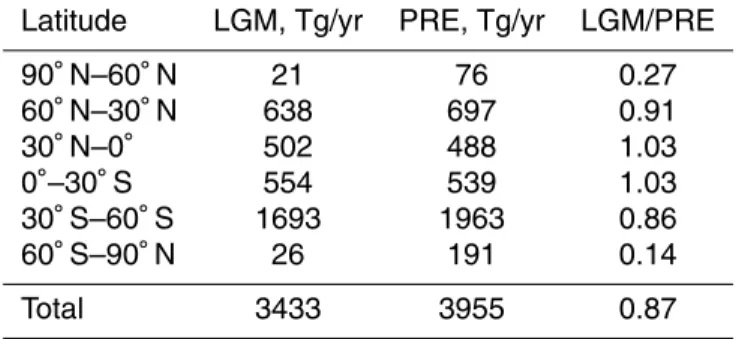
Interactive Discussion Table 4. Zonal and global total annual emission fluxes of sea salt aerosols in the LGM and
PRE, and their ratio of LGM to PRE.
Latitude LGM, Tg/yr PRE, Tg/yr LGM/PRE
90◦N–60◦N 21 76 0.27
60◦N–30◦N 638 697 0.91
30◦N–0◦ 502 488 1.03
0◦–30◦S 554 539 1.03
30◦S–60◦S 1693 1963 0.86
60◦S–90◦N 26 191 0.14
ACPD
8, 20463–20500, 2008Direct and indirect radiative forcings of
dust in the LGM
T. Takemura et al.
Title Page
Abstract Introduction
Conclusions References
Tables Figures
◭ ◮
◭ ◮
Back Close
Full Screen / Esc
Printer-friendly Version
Interactive Discussion Table 5.Global and annual mean radiative forcing for the direct effect of soil dust aerosols at the
tropopause and surface under clear-sky and all-sky conditions in the LGM and PRE. SW, LW, and SW+LW are shortwave, longwave, and shortwave plus longwave radiations, respectively.
Tropopause, W m−2 Surface, W m−2
SW LW SW+LW SW LW SW+LW
Clear-sky
LGM −0.38 +0.26 −0.12 −1.02 +0.53 −0.50 PRE −0.18 +0.11 −0.07 −0.46 +0.22 −0.24 All-sky
ACPD
8, 20463–20500, 2008Direct and indirect radiative forcings of
dust in the LGM
T. Takemura et al.
Title Page
Abstract Introduction
Conclusions References
Tables Figures
◭ ◮
◭ ◮
Back Close
Full Screen / Esc
Printer-friendly Version
Interactive Discussion Table 6. Global and annual mean radiative forcing for the indirect effect of soil dust aerosols
at the tropopause and surface in the LGM and PRE. SW, LW, and SW+LW are shortwave, longwave, and shortwave plus longwave radiations, respectively.
Tropopause, W m−2 Surface, W m−2
SW LW SW+LW SW LW SW+LW
ACPD
8, 20463–20500, 2008Direct and indirect radiative forcings of
dust in the LGM
T. Takemura et al.
Title Page
Abstract Introduction
Conclusions References
Tables Figures
◭ ◮
◭ ◮
Back Close
Full Screen / Esc
Printer-friendly Version
Interactive Discussion Table A1. Radius range, effective radius, and normalized emission strength of each size bin
for soil dust aerosols in SPRINTARS.
Radius range, µm Effective radius, µm Normalized emission strength
0.10–0.22 0.13 0.0045
0.22–0.46 0.33 0.0290
0.46–1.00 0.82 0.1766
1.00–2.15 1.27 0.2633
2.15–4.64 3.20 0.2633
ACPD
8, 20463–20500, 2008Direct and indirect radiative forcings of
dust in the LGM
T. Takemura et al.
Title Page
Abstract Introduction
Conclusions References
Tables Figures
◭ ◮
◭ ◮
Back Close
Full Screen / Esc
Printer-friendly Version
Interactive Discussion Table B1. Radius range and effective radius of each size bin for sea salt aerosols in
SPRINT-ARS.
ACPD
8, 20463–20500, 2008Direct and indirect radiative forcings of
dust in the LGM
T. Takemura et al.
Title Page
Abstract Introduction
Conclusions References
Tables Figures
◭ ◮
◭ ◮
Back Close
Full Screen / Esc
Printer-friendly Version
Interactive Discussion Table C1.Constants for Eqs. (C3) and (C4).
ACPD
8, 20463–20500, 2008Direct and indirect radiative forcings of
dust in the LGM
T. Takemura et al.
Title Page
Abstract Introduction
Conclusions References
Tables Figures
◭ ◮
◭ ◮
Back Close
Full Screen / Esc
Printer-friendly Version
Interactive Discussion Warm grassland / shrub
Tundra
Bare ground / shrub Wooded c4 grassland High latitude deciduous forest Conifer
Mixed coniferous & broadleaf deciduous forest Broadleaf deciduous forest & woodland Broadleaf evergreen
Ice
Warm grassland / shrub Tundra
Bare ground / shrub Wooded c4 grassland High latitude deciduous forest Conifer
Mixed coniferous & broadleaf deciduous forest Broadleaf deciduous forest & woodland Broadleaf evergreen
Ice
(a)
(b)
ACPD
8, 20463–20500, 2008Direct and indirect radiative forcings of
dust in the LGM
T. Takemura et al.
Title Page
Abstract Introduction
Conclusions References
Tables Figures
◭ ◮
◭ ◮
Back Close
Full Screen / Esc
Printer-friendly Version
Interactive Discussion
) b ( )
a (
ACPD
8, 20463–20500, 2008Direct and indirect radiative forcings of
dust in the LGM
T. Takemura et al.
Title Page
Abstract Introduction
Conclusions References
Tables Figures
◭ ◮
◭ ◮
Back Close
Full Screen / Esc
Printer-friendly Version
Interactive Discussion
) b ( )
a (
) d ( )
c (
Fig. 3. Annual total distributions of the emission flux of soil dust aerosols in the(a)LGM and
(b)PRE and annual mean distributions of the mass column loading of soil dust aerosols in the
ACPD
8, 20463–20500, 2008Direct and indirect radiative forcings of
dust in the LGM
T. Takemura et al.
Title Page
Abstract Introduction
Conclusions References
Tables Figures
◭ ◮
◭ ◮
Back Close
Full Screen / Esc
Printer-friendly Version
Interactive Discussion Fig. 4.Comparisons of annual total deposition flux of soil dust aerosols between the DIRTMAP
ACPD
8, 20463–20500, 2008Direct and indirect radiative forcings of
dust in the LGM
T. Takemura et al.
Title Page
Abstract Introduction
Conclusions References
Tables Figures
◭ ◮
◭ ◮
Back Close
Full Screen / Esc
Printer-friendly Version
Interactive Discussion
) b ( )
a (
) d ( )
c (
Fig. 5. Annual total distributions of the emission flux of sea salt aerosols in the (a)LGM and
(b)PRE and annual mean distributions of the mass column loading of sea salt aerosols in the
ACPD
8, 20463–20500, 2008Direct and indirect radiative forcings of
dust in the LGM
T. Takemura et al.
Title Page
Abstract Introduction
Conclusions References
Tables Figures
◭ ◮
◭ ◮
Back Close
Full Screen / Esc
Printer-friendly Version
Interactive Discussion
) b ( )
a (
) d ( )
c (
Fig. 6.Annual mean distributions of radiative forcing for the shortwave plus longwave radiation due to the direct effect of soil dust aerosols under the all-sky condition at the tropopause in the
ACPD
8, 20463–20500, 2008Direct and indirect radiative forcings of
dust in the LGM
T. Takemura et al.
Title Page
Abstract Introduction
Conclusions References
Tables Figures
◭ ◮
◭ ◮
Back Close
Full Screen / Esc
Printer-friendly Version
Interactive Discussion
) b ( )
a (
) d ( )
c (