© 2014 Science Publications
doi:10.3844/jcssp.2014.353.360 Published Online 10 (2) 2014 (http://www.thescipub.com/jcs.toc)
Corresponding Author: Emna Chebbi, Department of Signal, Image and Patterns Recognition Laboratory (LSITI), University of Tunis El Manar, National Engineering School of Tunis (ENIT), Tunisia
AN IMPROVEMENT OF STRUCTURAL
SIMILARITY INDEX FOR IMAGE QUALITY ASSESSMENT
Emna Chebbi, Faouzi Benzarti and Hamid Amiri
Department of Signal, Image and Patterns Recognition Laboratory (LSITI), University of Tunis El Manar, National Engineering School of Tunis (ENIT), Tunisia
Received 2013-08-15; Revised 2013-10-13; Accepted 2013-11-21
ABSTRACT
The image quality assessment has been widely used in image processing. Several researches have been developed and carried considering the Human Visual System (HVS). Under the hypothesis that human visual perception is extremely adapted to retrieve structural information from a scene, the SSIM index is the most widely used in this area, which leads to a better correlation with HVS. Despite its robustness the SSIM presents some limitations in the presence of blur affecting images. In this study, we propose an improved version of the SSIM for blur image assessment. The idea is to combine gradient based SSIM score with that of the structural information of the blur. Experimental results show a good performance.
Keywords: Image Quality Assessment, HVS, SSIM, GSSIM, Blur Estimation
1. INTRODUCTION
The image quality assessment plays today a major role in many multimedia applications. This issue is continuing to expand and has achieved a certain maturity level within the community of multimedia communication. Several methods have been suggested in the literature (Li and Bovik, 2010) trying to overcome the drawbacks of subjective measures (Redi et al., 2010). These indicators provide quality results in concordance with human judgment which requires the integration of the major properties of the Human Visual System (HVS). An objective assessment of the image or video quality is based on various criteria to identify an objective quality score. These criteria are divided into three categories depending on the information required to assess: Full Reference (FR) (Li and Bovik, 2010; Chetouani et al., 2010; Okarma, 2012), Reduced Reference (RR) (Li and Wang, 2009; Ma et al., 2012) and No Reference (NR) (Peng and Doermann, 2012; Saad et al., 2012).
Unfortunately, in the absence of a universal image quality index, the traditional Peak Signal Noise Ratio (PSNR) is still employed in numerous applications. In
fact, the index of the universal image quality that can assess various distortions is not yet on the horizon and people keep proposing heuristic measures implemented on psychophysics and image databases known. The aim of this study is not only offers a quality index for all well known distortions, but rather to focus on especially the blur artifact. Such artifact mainly affects main characteristics such as edges which are high frequencies in the image that is mainly due to the fact that generally higher frequencies are alleviated by the components on the first compression process.
This study is organized as follows: In the two following sections 2 and 3, we present a review of some related works involving objective image quality assessment metrics mainly the approaches based on structural fidelity as well as the No Reference blur metrcis. In section 4, we describe the proposed approach. Experimental results are then shown in section 5.
2. APPROCHES BASED ON
STRUCTURAL FIDELITY
on the response of the human visual system to a degraded image. The main assumption is that our perception is particularly suitable for extracting structural information of an image (Yeganeh and Wang, 2011).
These approaches based on structural fidelity are among the objective assessment research of image quality which is intended to develop quality measures that may predict perceived image quality automatically. Indeed, there are a number of factors which affect the human perception of visual quality. A well known example may lead to greater degree of correlation with visual perception that of the index of Structural Similarity (SSIM) by (Li and Bovik, 2009; Charrier et al., 2012), adapted to the assessment of quality still images (1). This metric sets of comparative measurements of luminance l(x, y) (2), contrast c(x, y) (3) and structure s(x, y) (4) between two signals x and y Equation (1):
γ
α β
SSIM(x, y) = [l(x, y)] .[c(x, y)] .[s(x, y)] (1) Where Equation (2 to 4):
x y 1
2 2
x y 1
2 + c l(x, y) =
+ + c (2)
x y 2
2 2
x y 2
2σ σ + c c(x, y) =
σ +σ + c (3)
xy
x y
2σ + c3 s(x, y) =
σ σ + c3 (4)
µx, µy denote the average of x and y
respectively 2 2
x y
σ ,σ . Refer to the variance of x and y respectively and σxy is the cross covariance between x
and y the constants C1, C2, C3 are employed to
stabilize the metric for the case where the means and variances become small. The parameters α>0, β>0,
γ>0 are used to adjust the relative importance of the three constituents. Particularly to simplify the SSIM index, we set α = β = γ = 1 and C3 = C2/2. The SSIM
index (5) is then given by Equation (5):
x y 1 xy 2
2 2 2 2
x y 1 x y 2
(2 + c )(2σ + c ) SSIM(x, y) =
( + + c )(σ +σ + c ) (5)
In the field of image quality assessment, image blocks from the original and distorted image form the vectors and respectively. The mean of the SSIM values across the image (MSSIM) offers the final quality measure. The SSIM index is to acknowledge the fact that
natural images are highly structured and that the measure of structural correlation between the original and the distorted image is prominent for determining overall visual quality. Besides, the SSIM index measures quality locally and is able to capture local dissimilarities better, unlike global quality measures such as MSE and PSNR. Experimental results show that the indexes SSIM and MSSIM are widely correlated with the perception of visual quality than PSNR and still extremely competitive compared to alternative algorithms of image quality assessment. When dealing with assessing the quality of blurred images, some research has offered the improvement of the two indexes SSIM and MSSIM.
An improved structural similarity for image quality assessment has been expanded by (Li and Bovik, 2010). This metric is known as Gradient-based SSIM (GSSIM) which involves comparing the edge information among the distorted and the original image. GSSIM replaces the contrast comparison and the structure comparison respectively with a gradient comparison contrast Cg(x,y) (6) and a gradient structure comparison Sg(x, y)
(7). The gradient is produced through the use of the Sobel operator Equation (6 and 7):
x y 2
g 2 2
x' y' 2
2σ 'σ' + c C (x, y) =
δ +σ + c (6)
x'y' 3 g
x' y' 3
σ + c S (x, y) =
σ σ + c (7)
X and y refer respectively to the gradient maps of the original and the distorted images, x’ and y’ denote the block vectors from x and y. Knowing that C2 = C3,
the GSSIM index (8) is given by the following formula Equation (8):
x y 1 x'y' 2
2 2 2 2
x y 1 x y 2
(2 + c )(2σ + c ) GSSIM(x, y) =
( + + c )(σ +σ + c ) (8)
Some contributions have subsequently made enhancement to the original version, including its adaptation to the video. In section 4, we will show our contribution to improve this metric.
3. NO REFRENCE BLUR METRIC
process over both horizontal and vertical is exerted to the original image F and the blurred images BH and BV thus obtained are employed as a reference.
The absolute difference intensity between adjacent pixels is determined according to the horizontal and vertical directions for the original image and the reference to obtain the absolute difference images.
Likewise, a No-Reference Image Blur Assessment Using Multiscale Gradient has been proposed by (Chen and Bovik, 2011), that consider natural scenes statistics models merged with multi-resolution decomposition methods to extract reliable features from quality assessment. The algorithm starts by applying a probabilistic Support Vector Machine (SVM) as a rugged image quality interpreter. The following step is to mature the blur measures by the use of the image detail. Eventually, the estimation of the blur extent is achieved by gathering the blur information. The experimental results indicate that the algorithm is highly correlated with human judgments to evaluate distorted image.
4. PROPOSED APPROACH
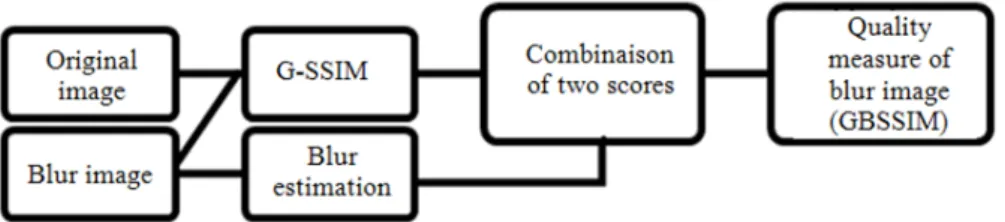
Our approach is based on three steps (Fig. 1): The first step is concerned with the extraction of the blur amount presented into the distorted image. The second step involves the use of a full Reference measure quality ‘G-SSIM’ in order to determine the image measure quality. The idea is to incorporate the blur amount already calculated into the G-SSIM score to obtain the final measure quality of the image to assess.
In fact, blur estimation approach is based upon the human perception of blur; human visual system receives the differences between blurred and net images but may not precisely distinguish a blurred image with the same re-blurred. In terms of gray scale, this means that the process of blurring leads into high intensity variations between adjacent pixels of a net image while only mild intensity variations between adjacent pixels are presented if the image is already blurred (Liu et al., 2008; Ciancio et al., 2011).
By referring to our latest work (Chebbi et al., 2012), we use Haar wavelet decomposition at level (Makaremi and Ahmadi, 2010; Vu and Chandler, 2012; Lelegard et al., 2011), for both the blurred image down horizontal direction Bv and the blurred image
down vertical direction BH (Fig. 2).
And we extract Haar wavelet details and build the edge map for respectively Bv and BH by the two
following Equation (9) and (10):
H H H H
2 2 2
map1_ B 1_ B 1 _ B 1 _ B
E = LH +HL +HH (9)
V V V V
2 2 2
map1_ B 1_ B 1 _ B 1 _ B
E = LH +HL +HH (10)
The maximum value between the edge map respectively is computed along horizontal and vertical direction Equation (11):
(
)
max
map1BV map1_BH
E = max E , E (11)
The blur amount presented into an image is resulted by adding the value of Emax already computed to the
Maximum value between the blur amount respectively presented in the blurred image along horizontal and vertical direction blurm.
The second step consists in combining the quality score obtained by the Gradient base SSIM (G-SSIM) with that the blur amount measured with the aim of getting a quality measure that shall take into consideration the perception of blur. Assuming that the human eye is adapted for the extraction of structural information of an image, it is vital to measure the distortion of the local structural information and extract structural attributes of the image from which each block is featured by its brightness, contrast and structure. It should eventually replace the comparison contrast and comparison structure respectively with a gradient comparison contrast and a gradient structure comparison. We begin assessing the image quality using the G-SSIM without blur factor. Outcomes provided by the GSSIM are then compared to those awarded within in the new measure. The objective is to develop a tool to enhance the quantification of image quality. To achieve this goal, we use objective methods based on the measurement of the perceived quality of an image. These methods measure the error between a distorted image and a reference image using a range of known properties of the Human Visual System (HVS) by operating the concept of HSV which the human eye is very fitting to retrieve the structural information of an image.
This is reflected in the extent of structural information as a Gradient based Structural Similarity Index (G-SSIM). However SSIM is disregards the blur detection factor and to its extent, G-SSIM is introduced as a refinement of SSIM which involves comparing the edge information among the distorted and the original image.
The image quality assessment measure consists in combination between GBSSIM and blur factor already calculated with the method presented in the previous section.
It comes to apply the following formula (12) to obtain the final score of the quality measure Equation (12):
(
Amount)
Fig. 1. Flow chart of the proposed approach
Fig. 2. Haar wavelet decomposition at level 1
5. EXPERIMETAL RESULTS
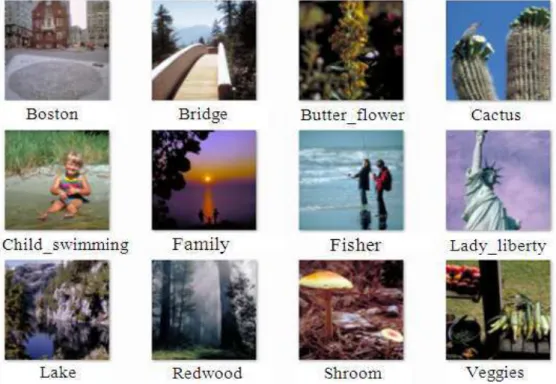
In the experimental results, we use an image samples as a reference from the CSIQ database (Larson and Chandler, 2010) (Fig. 3), each image is distorted using once vertical blur and once more horizontal blur (Fig. 4). In the first step, the blur is added by convolving the original image with the Gaussian filter.
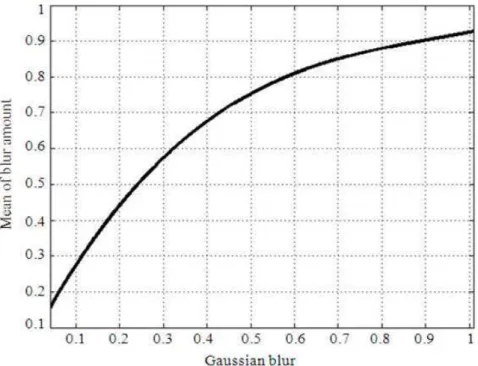
The mean of blur amount values is represented by a decreasing curve (Fig. 5); it’s calculated over a set of 12 images from CSIQ data base. An increase value in the sigma value (δ) results a decline value of the blur amount presented in the image distorted.
This curve of blur amount’s mean is modeled by a General model Gauss4 Equation (13):
3 2
f(x) = p1, x + p2, x + p3, x + p4 (13) where, Coefficients (with 95% confidence bounds): p1 = 0.8
p2 = -2.23 p3 = 2.28 p4 = 0.07
The mean of SSIM values is represented by a non uniform curve which contains a decreasing part followed by an increasing part (Fig. 6). The peak existed in the blue curve shows clearly that SSIM is less sensitive to the change of blur amount in an image.
According to the results obtained by the curve of SSIM, we notice at the two pikes that an increase in the amount of blur presented in an image corresponds to an increase of the score of quality measure which is inconsistent with the human eye.
The proposed approach is presented by red curve; this is a decreasing curve that’s more realistic with the HVS. An increase in the value of the blur amount leads to a lower score of the proposed quality measure.
According to experiments, the scores provided by the proposed approach are more declined than SSIM; which reflects its effectiveness in assessing quality of blurred images.
The integration of the blur factor improves scores obtained for the assessment measure of image quality and provides satisfactory and relevant results that are consistent with the human eye.
The fitted curve of the proposed approach is on the form of a cubic polynomial Equation (14):
3 2
f(x) = p1, x + p2, x + p3, x + p4 (14)
Coefficients (with 95% confidence bounds):
Fig. 3. The original images of CSIQ data base
Fig. 5. Mean of blur amount
This equation may be used in the event is to calculated the quality score by replacing the variable x by the blur amount presented into a degraded image.
6. CONCLUSION
In this study, we have proposed an improvement structural similarity SSIM index for blur image assessment. The idea is to combine GSSIM score with that of the structural information of the blur. According to experimental results, we note that our proposed method leads to satisfactory results according to the HVS concordance. Future work will be focused on defining a robust model that assesses the image quality independently of any type of distortion.
7. REFERENCES
Charrier, C., K. Knoblauch, L.T. Maloney, A.C. Bovik and A.K. Moorthy, 2012. Optimizing multiscale SSIM for compression via MLDS. IEEE Trans. Image Process., 21: 4682-4694. DOI: 10.1109/TIP.2012.2210723
Chebbi, E., F. Benzarti and H. Amiri, 2012. Image quality assessment based ONN perceptual blur metric. Int. Adv. Trends Comput. Sci. Eng., 1: 50-55.
Chen, M.J. and A.C. Bovik, 2011. No-reference image blur assessment using multiscale gradient. EURASIP J. Image Video Process. DOI: 10.1186/1687-5281-2011-3
Chetouani, A., A. Beghadadi and M. Deriche, 2010. A universal full reference image quality metric based on a neural fusion approach. Proceedings of IEEE 17th International Conference on Image Processing, Sept. 26-29, IEEE Xplore Press, Hong
Kong, pp: 2517-2520. DOI:
10.1109/ICIP.2010.5652855
Ciancio, A., A.L.T. Costa, E.A.B. Silva, A. Said and R. Smadani et al., 2011. No-reference blur assessment of digital pictures based on multifeature classifiers. IEEE Trans. Image Process., 20: 64-75. DOI: 10.1109/TIP.2010.2053549
Fiche, C., P. Ladret and N.S. Vu, 2010. Blurred face recognition algorithm guided by a no-reference blur metric. Proceedings of the SPIE, Image Processing: Machine Vision Applications, Jan. 28-28, SPIE, San Jose, California. DOI: 10.1117/12.840245
Larson, E.C. and D.M. Chandler, 2010. Most apparent distortion: Full-reference image quality assessment and the role of strategy. J. Electr. Imag., 19: 011006-011006. DOI: 10.1117/1.3267105
Lelegard, L., B. Vallet and M. Bredif, 2011. Multiscale haar transform for blur estimation from a set images. Proceedings of the International Archives of Photogrammetry, Remote Sensing and Spatial Information Sciences, Oct, 5-7. Germany, pp: 65-70.
Li, C. and A.C. Bovik, 2009. Three-Component Weighted Structural Similarity Index. Proceedings of the SPIE, Image Quality and System Performance, Jan. 18-18, San Jose, CA., DOI: 10.1117/12.811821
Li, C. and A.C. Bovik, 2010. Content-partitioned structural similarity index for image quality assessment. Image Commun., 25: 517-526. DOI: 10.1016/j.image.2010.03.004
Li, Q. and Z. Wang, 2009. Reduced-reference image quality assessment using divisive normalization-based image representation. IEEE J. Selected Topics
Signals Proc., 3: 202-211. DOI:
10.1109/JSTSP.2009.2014497
Liu, R., Z. Li and J. Jia, 2008. Image partial blur detection and classification. Proceedings of the IEEE Conference on Computer Vision and Pattern Recognition, Jun. 23-28. IEEE Xplore Press,
Anchorage, pp: 1-8. DOI:
10.1109/CVPR.2008.4587465
Ma, L., S. Li and K.N. Ngan, 2012. Reduced-reference image quality assessment in reorganized DCT domain. Signal Process. Image Commun., 28: 884-902. DOI:10.1016/j.image.2012.08.001
Makaremi, I. and M. Ahmadi, 2010. Blur invariants: A novel representation in the wavelet domain. Patt.
Recogn., 43: 3950-3957. DOI:
10.1016/j.patcog.2010.07.020
Okarma, K., 2012. Hybrid feature similarity approach to full-reference image quality assessment. Proceedings of the International Conference on Computer Vision and Graphics, Sep. 24-26, Springer Berlin Heidelberg, Poland, pp: 212-219. DOI: 10.1007/978-3-642-33564-8_26
Redi, J., H. Liu, H. Alers, R. Zunino and I. Heynderickx, 2010. Comparing subjective image quality measurement methods for the creation of public databases. Proceedings of the SPIE, Image Quality and System Performance, Jan. 17-17, SPIE, San Jose, California.DOI: 10.1117/12.839195
Saad., M.A, A.C. Bovik and C. Charrier, 2012. Blind image quality assessment: A natural scene statistics approach in the DCT domain. IEEE Trans. Image
Process., 21: 3339-3352. DOI:
10.1109/TIP.2012.2191563
Vu, P.V. and M. Chandler, 2012. A fast wavelet-based algorithm for global and local image sharpness estimation.Signal Process. Lett., 19: 423-426. DOI: 10.1109/LSP.2012.2199980