Vol. 13, No. 2, June 2016, 285-299
Dynamic Modeling and Simulation of
Power Transformer Maintenance Costs
Olga Risti
ć
1, Bratislav D. Iri
č
anin
2, Vladica Mijailovi
ć
1Abstract: The paper presents the dynamic model of maintenance costs of the power transformer functional components. Reliability is modeled combining the exponential and Weibull's distribution. The simulation was performed with the aim of corrective maintenance and installation of the continuous monitoring system of the most critical components. Simulation Dynamic System (SDS) method and VENSIM PLE software was used to simulate the cost. In this way, significant savings in maintenance costs will be achieved with a small initial investment.
Keywords: Modeling, Exponential and Weibull's distribution, Simulation, Power transformer, Maintenance.
1 Introduction
Power transformers are one of the most important and critical components in the electric power distribution system. It is significant to determine the maintenance costs of power transformer and prevent the failure beforehand by applying preventive maintenance activities [1].
Dynamic modelling of power transformer maintenance activities based on different strategies of maintenance, determining the optimum moment of replacement elements, the spare parts purches time, as well as minimizing the costs incurred in carrying out maintenance activities. Equipment behaviour is crucial for the implementation of preventive maintenance activities. In the dynamic modelling of power transformer reliability is necessary to establish a plan under which it shall be based on events and changes in the system, monitoring the state of certain elements, to determine the probability of component some failure generation.
For equipment that is being utilized for many years, modeling sets the minimum maintenance costs as well as interruptions in the supply of electrical energy (EE) to final consumers, according to [2, 3]. By analyzing the corrective
1Faculty of Technical Sciences Čačak, University of Kragujevac, Svetog Save 65, 32000 Čačak, Serbia;
E-mails: [email protected]; [email protected]
2Faculty of Electrical Engineering, University of Belgrade, Bulevar Kralja Aleksandra 73, 11000 Belgrade,
Serbia; E-mails: [email protected]; [email protected]
maintenance strategies and continuous monitoring system instalation (CSMI) of critical elements in the example of a power transformer, it will be determined by combining the activities that aim to minimize costs and maximize power transformer availability [4].
In the recent years, for different types of calculation simulation that occure by numerical evaluation of model by the implementation of various software. The simulation can be used to predict system behaviour and optimization. In the paper will be apply the SDS method to simulate power transformer maintenance costs.
2
Model Development for Power Transformer
Maintenance Activities
Failures that occur on the equipment in the most cases result deficits or interruptions in the delivery of EE to final consumers. The losses at the distribution company is proportional to the degree of equipment damage and to the cost of undelivered EE quantity. Consumer losses depending on the length and structure of the interruption of EE consumption. Failures that occur on power transformers cause the most serious consequences because their removal takes time and costs. Therefore, right on their availability is an important technical and economic issue [5].
Failures can be repairable (avoidable) and unreparable (unavoidable). Elimination of power transformer avoidable failures takes a relatively short time and does not require spare parts. In order to remove unreparable failures spare parts ought to be used, so that the duration of failure elimination depends on their availability. Purchase of spare elements significantly influences the duration of the failure when it occurs, but this purchase requires substantial additional investments [6].
Power transformer has six functional components: windings and oil, core, bushings, tank, on-load tap-changer and other accessories. It can be in the operating or failure condition. Failure condition of power transformer conversion can be divided into minor failures and major failures, which occur due to the loss of one or more of transformer functionality. Failures which can be removed for a period shorter than one day belong to minor failures.
Probability that component “k” of power transformer is in operating state is presented through the combination of exponential and Weibull distribution [7]:
, ,
( ) exp ( ) exp
k
k k mf k MF
k t
R t t
, (1)
t - time,
k, k - Weibull scale and shape parameter for component " "k , respectively,
k MF, and k mf, are major and minor failure rate of component " "k , respectively.
According to the expected duration of failure renewal time, there are three categories of failures [8]:
failures which can be repaired for t1 day,
failures which can be repaired for 1 t 30 days,
failures that can be repaired for t30 days.
The maintaining activities of power transformer may be considered depending on the implemented measures [7, 8] and can be carried out through:
1) corrective maintenance, 2) one-day maintenance, 3) oil regeneration,
4) insulation system regeneration, 5) power transformer refurbishment, 6) CMSI,
7) spare equipment optimization.
At this point, we shall consider only the case of extreme values of costs. More specifically, these are the costs of corrective maintenance and installation of continuous monitoring system (CMS) on power transformer elements.
2.1 Cost estimation model for corrective maintenance
The corrective maintenance is carried out in the case of operation without spare equipment or maintenance. In the planning period of exploitation costs, only the renewal costs will be included. During the period
t t, 1
estimatedannual value of these costs per transformer, can be calculate from the expression [7]:
' , , 1 1
, 1
' , , 1 1
1
, 1
d 1
k k
f b
tot tot k k i k i
k i
PT b t b f
tot tot tot k k i k i
k i
t
R t R t p p C
C t t
R t t R t R t p p r
,
1
b
tot k
k
R t R t
where:
'
,
k i
C - renewal cost of class " "i failure on component " "k if spare component " "k is not available,
Rtot- reliability function of power transformer,
Rk- reliability function of power transformer component ,
pk- probability that the failures occurs on power transformer component " "k ,
fk- number of failure classes of power transformer component " "k , regard to the failure repair time,
pk i, - probability that the failure of category " "i show in component " "k ,
'
,
k i
r - renewal time of category " "i occurs of component " "k if spare
component " "k is not available,
''
,
k i
r - renewal time of category " "i occurs of component " "k if spare component " "k is available,
b- number of functional components of power transformer.
2.2 CMSI cost model
The expected service life of the commercially available CMS is 10 years, and the purchase price is about 10% of the corresponding components purchase price. In the literature, the price and duration of detected faults mostly are ignored, because it is minimal or zero. For safety reasons, it is assumed that the detected defects in the windings and core eliminated in 5 days at a price of 5000 EUR, while on the other components will be eliminated only minor failures. By CMSI of power transformer components enables detection of failures at the earliest stage of development. This increases the intensity of minor and reduces the intensity of major component failures. Reducing the intensity of major failures has resulted in an increase in scale parameter of Weibull's distribution.
If we denote with k,k1, 2, scale parameter of winding and core after CMSI, CMS will be installing after TS year of exploitation without failure.
If transformer will not fail for next 10 years of exploitation reliability will be change according to expression
1
2 1
2
3
, b
tot S S S S k
k
R t R T R T R t T R t T R t
exp
, ,
exp , 1, 2.k
S
k S k MF k mf S
k t T
R t T t T k
Expected costs in the first year after first CMSI are calculated as:
, , 2 ' , , ,1 1 3 1
,
,1 2 2
'
, , ,
1 1 3 1
' ' '
( , 1)
Im , 1
, 1 , j k j i j k j i
f b f
CMS CMS b
j j i k k i k i
j i k i
PT CMS s s
CMS s s
tot s s
m CMS
f b f
CMS CMS b
j j i k k i k i
j i k i
tot s tot s tot
X p p C p p C
C T T
T T
R T C
C
Y p p r p p r
X R T R T Y R
, 10 ' ' 1 ' ' ' 2 ' , , ,1 1 3 1
( ) 10 ,
Im , 1 ( ) 1
, s s s s j k j i T
tot s tot s T
T
CMS s s tot tot s tot s
T
f b f
CMS CMS b
j j i k k i k i
j i k i
t dt R T R T
T T R t dt R T R T
p p r p p r
(4) where: CMS b, k i
C - renewal cost of category “i” on component “k” of power
transformer if CMS is installed and component “k” is not available,
CMS b, k i
r - renewal time of category “i” on component “k” of power transformer if CMS is installed and component “k” is not available,
,
k i
CMS
p - probability that the failure of class “i” occurs on power
transformer component “k” after installing CMS,
Cm CMS - annual maintenance cost of CMS.
3
Power Transformer Cost and Failure Data Analysis
In Table 1 the data of component contribution in total number of failures of power transformers are given, as well as the duration of certain failures categories elimination. The values of the degree of detected faults are listed in
Table 2. In the same table is the purchase price of components and power transformer 110kV, 110/x kV/kV, 31,5МVА.
Table 1 Power transformer component reliability data and removal duration of certain categories failures [7].
Component pk , %
Failure “category“ by
duration
, , %
k i
p '
,
k i
r ''
,
k i r
30 days 14,54 30 15 1) Windings + oil 26,4
30 days 85,46 250 15 1÷30 days 50,00 30 15
2) Core 2,4
30 days 50,00 180 15 1 day 14,82 1 1 1÷30 days 51,85 40 3 3) Bushing 12,0
30 days 33,33 40 15 1 day 58,82 1 1 1÷30 days 23,53 3 3
4) Tank 7,9
30 days 17,65 90 15 1 day 25,61 1 1 1÷30 days 52,44 3 3 5) On-load
tap-changer 40,7
30 days 21,95 40 3 1 day 65,22 1 1 1÷30 days 17,39 15 15 6) Other
accessories 10,6
30 days 17,39 40 15
It is adopted that the price of undelivered EE 0,10 EUR/kWhCPT , time of refurbishment tref 28 days, price of filtration and drying oil Coilfd
,
0, 2Cnew oil
, price of one-day maintenance Cone day 100 EUR, cost of oil regeneration Creg.oil 8000 EUR, price of insulation regeneration
. 100000 EUR
reg ins
C , probability of reduction "technical age" of paper
isolation x0,3.
purchasing price. In Table 3 are presented the prices of failure renewal cost on power transformer components.
Table 2
Values for detection rate and price of new elements of power transformer 110/x kV/kV.
Component
The level of detection
% k dCost of purchase new component
, EUR
new k C
Windings + oil 70 250 000+ 40 000
Core 70 80 000
Bushing 80 800
Tank - 28 000
On-load tap-changer 75 42 000
Other accessories 100 22 000
Table 3
Failures renewal costs for power transformer components
Component pk , %
Failure “category“ by duration
Failure renewal cost without
spares Ck i',
Failure renewal cost with available spares
'' ,
k i C 30 days
,1
0, 2Cnew Cu Cu 1) Windings +
oil 26,4 30 days 0,5Cnew,1Cu Cu 1÷30 days 0, 2Cnew,2Cu Cu
2) Core 2,4
30 days 0,5Cnew,2Cu Cu 1 day 0, 4Cnew,3 0, 4Cnew,3 1÷30 days Cnew,3 - 3) Bushing 12,0
30 days
,3
new u
C C Cu
1 day
,4
0,1Cnew 0,1Cnew,4 1÷30 days
,4
0, 2Cnew 0, 2Cnew,4 4) Tank 7,9
30 days Cnew,4Cu Cu 1 day 0,1Cnew,5 0,1Cnew,5 1÷30 days 0, 2Cnew,5 0, 2Cnew,5 5) On-load
tap-changer 40,7
30 days
,5
0, 4Cnew -
1 day
,6
0,1Cnew 0,1Cnew,6 1÷30 days
,6
0,5Cnew 0,5Cnew,6 6) Other
accessories 10,6
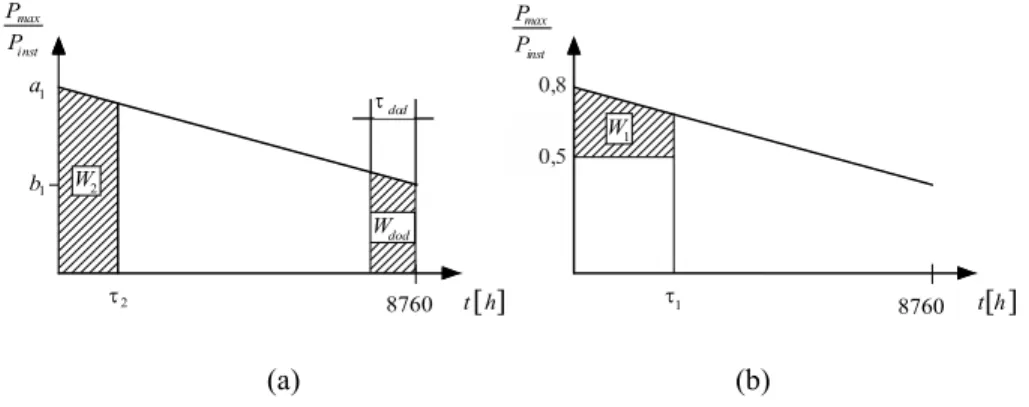
The application of the proposed model is illustrated in the case of a power transformer’ station (TS) 110/x kV/kV, where two 31,5 MVA power transformers are installed. Linearized diagram of annual duration of the load for the analyzed TS is shown in Fig. 1 [8]. Maximum load is 80% and minimum 40% of installed capacity, where Pinstal 2 31,563 MVA.
The parameters of distributions were determined based on the data exploitation of the annual intensity of power transformers major failures in the United States (Fig. 1). For adopted mean failure intensity av 0.015 year1of the power transformer for the first 30 years of exploitation, based on the curve of Fig. 1 and the data given in Table 1, using the least-squares method is obtained parameters of the Weibull distribution for individual components (Table 4). In the same table is presented lists of the parameters values in case if at each component individually installed CMS, based on data from Table 1 and
Table 2 [7, 11].
4
Modelling the Structure of the System Using SDS Method
SDS is used for modelling and simulation of complex dynamic systems with different computer programs [12]. There is a significant application in the analysis of complex dynamic systems, where it is possible to determine what the effects obtained on the system when making certain decisions. By creating SDS model, it is important to understand the causes and consequences of the problem which will be modelling. After the behavior of the system has been examined, dependences between the components in the system will be determined. This method was applied to different kinds of systems: social, environmental, manufacturing, service, biological, agricultural, health, etc. SDS model should have the following characteristics [13]:
2
W
1
W
dod
W
dod max
inst
P P
1
a
1
b
2
8760 t h
max inst
P P
2
inst
P
1
8760 t h
0,5 0,8
(a) (b)
describe any problem with the cause - consequence relations,
the application of mathematical formulas in the simulation system,
the possibility of applying a large number of variables,
the analysis of data obtained by simulating a change in the decision. Each model represents a simplification of the system. To be useful, it does not reflect the system in detail and will depend on the application of the model to solve a problem. The model needs to determine the most important elements of the system. This means simplifying the model, which will not be too complex for the purpose of practical analysis. These models have certain limitations with respect to inaccuracy and errors that can occur due to incorrectly create model.
Table 4
Weibull distribution parameters for components
k Component k Without CMS k CMS is available
'
k
1 Windings + oil 3,58 57,013 79,805
2 Core 3,58 111,395 155,927
3 Bushing 3,58 74,316 116,500
4 Tank 3,58 102,321 102,321
5 On-load tap-changer 3,58 54,872 80,213 6 Other accessories 3,58 98,808
When applying SDS method for the complex systems behavior analysis, there is commonly used modeling software such as: ARENA, OPEN MODELICA, DYNAMO, DYSMAP, ITHINK/STELLA, POWERSIM, VENSIM, etc.
4.1 VENSIM PLE software for system dynamic modeling
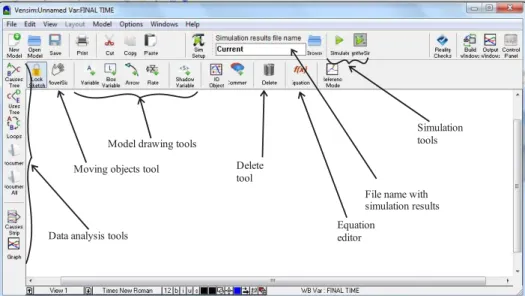
VENSIM PLE software is used for visual modeling that allows creating the models, documentation, system analysis, simulation and optimization of created dynamic systems models. This software tool developed by “Ventana Systems” in 1985 for solving management problems by using simulation [14]. On Fig. 2 provides an overview of the software-working environment.
The advantage of this software is that it allows calling external function (programmed in any programming language) that will be used for simulation model. It is possible to import models that were created in other software (such as MATLAB) used for modeling and simulation and adapt for their own needs.
displaying the system behavior and the relationship between the variables in the system. Based on these diagrams, the state of the system is determined, as well as the received information on which decisions are being made.
Data analysis tools
File name with simulation results Model drawing tools
Еquation editor Delete
tool
Simulation tools
Moving objects tool
Fig. 2 – VENSIM PLE working environment.
State
Inflows Outflows
Valves
Source Destination
Fig. 3 – The SFD elements.
The first step of the simulation model is creating this diagram. A certain value has to be assigned to every variable, and formulas important for describing the system behavior should be defined. In the SFD, a dynamic model of the system is represented by the elements shown in Fig. 3. The basic elements of SFD are as follows [15]:
Rectangle – shows different states in time t.
Inflows - thicker arrows that enter into rectangle (increases parameters of defined state).
Outflows - coming out of rectangle and represent changes in the state for a time interval
t t, dt
(reduced values of the state parameters). Clouds - represent sources and destinations of information flows. Source represents the state from which the model appears, and destinations represent a state of in which information is collected.
4.2 SFD of power transformers maintenance costs
When SFD model has been created at the beginning, it must define the initial model parameters.
The average annual damage due to undelivered EE EUEE due to
superposition of maintenance failure
EUEE due to power transformer failure
The price of undelivered EE
TEIC of corrective maintenance The price of
corrective maintenance The price of repair when
there is no spare part
The purchase price of the new element
Fig. 4 – SFD of power transformer corrective maintenance costs.
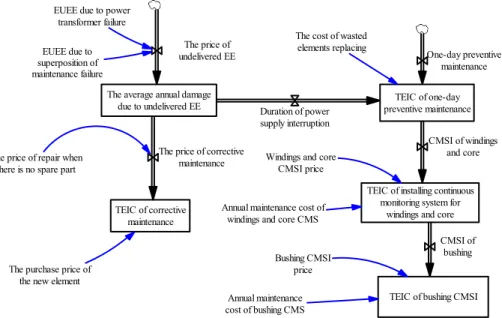
The average annual damage due to undelivered EE
TEIC of one-day preventive maintenance
TEIC of installing continuous monitoring system for
windings and core
TEIC of bushing CMSI The price of
undelivered EE
CMSI of windings and core
CMSI of bushing TEIC of corrective
maintenance
The price of corrective maintenance The price of repair when
there is no spare part
EUEE due to power transformer failure
EUEE due to superposition of maintenance failure
The cost of wasted elements replacing
Windings and core CMSI price
Annual maintenance cost of windings and core CMS
The purchase price of the new element
Duration of power supply interruption
Bushing CMSI price
One-day preventive maintenance
Annual maintenance cost of bushing CMS
Fig. 5 –SFD of power transformer maintenance costs in case of CMSI.
Abbreviations used in the following figures are: TEIC – Total Expected Interruption Costs, EUЕЕ – Expected Undelivered Electrical Energy.
4.3 Simulation of power transformer total expected exploitation costs using Vensim software
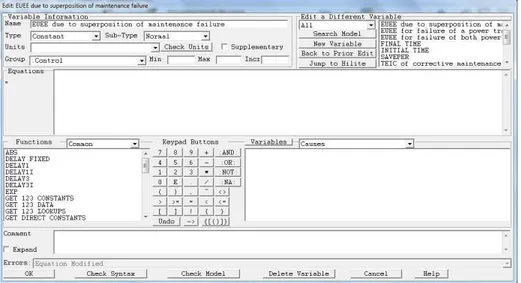
To perform a simulation of created model that is represented by the SFD, it is essential to enter correct formula for each using Equations icon. The editor is obtained by clicking on any variable as shown in Fig. 6. In the editor section Variable Information is enter basic information such as Name, Type, Units, etc. Equations could be entered into the middle part of editor, labeled as Equations where it is possible to use the system defined function given in section Functions.
If the user enters the wrong name of variable or formula in section Errors it will be reported errors review. Sections Check Syntax and Check Model test the syntax of the given equations and models and perform simulation. If there is any error, the simulation will not start until the error is corrected.
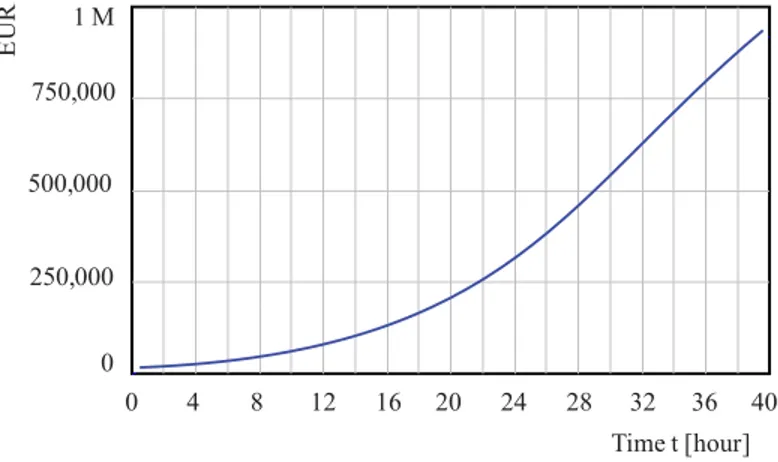
The values that are obtained by simulating the costs could be presented with tools which are found on the right side of the working environment. Fig. 7 shows the graph which simulates the expected total costs of corrective maintenance for planned exploitation period of 40 years. The implementation of this strategy of maintaining obtains the maximum maintenance costs.
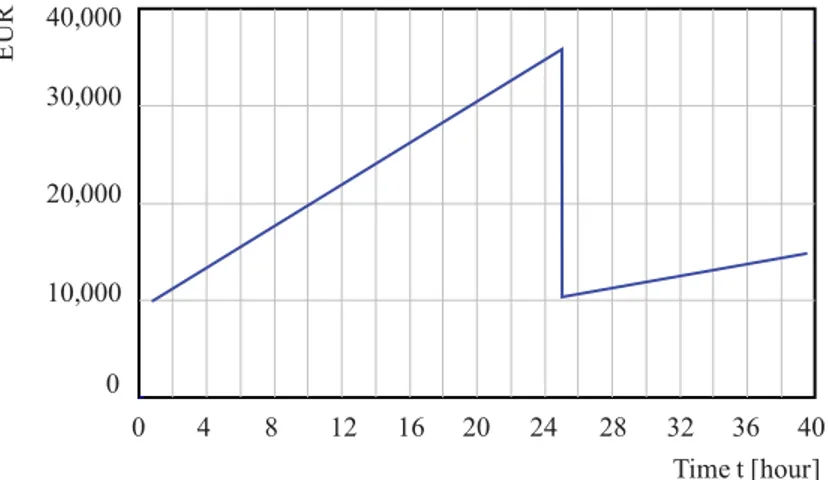
Installation CMS of windings and core is justified from the first year of power transformer exploitation. They will be installed at every ten years, as follows: at the beginning of 11th, 21st and 31st exploitation year. Installation CMS of bushings shall be from first exploitation year. It is important to point out that after the implementation of these activities during the planning period of 40 years, it is not justified to implement a one-day maintenance, nor oil regeneration, nor insulation system regeneration. It remains to analyze the justification of spare parts purchase and implementation of power transformer revitalization.
0 250,000 500,000 750,000 1 M
0 4 8 12 16 20 24 28 32 36 40
Time t hour[ ]
EU
R
TEIC of corrective maintenance
Fig. 7 – Simulation graph of power transformer total expected mainenance costs in a case of corrective maintenance.
Gradual analysis has simply calculated that it is justified to obtain spare part of:
tap charger from the beginning of the 9th year,
windings since the beginning of the 10th year,
tank from the beginning of 14th years,
other equipment from the beginning of 15th years and
implement the revitalization of the transformer at the beginning of 25th year [7]. In this way, there is no need for the acquisition of the spare core.
TIEC of continuous system moninoring installation 0
10,000 20,000 30,000 40,000
0 4 8 12 16 20 24 28 32 36 40
E
UR
Time t hour[ ]
Fig. 8 – Simulation graph of power transformer minimal total expected mainenance costs.
5 Conclusion
The importance of the defined dynamic model is to determine the costs that are incurred upon the supplier of EE and consumers due to the failures occurrence. The implementation of preventive activities such as installing CMS on the transformer components is intended to carry out minimization of costs and increase equipment availability. In addition to these preventive activities can be carried out number of other activities such as spare parts purchasing, the revitalization of transformers, oil changes, etc. All these activities are aimed at reducing costs due to unavailability and increase power transformer exploitation life [17].
Application of the SDS method at cost simulation aims to identify extreme minimum and maximum maintenance costs without the use of a reserve power transformer.
6 Acknowledgement
The second author is partially supported by the by the Serbian Ministry of Science, projects III 41025 and OI 171007.
7 References
[1] J. Nahman, V. Mijailović: Selected Chapters from the High-Voltage Switchgears,
Akademska misao, Belgrade, Serbia, 2002. (In Serbian).
[3] A. van Schijndel: Power Transformer Reliability Modelling. PhD Thesis, University of Technology, Eindhoven, The Netherlands, 2010.
[4] H. Ge: Maintenance Optimization for Substations with Aging Equipment, PhD Thesis,
University of Nabraska –Linkoln, Lincoln, NE, USA, 2010.
[5] G. Nourbakhsh: Reliability Analysis and Economic Equipment Replacement Appraisal for Substation and Sub-Transmisssion Systems with Explicit Inclusion of Non-Repairable Failures, PhD thesis, Queensland University of Technology, Queensland, Australia, 2011. [6] A. van Schijndel, P.A.A.F. Wouters, E.F. Steennis, J.M. Wetzer: Approach for an Integral
Power Transformer Reliability Model, European Transactions On Electrical Power, Vol. 22, No. 4, May 2012, pp. 491 – 503.
[7] O. Ristic, V. Mijailovic: Method for Determining Optimal Power Transformers Exploitation Strategy, Electric Power Systems Research, Vol. 83, No. 1, Feb. 2012, pp. 255 – 261.
[8] V. Mijailovic: Method for Effects Evaluation of Some Forms of Power Transformers
Preventive Maintenance, Electric Power Systems Research, Vol. 78, No. 5, May 2008, pp. 765 – 776.
[9] V. Mijailovic: Optimal Spares Availability Strategy for Power Transformer Components, Electric Power Systems Research, Vol. 80, No. 8, Aug. 2010, pp. 987 – 992.
[10] R.A. Jongen, E. Gulski, P.H.F. Morshuis, J.J. Smit, A.L.J. Janssen: Statistical Analysis of
Power Transformer Component Life Time Data, 8th International Power Engineering
Conference, Singapore, 03-06 Dec. 2007, pp. 1273 – 1277.
[11] A. van Schijndel, J.M. Wetzer, P.A.A.F. Wouters: Remaining Lifetime Modelling for
Replacement of Power Transformer Populations, International Conference on Condition Monitoring and Diagnosis, Beijing, China, 21-24 April 2008, pp. 597 – 600.
[12] J. Sterman: Business Dynamics Systems Thinking and Modeling for a Complex World,
Irvin - McGraw Hill Higher Education, ISBN 0 - 07 - 231135 - 5, 2000, 982 p.
[13] E. Kremers: Modelling and Simulation of Electrical Energy Systems through a Complex Systems Approach using Agent-Based Models, PhD Thesis, KIT Scientific Publishing, Karlsruhe, Germany, 2013.
[14] http://vensim.com/
[15] P. Basirat, H. Fazlollahtabar, I. Mahdavi: System Dynamics Meta-Modelling for Reliability Considerations in Maintenance, International Journal of Process Management and Benchmarking, Vol. 3, No. 2, 2013, pp.136 – 153.
[16] R. Chumai: System Dynamic Modeling of Plant Maintenance Strategy in Thailand, 27th International Conference of the System Dynamics Society, Albuquerque, NM, USA, 26-30 July 2009.
![Table 1 Power transformer component reliability data and removal duration of certain categories failures [7]](https://thumb-eu.123doks.com/thumbv2/123dok_br/18242738.341378/6.702.106.600.254.667/transformer-component-reliability-removal-duration-certain-categories-failures.webp)