Submitted27 March 2014 Accepted 10 May 2014 Published27 May 2014
Corresponding author Asa Johannesen, asajoh@fiskaaling.fo
Academic editor Mark Hay
Additional Information and Declarations can be found on page 12
DOI10.7717/peerj.408
Copyright 2014 Johannesen et al.
Distributed under
Creative Commons CC-BY 4.0
OPEN ACCESS
Prey aggregation is an e
ff
ective olfactory
predator avoidance strategy
Asa Johannesen1,2, Alison M. Dunn2and Lesley J. Morrell3 1Marine Centre, Fiskaaling, Hvalv´ık, Faroe Islands
2School of Biology, University of Leeds, United Kingdom
3School of Biological, Biomedical and Environmental Sciences, University of Hull, United Kingdom
ABSTRACT
Predator–prey interactions have a major effect on species abundance and diver-sity, and aggregation is a well-known anti-predator behaviour. For immobile prey, the effectiveness of aggregation depends on two conditions: (a) the inability of the predator to consume all prey in a group and (b) detection of a single large group not being proportionally easier than that of several small groups. How prey aggregation influences predation rates when visual cues are restricted, such as in turbid water, has not been thoroughly investigated. We carried out foraging (predation) experiments using a fish predator and (dead) chironomid larvae as prey in both laboratory and field settings. In the laboratory, a reduction in visual cue availability (in turbid water) led to a delay in the location of aggregated prey compared to when visual cues were available. Aggregated prey suffered high mortality once discovered, leading to better survival of dispersed prey in the longer term. We attribute this to the inability of the dead prey to take evasive action. In the field (where prey were placed in feeding stations that allowed transmission of olfactory but not visual cues), aggregated (large groups) and semi-dispersed prey survived for longer than dispersed prey—including long term survival. Together, our results indicate that similar to systems where preda-tors hunt using vision, aggregation is an effective anti-predator behaviour for prey avoiding olfactory predators.
Subjects Animal Behavior, Ecology, Marine Biology
Keywords Olfaction, Aggregation, Predator–prey interactions, Stickleback, Gasterosteus aculeatus, Prey detection
INTRODUCTION
leads to a situation where fewer predators survive because cost of finding a prey group is high, and more prey survive because predators only consume a few prey per encounter (Turner & Pitcher, 1986;Turesson & Br¨onmark, 2007).
Prey detection is likely to be dependent on a predator’s sensory acuity and modality (Cain, 1985). As a group of prey grows, the ability of a visual predator to detect the group is predicted to increase at a slower rate; that is, a group ofNindividuals should be less than
Ntimes more detectable than a single individual (Brock & Riffenburgh, 1960;Treisman, 1975;Turner & Pitcher, 1986). This is supported by empirical evidence for visual predators, where a non-proportional relationship between prey group size and detection rate has been found for humans seeking computer generated prey (Jackson et al., 2005), sticklebacks (Gasterosteus aculeatus) attackingDaphniaswarms (Ioannou et al., 2011) and great tits (Parus major) searching for aposematic prey (Riipi et al., 2001).
Whether encounter-dilution effects operate when predators use other sensory modali-ties is unclear. Close neighbours are likely to produce odour plumes that interact, increas-ing both the area of the odour plume and the amount of stimulant (Monismith et al., 1990). Treisman (1975)suggests that a group ofNindividuals should be detectable by an olfactory predator at a distanceNtimes as great as that for a single prey, resulting in an area in which the group can be detectedN2times as large as for a single prey (or a volumeN3times as large). If this is the case, encounter-dilution would not take place, and grouping would not be favoured unless the predator is highly sensitive to olfactory cues and does not preferen-tially target large groups over small ones (Cain, 1985). Recent empirical data indicates that aggregation increases risk of predation by olfactory predators (Whitton et al., 2012;Wilson & Weissburg, 2012) but Andersson et al. find that the distance at which a group can be detected increases asymptotically with group size (Andersson, L¨ofstedt & Hamb¨ack, 2013).
time when dispersed and aggregated, and in clear (visual and olfactory cues available) and turbid (no visual cues available) water. Additionally, we tested the effect of three levels of aggregation in the field in order to include more naturally sized foraging settings and multiple predators.
METHODS
Laboratory experiment—does turbidity affect best aggregation strategy?
Study species and housing
Three spined sticklebacks (36–46 mm total body length) were caught by netting from small water bodies in Saltfleet, Lincolnshire (53◦25′59.55′′N, 0◦10′49.41′′E) in November 2010 and 2011. On both occasions, 250 fish were caught and were transported in commercial fish bags to the aquarium facilities at the University of Leeds. Fish were housed in groups of approximately 50 in grey plastic tubs(60×90×45 cm)with gravel substrate and artificial plants for environmental enrichment, at 14±2◦C and on a 14:10 h light:dark cycle. Fish
were fedad libitumon defrosted frozen bloodworm (chironomid larvae, these were also the prey species in the experiment) from a commercial fish food supplier once daily. Each group of fish was released one year after capture at the location where caught (in agreement with the Home Office and DEFRA).
Procedure
Trials were video recorded from above. In each trial a single fish was released under the floating shelter to acclimatize and time to emerge (be fully free of the shelter) was recorded. Fish were only used once and those that did not hide under the shelter on release or did not emerge within 15 min were excluded from the experiment (final sample sizes; clear water and aggregated prey:N=13, clear water and dispersed prey:N=15, turbid water and aggregated prey:N=13, turbid water and dispersed prey:N=15). Turbidity in the arena decreased over time, from 391.15±9.35 NTU before fish were released to 286.83±9.1 NTU after 35 min (measured before fish were captured after the trial). To ensure that visibility remained low in turbid water trials, fish were given a maximum of 35 min in the foraging arena, consisting of up to 15 min before emergence, plus 20 min during which foraging was recorded. We assessed the effect of environment (clear/turbid) on time to emergence using a negative binomial GLM to account for overdispersion in the Poisson-distributed data. There was no effect of environment on time to emergence (z= −1.63,df =61,P=0.1). This suggests that our manipulation of visual cues did not influence motivation to hunt for prey and/or perceived predation risk of the fish.
Data on foraging behaviour and time of prey capture for each prey item were manually extracted from videos using Etholog (2.25) and Windows Media Player. Sticklebacks vary considerably in boldness (Ward et al., 2004;Frost et al., 2007;Harcourt et al., 2010), leading to variation in time spent hiding (and therefore not foraging). Thus, to standardize search time for all fish, we recorded prey capture as a function of time spent actively swimming.
Field experiment: do prey in a more natural setting benefit from aggregating?
Our laboratory experiment necessarily constrained the search area available for each predator, increasing the likelihood of chance encounter. Furthermore, it tested the effect of aggregation of prey on survival, but was limited by the small number of prey. As predators were able to consume all prey without reaching satiation, our experiment did not include factors such as the dilution of individual risk (Wrona & Dixon, 1991) once discovered. In ponds and lakes, search volume or area is much greater, and there may be multiple predators (individuals or species) in the environment, affecting how many prey may be consumed and increasing the likelihood of local or stimulus enhancement (where the activity of an individual draws the attention of an observer towards a location or object; (Spence, 1937;Thorpe, 1956)), or social learning (Brown & Laland, 2003). To test the real-world validity of some of our findings, we also carried out a field experiment to assess the survival of visually hidden prey at different levels of aggregation. In order to ensure that cue availability was high enough in these larger water bodies, more prey were used. Because of this, aggregated and semi-dispersed prey groups were large enough to satiate a single predator, thereby allowing for dilution of individual risk within the experiment. The difference in setting and prey number make these two studies complementary rather than directly comparable.
Figure 1 Feeding station used in the field.“Feeding station” after use in field trials. Cotton thread attached at the top assisted in positioning and retrieval of stations and to the right is an entrance hole with “doors” intact to ensure opening was not blocked by stray material. A similar opening is found on the opposite side of the station.
than those in warmer climates (Malmquist et al., 2002;Brodersen et al., 2011). The largest predators in a typical pool above the tidal line areGammarus duebeni(Roberts, 1995) and sometimes three spined sticklebacks (Gasterosteus aculeatus). These ponds also contain a range of invertebrate prey species, including midge larvae which could be found in all ponds included in this experiment. Ponds(N=11)were 5–50 m2in size, all contained sticklebacks, some containedGammarus, and none connected directly to any other pond in the study. Turbidity in these ponds varies naturally, but was low during our trials (below 10 NTU for all ponds). Visual cues were blocked with the use of “feeding stations” with opaque walls that allowed for transmission of olfactory cues.
Procedure
(Frost et al., 2007;Archard & Braithwaite, 2011). To reduce disturbance, feeding stations were left in the ponds for the duration of the trials.
In each pond, we investigated three levels of prey aggregation: (1) aggregated where 30 prey were placed in one of the 6 feeding stations while the remaining 5 stations remained empty, (2) semi-dispersed with 10 prey in each of 3 of the 6 stations and 3 empty stations, and (3) dispersed prey where we placed 5 prey in each of the 6 stations. Aggregated prey were allocated to a feeding station at random and semi-dispersed prey were allocated to alternating feeding stations (starting point chosen at random). The order in which the treatments were placed in each pond was systematically rotated ensuring each possible trial sequence was included at least once and no more than twice. To minimize any possible effects of learning and to reduce disturbance, a minimum of 4 days was left between each trial within a pond. Prey used in these trials were frozen bloodworm sourced from a local pet shop. The bloodworm were defrosted and the refrozen in tap water ice cubes in the prey groups sizes above for ease of handling in the field.
On the day of each trial, the ice cubes containing prey were positioned in their allocated feeding stations. Plain ice cubes (containing no prey) were placed in all other stations to control for the presence of the observer at each station and any cues from the tap water that may have been used by potential predators. After 10, 20, 30, 40, 50, 70 and 90 min, the observer returned to the pool and counted the number of uneaten prey in each station. Stations containing no prey were also checked to control for the presence of the observer and the disturbance caused by removing and replacing the feeding station. The timer was stopped when the observer returned to the pool, and restarted when counting was complete (approximately 10 min), so that the time while disturbed by researcher was not included in the time available to the fish to forage in the stations. It is likely that the presence of the observer disrupted normal foraging behaviour, so care was taken to ensure that this disruption was equal for all treatment groups. However, it is likely that detection would be faster than our data suggests due to this disruption. For this reason, we do not presume to make any claims about absolute detection times, but rather relative differences between prey group sizes in this study.
Analysis
All data analysis was carried out in R v 2.13.0 (R Core Team, 2013). For the laboratory data, prey within a trial were not independent of one another. To account for this, we created multiple events (each predator could consume multiple prey ‘events’) models using the Andersen-Gill version of Cox Proportional Hazards models in the package ‘survival’ (Therneau & Grambsch, 2000;Therneau & Lumley, 2011). Using this method, each prey item is considered an observation (whether consumed or not) leading to model sample sizes referring to individual prey items (8 per trial) rather than the predator or trial numbers. By clustering on ‘trial’ (this is akin to adding a random effect), we include in the model that individual prey within trials are not independent.
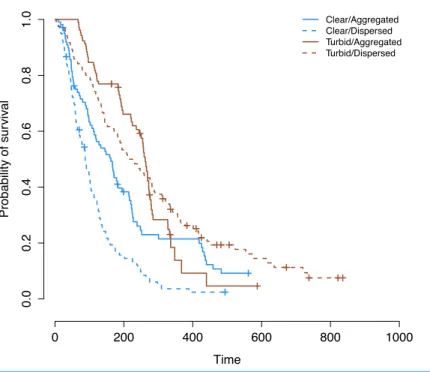
Figure 2 Overall prey survival in the laboratory.Kaplan–Meier survival curves for the four groups of prey. Crosses signify censored events where the observations for a particular trial ended before all prey were eaten. The curve for aggregated prey in turbid water shows a different pattern to the curves for the other three treatments.
P<0.001; (Therneau & Grambsch, 2000)). When this assumption is violated, it is an indication that the survival curves are not the same shape and do not follow similar hazards distributions (i.e., the risk to a prey individual in one treatment is not a simple multiplication of the risk in another treatment, for any given time point). This is especially problematic when survival curves cross as they do in our case;Fig. 2 (Therneau & Grambsch, 2000). In order to remedy this, we split our data set in two (“initial prey discovery” and “subsequent survival of prey”) and analyzed these separately (Fig. 3). The assumption of proportional hazards was met in the case of initial prey discovery (Chi-squared=3.27,P=0.351). In the case of subsequent prey discovery, the assumption of proportional hazards was not met (Chi-squared=176.4,P<0.001). However, survival curves did not cross (Fig. 3B), so although predictions based on this model should be treated with caution (Therneau & Grambsch, 2000), it does give an indication of whether the survival of prey differed between treatments. Here, we use the term ‘survival’ in the context of survival analysis, where a prey individual ‘survives’ if it avoids being consumed by a predator (in reality, all prey in our experiments are already dead).
Figure 3 Survival on first prey in trial (A) and subsequent prey (B).Kaplan–Meier curves for time to discovery of first (A) and subsequent (B) prey. Brown lines represent turbid water and blue lines clear water. Solid lines represent aggregated prey and dashes represent dispersed prey. In (B), the time axis was logged to improve clarity.
scores (Sun, 1996) indicate the differences and direction of difference between groups, and are chosen for analysis as they are flexible with respect to the duration between interval censored events and are the default option in the ‘interval’ package for this reason (Fay & Shaw, 2010).
Ethical statement
As experiments with fish fall outside of the remit of the University of Leeds Ethical Board and no licensed procedures were used, this study was not subject to ethical review.
However, laboratory experiments were carried out in accordance with University of Leeds guidelines and in agreement with Home Office licensed technical staffat the animal facility. Similarly, field experiments were carried out in accordance with local laws and reg-ulations. Great care was taken to ensure optimal welfare for all fish involved in this study.
RESULTS
Laboratory experiment—does turbidity affect best aggregation strategy?
Figure 4 Field trial survival. Interval censored survival curves for the field data. Possible stepwise changes in survival lie within the shaded area for each curve. Aggregated: solid line, light shading, semi-dispersed: dashed line, medium shading, dispersed: dotted line, dark shading.
hazards was not met (Chi-squared=85.6,P<0.001; see above). This suggests that overall patterns of survival differ significantly as a function of treatment grouping.
When detection of first and subsequent prey are analyzed separately, it is clear that aggregation is beneficial in increasing the time to initial detection in both clear and turbid water, but has a greater effect in turbid water. There was a significant interaction between water clarity and level of aggregation (CoxPH;z=2.24,n=56,P=0.025) on the time until the first prey was discovered (Fig. 3A). Dispersed prey are discovered more quickly in turbid water than clear water while aggregated prey are discovered more quickly in clear water than turbid water (Fig. 3A).
For time to consume subsequent prey, there was also a significant interaction between the water clarity and level of aggregation (CoxPH,z= −3.173,n=302,P=0.002). Survival is highest for dispersed prey in turbid water, while aggregated prey survive longer in clear water than in turbid water (Fig. 3B). Therefore, after the discovery of the first prey, aggregation appears to be beneficial in clear water (aggregated prey survive longer in clear water than in turbid water), but not in turbid water (where dispersed prey have higher survival).
Field experiment: do prey in a more natural setting benefit from aggregating?
to no difference between aggregated and semi-dispersed prey (Suns’ score statistics: dispersed: 42.17, aggregated:−19.11, semi-dispersed:−23.06).
DISCUSSION
The data gathered both in the laboratory and in the field reveal that aggregation as a predator avoidance strategy is effective both for visually conspicuous and concealed prey.
Aggregated prey in the lab, with and without visual cues available to the predator, had improved survival (i.e., were less likely to be consumed) over dispersed prey in terms of initial detection. However, once an aggregation was detected, the prey did not survive (avoid consumption) for very long. This likely occurred because predators were able to find and consume all the prey in an aggregation after having discovered the first prey, and the dead prey could not take any evasive action in response to the proximity of the predator.
In the natural pond setting, overall survival of aggregated and semi-dispersed prey was higher than that of dispersed prey. Additionally, the rapid decrease in aggregated prey numbers once discovered in the lab was not observed in the field. This lack of sudden mortality post discovery is likely due to the large number of prey satiating the predator and thereby providing dilution of risk.
Due to the necessary differences in design between our field and laboratory experiments (see methods), we discuss our results within experimental context rather than making direct comparisons between the field and lab data.
In the field, we observed that prey removal in non-aggregated treatments was dispersed between stations, indicating that fish were not clearing out one station and then swimming to the next. The overall poorer survival of dispersed prey compared to semi-dispersed and aggregated prey suggests that aggregation should be an adaptive strategy for species living in water where visual cues are limited or absent as well as where the predator of immediate concern does not use visual cues.
Aggregation as an anti-predator strategy when the predator does not use visual cues is seen in a number of species such as the sediment dwellingChironomus ripariuslarvae, who aggregate in response to predator presence (Rasmussen & Downing, 1988) and stream dwelling caddis flies (Rhyacophila vao) that avoid predation by the planarian predator
Polycelis coronataby communally pupating on the same stone (Wrona & Dixon, 1991). Taylor’s (1977) study on southern grasshopper mice found that buried aggregated prey were found less easily than dispersed prey. Our data indicate that aggregation can be beneficial to prey in decreasing risk of detection, but also that aggregation is only truly effective if aggregations are large enough to dilute predation risk once discovered if prey are immobile. In many systems prey are at risk from several species of predators and aggregation in response to one predator may be counter-productive if another predator is present (Long et al., 2007). Showing behavioural flexibility in response to predator presence may be a better strategy than simply aggregating by default (Reimer & Tedengren, 1997; Kobak, Kakareko & Pozna´nska, 2010).
risk in the predator. Once discovered, aggregated prey did not survive for long, but those in clear water survived for longer than those in turbid water. Although time to emergence was not affected by turbidity, we suggest that a perceived risk involved in foraging in clear open water (Abrahams & Kattenfeld, 1997) and the decreased vigilance resulting from foraging activities (Brown, 1999) combined to reduce foraging effort and allowed aggregated prey to survive longer once discovered in clear water than in turbid water.
In the field, aggregated prey did not experience the accelerated death rate once discovered that they did in the laboratory. There is some indication that benefits to prey depend on size or number of predators (Brock & Riffenburgh, 1960) and sticklebacks are able to learn from visual foraging cues from conspecifics (Webster & Laland, 2012), resulting in increased discovery if one stickleback in the group starts consuming prey. However darkness or turbid water should reduce the likelihood of this happening, as initial discovery of prey by one predator would not be observed visually by other predators. Lateral line detection of the movement of conspecifics (Coombs, 1999) is likely to be too short-range to be relevant in this context, however the importance of noises generated by foraging might warrant further exploration. In our experiment, prey as well as any predator feeding on them, were concealed in feeding stations, which may have prevented visual social cues from being transmitted to other sticklebacks in the area. Prey groups were also much larger than in the laboratory, which likely prevented individual sticklebacks from consuming all prey. Together, this may have limited the rapid consumption of prey seen in the laboratory.
The benefits of aggregation are likely to depend on the sensory abilities of the predator and a predator that is unable to detect prey will approach random search efficiency (Cain, 1985). However, a predator that is able to detect the presence of prey and perhaps even an indication of the number of prey should perform better than random by increased search effort, especially if that effort can be focused in the general area surrounding prey. Sticklebacks use both visual and olfactory cues in foraging, and when visual cues are not available, the presence of olfactory cues increases foraging efficiency (Johannesen, Dunn & Morrell, 2012). Therefore, strong cue concentrations around aggregated prey could increase search effort, potentially countering the benefit prey derive from aggregating. Similarly, theory on the relationship between olfactory cues and detection of prey groups predicts that grouping should not be favoured as detection radius increases with group size (Treisman, 1975). In our study, however, it is clear that aggregation is beneficial to prey, at least at the predator–prey ratios tested here, as our aggregated prey survived for longer than the dispersed prey. There is some evidence to suggest that olfactory detection radius increases with group size (Andersson, L¨ofstedt & Hamb¨ack, 2013), but it is still not clear how increased detection affects aggregated prey in different systems such as one where only one prey item is captured and the rest escape and how predator sensory acuity interacts with prey group sizes.
Our study provides insight into some adaptive reasons to aggregate in a system that is different from the usual visual predator system. Many natural predators rely on olfactory cues but the consequences of this have been relatively neglected by scientists, likely because of the dominant importance of vision to humans. We demonstrate that aggregations are beneficial to prey avoiding non-specialist olfactory foragers. Since predation is a fundamental interaction structuring communities, changes in the relative importance of vision and olfaction in prey detection (due to e.g., eutrophication) could have far reaching implications ecologically. Our work provides a step towards improved ability to predict these effects.
ACKNOWLEDGEMENTS
We wish to acknowledge Graeme Ruxton for valuable feedback on this manuscript. We also wish to acknowledge Charlotte Leviston and Hugin K´arason Mortensen for their invaluable help in gathering data for the laboratory and field studies respectively. Finally, we wish to acknowledge Delbert Smee and Rachel Lasley-Rasher for helpful comments on our manuscript.
ADDITIONAL INFORMATION AND DECLARATIONS
Funding
This work was funded by the Faroese Research Council as part of a PhD stipend for Asa Johannesen. The funders had no role in study design, data collection and analysis, decision to publish, or preparation of the manuscript.
Grant Disclosures
The following grant information was disclosed by the authors: Faroese Research Council.
Competing Interests
The authors declare there are no competing interests.
Author Contributions
• Asa Johannesen conceived and designed the experiments, performed the experiments, analyzed the data, contributed reagents/materials/analysis tools, wrote the paper, prepared figures and/or tables.
• Alison M. Dunn reviewed drafts of the paper, provided feedback and helpful comments before and during field work.
Animal Ethics
The following information was supplied relating to ethical approvals (i.e., approving body and any reference numbers):
As experiments with fish fall outside of the remit of the University of Leeds Ethical Board and no licensed procedures were used, this study was not subject to ethical review.
However, laboratory experiments were carried out in accordance with University of Leeds guidelines and in agreement with Home Office licensed technical staffat the animal facility. Similarly, field experiments were carried out in accordance with local laws and reg-ulations. Great care was taken to ensure optimal welfare for all fish involved in this study.
Data Deposition
The following information was supplied regarding the deposition of related data: The full dataset is on FigShare:http://figshare.com/articles/Dataset for aggregation
study/801808.
REFERENCES
Abrahams MV, Kattenfeld M. 1997.The role of turbidity as a constraint on predator–prey interactions in aquatic environments.Behavioral Ecology and Sociobiology 40:169–174 DOI 10.1007/s002650050330.
Andersson P, L¨ofstedt C, Hamb¨ack PA. 2013.How insects sense olfactory patches—the spatial scaling of olfactory information.Oikos122:1009–1016DOI 10.1111/j.1600-0706.2012.00037.x. Archard GA, Braithwaite VA. 2011.Variation in aggressive behaviour in the poeciliid fish
Brachyrhaphis episcopi: population and sex differences.Behavioural Processes86:52–57 DOI 10.1016/j.beproc.2010.09.002.
Brock VE, Riffenburgh RH. 1960.Fish schooling: a possible factor in reducing predation.ICES Journal of Marine Science25:307–317DOI 10.1093/icesjms/25.3.307.
Brodersen J, Malmquist HJ, Landkildehus F, Lauridsen TL, Amsinck SL, Bjerring R,
Søndergaard M, Johansson LS, Christoffersen KS, Jeppesen E. 2011.Short- and long term niche segregation and individual specialization of brown trout (Salmo trutta) in species poor Faroese lakes.Environmental Biology of Fishes93:305–318DOI 10.1007/s10641-011-9914-z. Brown JS. 1999.Vigilance, patch use and habitat selection: foraging under predation risk.
Evolutionary Ecology Research1:49–71.
Brown C, Laland KN. 2003.Social learning in fishes: a review.Fish and Fisheries4:280–288 DOI 10.1046/j.1467-2979.2003.00122.x.
Cain ML. 1985.Random search by herbivorous insects: a simulation model.Ecology66:876–888 DOI 10.2307/1940550.
Chapman BB, Morrell LJ, Tosh CR, Krause J. 2010.Behavioural consequences of sensory plasticity in guppies.Proceedings of the Royal Society B: Biological Sciences277:1395–1401 DOI 10.1098/rspb.2009.2055.
Chesson P, Kuang JJ. 2008.The interaction between predation and competition.Nature
456:235–238DOI 10.1038/nature07248.
Coombs S. 1999.Signal detection theory, lateral-line excitation patterns and prey capture
Fay MP, Shaw PA. 2010.Exact and asymptotic weighted logrank tests for interval censored data: the interval R package.Journal of Statistical Software36:1–34.
Ferrari MCO, Lysak KR, Chivers DP. 2010.Turbidity as an ecological constraint on learned predator recognition and generalization in a prey fish.Animal Behavior 79:515–519 DOI 10.1016/j.anbehav.2009.12.006.
Foster WA, Treherne JE. 1981.Evidence for the dilution effect in the selfish herd from fish
predation on a marine insect.Nature293:466–467DOI 10.1038/293466a0.
Frost AJ, Winrow-Giffen A, Ashley PJ, Sneddon LU. 2007.Plasticity in animal personality traits: does prior experience alter the degree of boldness?Proceedings of the Royal Society B: Biological Sciences274:333–339DOI 10.1098/rspb.2006.3751.
Gentleman R, Vandal A. 2011.Icens: NPMLE for censored and truncated data: R package version 1.24.0.
Griffiths C, Richardson C. 2006.Chemically induced predator avoidance behaviour in the burrowing bivalveMacoma balthica.Journal of Experimental Marine Biology and Ecology
331:91–98DOI 10.1016/j.jembe.2005.10.002.
Harcourt JL, Biau S, Johnstone RA, Manica A. 2010. Boldness and information use in three-spined sticklebacks.Ethology116:440–447DOI 10.1111/j.1439-0310.2010.01757.x. Ioannou CC, Bartumeus F, Krause J, Ruxton GD. 2011.Unified effects of aggregation reveal
larger prey groups take longer to find.Proceedings of the Royal Society B: Biological Sciences
278:2985–2990DOI 10.1098/rspb.2011.0003.
Jackson AL, Brown S, Sherratt TN, Ruxton GD. 2005.The effects of group size, shape and composition on ease of detection of cryptic prey.Behaviour142:811–826
DOI 10.1163/1568539054729105.
Johannesen A, Dunn AM, Morrell LJ. 2012.Olfactory cue use by three-spined sticklebacks foraging in turbid water: prey detection or prey location?Animal Behavior 84:151–158 DOI 10.1016/j.anbehav.2012.04.024.
Kobak J, Kakareko T, Pozna ´nska M. 2010.Changes in attachment strength and aggregation of zebra mussel,Dreissena polymorphain the presence of potential fish predators of various species
and size.Hydrobiologia644:195–206DOI 10.1007/s10750-010-0113-2.
Krause J, Ruxton GD. 2002.Living in groups. Oxford: Oxford University Press.
Leduc AOHC, Munday PL, Brown GE, Ferrari MCO. 2013.Effects of acidification on olfactory-mediated behaviour in freshwater and marine ecosystems: a synthesis.Philosophical Transactions of the Royal Society B: Biological Sciences 368(1627): Article 20120447 DOI 10.1098/rstb.2012.0447.
Long JD, Smalley GW, Barsby T, Anderson JT, Hay ME. 2007.Chemical cues induce consumer-specific defenses in a bloom-forming marine phytoplankton.Proceedings of the National Academy of Sciences of the United States of America104:10512–10517
DOI 10.1073/pnas.0611600104.
Malmquist HJ, Ingimarsson F, J ´ohannsd ´ottir EE, ´Olafsson JS, G´ıslason GM. 2002.Zoobenthos in the littoral and profundal zones of four faroese lakes.Annales Societatis Scientiarum Færoensis
Supplement 36:79–93.
Monismith SG, KoseffJR, Thompson JK, O’Riordan CA, Nepf HM. 1990.A study of model
bivalve siphonal currents.Limnology and Oceanography35:680–696
Preisser EL, Orrock JL, Schmitz OJ. 2007.Predator hunting mode and habitat domain alter nonconsumptive effects in predator–prey interactions.Ecology88:2744–2751
DOI 10.1890/07-0260.1.
R Core Team. 2013.R: a language and environment for statistical computing. Vienna: R Foundation for Statistical Computing.
Rasmussen JB, Downing JA. 1988.The spatial response of chironomid larvae to the predatory leechNephelopsis obscura.The American Naturalist131:14–21DOI 10.1086/284770.
Reimer O, Tedengren M. 1997.Predator-induced changes in byssal attachment, aggregation and migration in the blue mussel,Mytilus edulis.Marine and Freshwater Behaviour and Physiology
30:251–266DOI 10.1080/10236249709379029.
Riipi M, Alatalo RV, Lindstr¨om L, Mappes J. 2001.Multiple benefits of gregariousness cover detectability costs in aposematic aggregations.Nature413:512–514DOI 10.1038/35097061. Roberts G. 1995.Salt-marsh crustaceans, gammarus duebeni and palaemonetes varians as
predators of mosquito larvae and their reaction to bacillus thuringiensis subsp. israelensis.
Biocontrol Science and Technology5:379–386DOI 10.1080/09583159550039837. Spence KW. 1937. Experimental studies of learning and the higher mental processes in
infra-human primates.Psychological Bulletin34:806–850DOI 10.1037/h0061498.
Sun J. 1996.A non-parametric test for interval-censored failure time data with application to AIDS studies.Statistics in Medicine15:1387–1395
DOI 10.1002/(SICI)1097-0258(19960715)15:13<1387::AID-SIM268>3.0.CO;2-R. Taylor RJ. 1977.The value of clumping to prey: experiments with a mammalian predator.
Oecologia30:285–294DOI 10.1007/BF01833636.
Therneau TM, Grambsch PM. 2000.Modeling survival data: extending the Cox model. London: Springer.
Therneau TM, Lumley T. 2011.Survival: survival analysis, including penalised likelihood: R package version 2.36-5.
Thorpe WH. 1956.Learning and instinct in animals. Cambridge, MA: Harvard University Press. Treisman M. 1975.Predation and the evolution of gregariousness. I. Models for concealment and
evasion.Animal Behavior23:779–800DOI 10.1016/0003-3472(75)90106-2.
Turesson H, Br¨onmark C. 2007.Predator–prey encounter rates in freshwater piscivores: effects of
prey density and water transparency.Oecologia153:281–290DOI 10.1007/s00442-007-0728-9.
Turnbull BW. 1976.The empirical distribution function with arbitrarily grouped, censored and truncated data.Journal of the Royal Statistical Society38:290–295.
Turner GF, Pitcher TJ. 1986.Attack abatement: a model for group protection by combined avoidance and dilution.The American Naturalist128:228–240DOI 10.1086/284556. Vollset KW, Bailey KM. 2011.Interplay of individual interactions and turbidity affects the
functional response of three-spined sticklebacksGasterosteus aculeatus.Journal of Fish Biology
78:1954–1964DOI 10.1111/j.1095-8649.2011.02963.x.
Ward AJW, Thomas P, Hart PJB, Krause J. 2004. Correlates of boldness in three-spined sticklebacks (Gasterosteus aculeatus).Behavioral Ecology and Sociobiology 55:561–568 DOI 10.1007/s00265-003-0751-8.
Webster DR, Weissburg MJ. 2009.The hydrodynamics of chemical cues among aquatic organisms.
Annual Review of Fluid Mechanics41:73–90DOI 10.1146/annurev.fluid.010908.165240. Webster MM, Laland KN. 2012.Social information, conformity and the opportunity costs paid by
Whitton TA, Jenkins SR, Richardson CA, Hiddink JG. 2012. Aggregated prey and predation rates: juvenile shore crabs (Carcinus maenas) foraging on post-larval cockles
(Cerastoderma edule).Journal of Experimental Marine Biology and Ecology432–433:29–36
DOI 10.1016/j.jembe.2012.07.014.
Wilson ML, Weissburg MJ. 2012.Temporal and spatial sampling strategies maintain tracking success of whelks to prey patches of differing distributions.Animal Behavior84:1323–1330 DOI 10.1016/j.anbehav.2012.08.024.
Wootton RJ. 1976.The biology of the sticklebacks. London: Academic Press.