ACPD
11, 18633–18675, 2011Controls on firn air at WAIS-D
M. O. Battle et al.
Title Page
Abstract Introduction
Conclusions References
Tables Figures
◭ ◮
◭ ◮
Back Close
Full Screen / Esc
Printer-friendly Version Interactive Discussion
Discussion
P
a
per
|
Dis
cussion
P
a
per
|
Discussion
P
a
per
|
Discussio
n
P
a
per
|
Atmos. Chem. Phys. Discuss., 11, 18633–18675, 2011 www.atmos-chem-phys-discuss.net/11/18633/2011/ doi:10.5194/acpd-11-18633-2011
© Author(s) 2011. CC Attribution 3.0 License.
Atmospheric Chemistry and Physics Discussions
This discussion paper is/has been under review for the journal Atmospheric Chemistry and Physics (ACP). Please refer to the corresponding final paper in ACP if available.
Controls on the movement and
composition of firn air at the West
Antarctic Ice Sheet Divide
M. O. Battle1, J. P. Severinghaus2, E. D. Sofen1,*, D. Plotkin1, A. J. Orsi2, M. Aydin3, S. A. Montzka4, T. Sowers5, and P. P. Tans4
1
Department of Physics and Astronomy, Bowdoin College, 8800 College Station, Brunswick ME, 04011, USA
2
Scripps Institution of Oceanography, University of California, San Diego, La Jolla CA 92093-0244, USA
3
Department of Earth System Science, University of California, Irvine, CA 92697-3100, USA 4
National Oceanic and Atmospheric Administration, Earth System Research Laboratory, Global Monitoring Division, Boulder, CO 80305, USA
5
ACPD
11, 18633–18675, 2011Controls on firn air at WAIS-D
M. O. Battle et al.
Title Page
Abstract Introduction
Conclusions References
Tables Figures
◭ ◮
◭ ◮
Back Close
Full Screen / Esc
Printer-friendly Version Interactive Discussion
Discussion
P
a
per
|
Dis
cussion
P
a
per
|
Discussion
P
a
per
|
Discussio
n
P
a
per
|
∗Department of Atmospheric Sciences, University of Washington, Seattle WA 98195, USA
Received: 2 June 2011 – Accepted: 13 June 2011 – Published: 30 June 2011 Correspondence to: M. O. Battle ([email protected])
ACPD
11, 18633–18675, 2011Controls on firn air at WAIS-D
M. O. Battle et al.
Title Page
Abstract Introduction
Conclusions References
Tables Figures
◭ ◮
◭ ◮
Back Close
Full Screen / Esc
Printer-friendly Version Interactive Discussion
Discussion
P
a
per
|
Dis
cussion
P
a
per
|
Discussion
P
a
per
|
Discussio
n
P
a
per
|
Abstract
We sampled interstitial air from the perennial snowpack (firn) at a site near the West Antarctic Ice Sheet Divide (WAIS-D) and analyzed the air samples for a wide variety of gas species and their isotopes. We find only 1–2 m of convective influence in the shal-low firn, gravitational enrichment of heavy species throughout the diffusive column in 5
general agreement with theoretical expectations, a∼10 m thick lock-in zone beginning at∼67 m, and a total firn thickness consistent with predictions of Kaspers et al. (2004). Our modeling work shows that the air has an age spread (spectral width) of 4.8 yr for CO2at the firn-ice transition. We also find that advection of firn air due to the 22 cm yr−
1
ice-equivalent accumulation rate has a minor impact on firn air composition, causing 10
changes that are comparable to other modeling uncertainties and intrinsic sample vari-ability. Furthermore, estimates of ∆age (the gas age/ice age difference) at WAIS-D appear to be largely unaffected by bubble closure above the lock-in zone. Within the lock-in zone, small gas species and their isotopes show evidence of size-dependent fractionation due to permeation through the ice lattice with a size threshold of 0.36 nm, 15
as at other sites. We also see an unequivocal and unprecedented signal of oxygen iso-tope fractionation within the lock-in zone, which we interpret as the mass-dependent expression of a size-dependent fractionation process.
1 Introduction
Air extracted from the perennial snowpack (firn) is scientifically interesting for two rea-20
sons: it provides insight into the processes that determine the composition of air, both in the firn, and in the bubbles trapped in the underlying ice, and it provides a record of atmospheric composition in the recent past.
In December of 2005, we traveled to the US West Antarctic Ice Sheet Divide (WAIS-D) reasearch station, where a deep ice coring program was commencing. Working 25
ACPD
11, 18633–18675, 2011Controls on firn air at WAIS-D
M. O. Battle et al.
Title Page
Abstract Introduction
Conclusions References
Tables Figures
◭ ◮
◭ ◮
Back Close
Full Screen / Esc
Printer-friendly Version Interactive Discussion
Discussion
P
a
per
|
Dis
cussion
P
a
per
|
Discussion
P
a
per
|
Discussio
n
P
a
per
|
surface down to the firn-ice transition. The samples were returned to various labora-tories in the United States and analyzed for a range of different species. The primary goal of this work was to quantify the nature of firn air movement at the site, thereby aiding interpretations of trapped gases extracted from the deep core. In addition, the measurements provide atmospheric histories of intermediate length and resolution for 5
a wide range of species, allowing comparisons with existing records from other sites and emissions models.
The utility of the firn as an archive of past atmospheres was first realized by Schwan-der et al. (1993). Many subsequent studies have used firn air to establish or confirm recent atmospheric histories of O2, CO2, CH4and N2O , some of their isotopes, and 10
numerous halocarbons and other trace species (e.g., Bender et al., 1994; Battle et al., 1996; Trudinger et al., 1997; Butler et al., 1999; Braunlich et al., 2001; Sturges et al., 2001; Montzka et al., 2004). The firn-based histories vary in length and resolution, de-pending on the local climate and the resulting glaciological properties of the firn from which the air was extracted (Kaspers et al., 2004). With occasional exceptions (Sev-15
eringhaus et al., 2010), sites with low temperatures and high accumulation rates gen-erally have the longest records. At each level in the firn, the air is a mixture of air of different ages, due to the gas diffusion process. Thus, the longest records also tend to have the widest age spreads (Trudinger et al., 1997), thereby limiting the time resolu-tion with which past atmospheric histories may be reconstructed.
20
In the manuscript that follows, we focus on the use of gas measurements to illumi-nate the physical processes controlling the composition of air in the firn and in bubbles in the underlying ice. We begin with an overview of air movement in the firn and then describe the sampling site, collection methods, and modeling approach. We then use measurements of multiple atmospheric species and their isotopes to quantify the pres-25
ACPD
11, 18633–18675, 2011Controls on firn air at WAIS-D
M. O. Battle et al.
Title Page
Abstract Introduction
Conclusions References
Tables Figures
◭ ◮
◭ ◮
Back Close
Full Screen / Esc
Printer-friendly Version Interactive Discussion
Discussion
P
a
per
|
Dis
cussion
P
a
per
|
Discussion
P
a
per
|
Discussio
n
P
a
per
|
2 Air movement in firn
Air movement in the firn is driven by many processes on a variety of spatial and tem-poral scales. Concentration gradients within the firn drive gas fluxes via molecular diffusion (Craig et al., 1988). These concentration gradients can arise from changes in the composition of the overlying atmosphere, gravitational settling of heavy species, 5
thermally driven migration of heavy species to cold strata within the firn (Severinghaus et al., 2001), and close-off related fluxes of relatively mobile species (Severinghaus and Battle, 2006).
Changes in barometric pressure and windflow over surface contours can also lead to bulk convective transport in the shallow firn (Colbeck, 1989; Sowers et al., 1992). 10
Significant temperature gradients have the potential to cause convective instability and vertical overturning (Powers et al., 1985; Severinghaus et al., 2010), while the steady accumulation of snow results in downward motion of the firn and its air bubbles, induc-ing a downward motion of the air (Rommelaere et al., 1997). Finally, as air pockets are compressed and firn crystals sinter into ice, permeation may occur as gases escape 15
through the crystal lattice in the newly forming ice bubbles (Severinghaus and Battle, 2006).
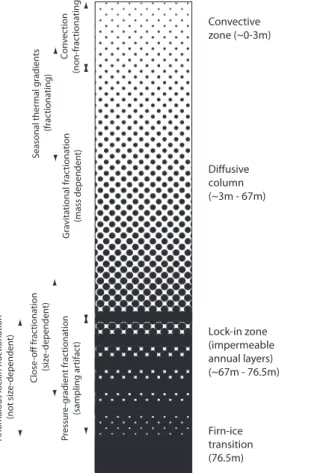
While advection and convection move all species through the firn indiscriminately, diffusion and permeation have the potential to fractionate gas mixtures. Different processes dominate in different parts of the firn (Sowers et al., 1992). As indicated 20
schematically in Fig. 1, convection is confined to the uppermost region in the firn. Be-low this is an extensive zone where diffusion dominates. In the lower firn, many sites (including WAIS-D) exhibit a lock-in zone, where vertical air movement is largely im-peded by low-permeability seasonal layers, yet air samples can still be extracted from the remaining open pores in the intervening layers laid down in the complementary 25
ACPD
11, 18633–18675, 2011Controls on firn air at WAIS-D
M. O. Battle et al.
Title Page
Abstract Introduction
Conclusions References
Tables Figures
◭ ◮
◭ ◮
Back Close
Full Screen / Esc
Printer-friendly Version Interactive Discussion
Discussion
P
a
per
|
Dis
cussion
P
a
per
|
Discussion
P
a
per
|
Discussio
n
P
a
per
|
3 Site characteristics and significance
We collected air samples from two holes (WDC05-B and WDC05-C), each 10.8 cm in diameter, separated by roughly 20m, drilled at 79◦27.78′S 112◦07.39′W, at an altitude of 1766 m (Conway and Rasmussen, 2009). This site was 2 km upwind of the main camp and deep core location, in a previously-undisturbed region. Mean annual tem-5
perature at the site, measured in the borehole, is−31◦C with an accumulation rate of 22 cm yr−1ice-equivalent (Banta et al., 2008).
These characterisitics make the site an intermediate one in many respects. It is neither very cold, nor is it warm enough to have melting episodes. The accumulation rate is comparable to Summit Greenland (∼25 cm yr−1
), higher than South Pole and 10
Vostok (<10 cm yr−1), but significantly lower than Law Dome (65 cm yr−1 at DSS and 1.19 myr−1at DE08) (Etheridge et al., 1996).
4 Sample collection and analysis
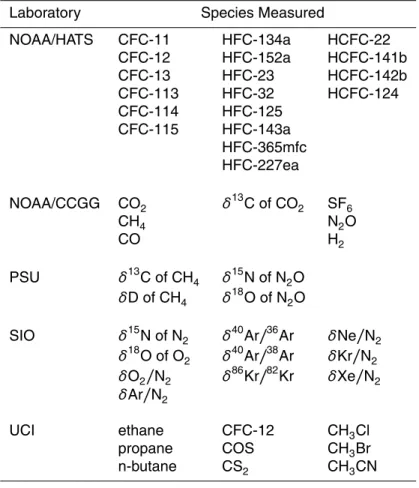
Drilling and air-sampling occurred between 21 and 29 December 2005, generally fol-lowing standard protocols described by Butler et al. (1999). At every sampling depth 15
we collected pairs of PTFE-sealed glass flasks for analysis by the Carbon Cycle Green-house Gas group of NOAA and the Scripps Institution of Oceanography, pairs of PTFE-sealed glass flasks for Penn. State University, single pressurized PTFE-PTFE-sealed glass flasks and single pressurized all-stainless steel flasks for the NOAA HATS group, and paired PTFE-sealed glass flasks for the University of California, Irvine group. A full list 20
of the species analyzed and the responsible institutions are given in Table 1. All sam-ples were collected through DekoronTM tubing using a Metal Bellows MB-158 pump (Senior Aerospace, Sharon MA), with a KNF-NO5 pump with Viton valves and di-aphragm (KNF Neuberger, Trenton NJ) added in series for the UC Irvine and NOAA HATS flasks. As described by Severinghaus et al. (2010), we used a system in 25
ACPD
11, 18633–18675, 2011Controls on firn air at WAIS-D
M. O. Battle et al.
Title Page
Abstract Introduction
Conclusions References
Tables Figures
◭ ◮
◭ ◮
Back Close
Full Screen / Esc
Printer-friendly Version Interactive Discussion
Discussion
P
a
per
|
Dis
cussion
P
a
per
|
Discussion
P
a
per
|
Discussio
n
P
a
per
|
couplings and joints from the intake at the bottom of the borehole to the low-pressure side of our sampling pump.
Samples were collected at complementary depths in the two holes, yielding a dataset with collections every 5 m in the diffusive column and roughly every 1 m in the lock-in zone. In addition, we collected two sets of surface samples (through the firn sampling 5
equipment) and another set from each hole at a common depth (nominally 70 m). As in nearly all (Buizert et al., 2011) previous campaigns, compositions of the samples from the two holes agreed within uncertainties.
5 Modeling of firn-air movement and composition
To interpret our measurements of firn air, we employ a 1-dimensional model built 10
around a finite-difference approximation of Fick’s 2nd law. We have three versions of the model. All versions operate with a 4.8 h time step and include molecular diffusion and (if desired) gravitational fractionation. The first, described previously by Battle et al. (1996), uses a fixed coordinate system and divides the firn column into 1 m thick boxes. The second follows the approach of Trudinger et al. (1997), and uses a moving coordi-15
nate system with boxes of equal mass, ranging in thickness from 1.03 m at the surface to 0.53 m at the firn-ice transition. The moving-coordinate version allows for convec-tion in the shallow firn using an exponentially damped eddy diffusivity term (Kawamura et al., 2006) and implicitly accounts for downward advection of firn air due to the an-nual accumulation of snow at the surface. The third version of the model, similar to 20
that used by Severinghaus et al. (2010), incorporates thermal fractionation and heat transport. This one includes the same formulation of convection as the second model, and also includes downward advection, but as an explicit process, set within a fixed coordinate system in the open firn. Within the lock-in zone, advection is treated by shifting concentrations down a temporally-uniform grid to minimize numerical diffusion 25
ACPD
11, 18633–18675, 2011Controls on firn air at WAIS-D
M. O. Battle et al.
Title Page
Abstract Introduction
Conclusions References
Tables Figures
◭ ◮
◭ ◮
Back Close
Full Screen / Esc
Printer-friendly Version Interactive Discussion
Discussion
P
a
per
|
Dis
cussion
P
a
per
|
Discussion
P
a
per
|
Discussio
n
P
a
per
|
6 Large-scale regimes in the firn
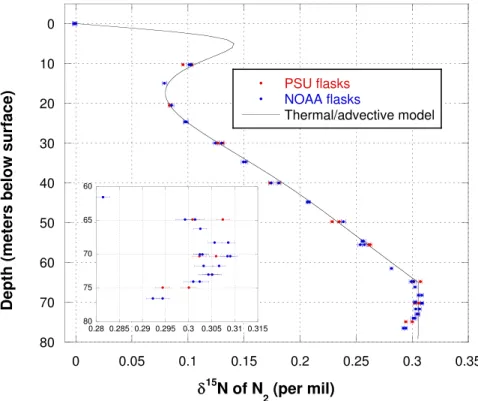
Species with temporally and spatially constant atmospheric mixing ratios can be pow-erful tools for investigating air movement in the firn, if they can be measured with suffi -cient precision. We begin by usingδ15N of N2, shown in Fig. 2, to identify the various regimes depicted schematically in Fig. 1. While exact depth ranges for each regime 5
are difficult to determine, approximate values (justified in Sects. 6.1 through 8) are in-dicated in Fig. 1. These data show many of the qualitative and quantitative features we expect.
6.1 The convective zone
The thickness of the convective zone at the top of the firn column can be challenging 10
to identify. One approach is to extrapolate a linear fit to the data clearly in the diff u-sive zone and below the range of thermal influence (see Sects. 6.2 and 8) back to the depth at which δ15N =0. Using only NOAA flasks between 34 and 56 m depth, this method indicates a convective zone of 5.2±1.6 m. A second approach, known as the barometric slope method (Bender et al., 1994; Severinghaus et al., 2010), fixes 15
the slope of the line at the theoretical prediction (4.88 per megm−1) and adjusts the intercept until the line and the deeper observations optimally agree (Bender et al., 1994). Again using only the NOAA flasks between 34 and 56 m, this method yields a convective zone 3.1±0.4 m deep (assuming no uncertainty in the theoretically based slope). A third approach involves adjusting an eddy diffusivity term in the model un-20
til it optimally matches the observations in the diffusive column. The convective zone thickness is then defined by the depth at which eddy diffusivity equals molecular diff u-sivity (Kawamura et al., 2006). Using the second (i.e. moving coordinate) version of the model with the formulation of eddy diffusivity of Kawamura et al., we find a convective zone thickness of 1.4 m. A fourth approach (Severinghaus et al., 2010) again adjusts 25
ACPD
11, 18633–18675, 2011Controls on firn air at WAIS-D
M. O. Battle et al.
Title Page
Abstract Introduction
Conclusions References
Tables Figures
◭ ◮
◭ ◮
Back Close
Full Screen / Esc
Printer-friendly Version Interactive Discussion
Discussion
P
a
per
|
Dis
cussion
P
a
per
|
Discussion
P
a
per
|
Discussio
n
P
a
per
|
differently. Specifically, the thickness of the convective zone is determined from the difference between the depths of a discrete set of modelδ15N values located clearly within the diffusive zone, modeled with and without convection. This fourth approach yields 2.1 m as the convective zone thickness.
This range of results probably reflects the fact that each is defining the thickness of 5
the convective zone in slightly different ways and only the last method includes thermal fractionation. Regardless of the method chosen, it seems clear that the convective zone is shallow, and bulk air motion originating at the surface has little influence on the composition of air deeper in the firn.
6.2 The diffusive zone 10
Considering only the NOAA CCG flasks, samples collected at 5 unique depths between 34 and 56 m exhibit a progressive enrichment in the heavy isotope, increasing linearly at 5.2±0.2 per meg m−1, (1σ errors) where 1per meg=0.001 =0.0001 %. Including the samples collected at 30 m and/or those between 56 and 65 m does not siginificantly change this result. Similary, including the PSU flasks has no significant impact on the 15
measured enrichment, despite the fact that much of the gas in these flasks was re-moved for other analyses prior to sampling forδ15N. The slope ofδ18OO
2 data over this
same depth interval is about twice as large: 10.2±0.4 per meg m−1. This is consistent
with theδ15N enrichment on a per-mass-unit basis. These values are not completely consistent with the theoretical prediction of 4.88 per meg/mass unit/m for pure gravi-20
ACPD
11, 18633–18675, 2011Controls on firn air at WAIS-D
M. O. Battle et al.
Title Page
Abstract Introduction
Conclusions References
Tables Figures
◭ ◮
◭ ◮
Back Close
Full Screen / Esc
Printer-friendly Version Interactive Discussion
Discussion
P
a
per
|
Dis
cussion
P
a
per
|
Discussion
P
a
per
|
Discussio
n
P
a
per
|
6.3 The lock-in zone
As shown in the inset of Fig. 2, δ15N increases slightly between 66.84 and 68.26 m, but at far less than the rate expected from gravitational enrichment. Below 68.26 m,
δ15N is either constant or decreasing. The lack of fully realized gravitational enrichment indicates the bottom of the diffusive column and beginning of the lock-in zone (also 5
known as the “sealing depth” (Etheridge et al., 1996)). The exact onset of the lock-in is difficult to pinpoint without more precise and abundantδ15N measurements.
6.4 Firn-ice transition
The lock-in zone extends down to 76.54 m (the “total close-offdepth”), where the firn-ice transition precludes collection of any more samples. This depth is consistent with 10
the modeling work of Kaspers et al. (2004). Using the densification model of Herron and Langway (1980), Kaspers et al. predicted a total close-offdepth of ∼75 m for a site with the temperature and accumulation rate of WAIS-D. The agreement provides a valuable check of the Kaspers et al. model for a previously untested combination of temperature and accumulation rate.
15
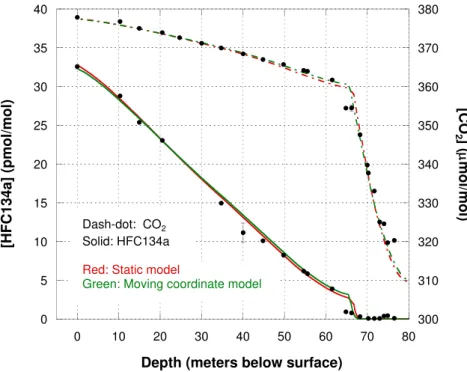
7 Advection due to accumulation
In addition to gravitation and convection, firn air has the potential to be advected down-ward. Trudinger et al. (1997) showed this is an important effect at high accumulation sites, while Battle et al. (1996) found it negligible at a low-accumulation site. We can in-vestigate the importance of this phenomenon at the intermediate-accumulation WAIS-20
D site by comparing model runs with and without implicit advection. Comparisons of paired model runs for two species with very different atmospheric histories (CO2and HFC-134a) are shown in Fig. 3. Also shown are measured values of these species.
ACPD
11, 18633–18675, 2011Controls on firn air at WAIS-D
M. O. Battle et al.
Title Page
Abstract Introduction
Conclusions References
Tables Figures
◭ ◮
◭ ◮
Back Close
Full Screen / Esc
Printer-friendly Version Interactive Discussion
Discussion
P
a
per
|
Dis
cussion
P
a
per
|
Discussion
P
a
per
|
Discussio
n
P
a
per
|
uncertainty in our mixing ratio measurements at any given depth. On the other hand, at some depths, single-depth measurement precision and advection are both small compared to other influences and uncertainties. For example, around the top of the lock-in zone, the exact location and sharpness of the diffusive/lock-in transition (64– 68 m at this site) clearly have a greater impact on the data-model agreement than the 5
presence or absence of advection. Similarly, in the lower part of the diffusive column (45–65 m here), the data-model differences are comparable to the model-model diff er-ences. These data-model discrepancies may be due to problems with our tuning of the diffusivity-depth profile (common to both models), or perhaps with the atmospheric forcing history we are using. The same comment applies for CO2in the lock-in zone, 10
were additional “roughness” in the CO2-depth profile points to real variability in the firn air that is large compared to advective effects.
Uncertainties associated with the tuning of the diffusivity-depth profile can be re-duced by more sophisticated multi-species techniques (Buizert et al., 2011), but real variability in the firn air extracted from the lock-in zone is a more difficult problem. 15
In short, this exercise shows that the importance of advection at an intermediate-accumulation site like WAIS-D is likely smaller than, or comparable to, other apects of our models which are poorly constrained. Furthermore, as models of firn processes improve, as more precise datasets are assembled, or when working at sites with higher accumulation rates, advection should be taken into account.
20
8 Evidence for thermal influences
As discussed above, temperature gradients in the firn lead to gradients in firn air com-position due to thermal fractionation. This phenomenon is most apparent in the shallow firn, where large temperature gradients exist due to the downward propagation of the seasonal surface temperature cycle. These gradients cause very clear signals in iso-25
ACPD
11, 18633–18675, 2011Controls on firn air at WAIS-D
M. O. Battle et al.
Title Page
Abstract Introduction
Conclusions References
Tables Figures
◭ ◮
◭ ◮
Back Close
Full Screen / Esc
Printer-friendly Version Interactive Discussion
Discussion
P
a
per
|
Dis
cussion
P
a
per
|
Discussion
P
a
per
|
Discussio
n
P
a
per
|
limited, we see the same phenomena here, with our noble gas data showing responses to thermal gradients that are qualitatively similar to other sites. A quantitative analysis of thermal signals in the WAIS-D firn air will be presented elsewhere (Orsi et al., 2011).
9 Close-offfractionation
9.1 Movement through the lattice and size-dependent fractionation 5
As discussed by Severinghaus and Battle (2006) and Huber et al. (2006), some species of gases appear to escape from recently-closed bubbles into the open pores immedi-ately adjacent. It is hypothesized that this permeation leakage occurs through the ice lattice itself (Ikeda-Fukazawa et al., 2005). A molecular diameter of 0.36 nm appears to be a threshold value, with larger species contained (or all escaping at roughly the same 10
slow rate), and smaller species escaping at rates that dependend on their molecular size.
The high mobility of O2, relative to N2, as predicted by Ikeda-Fukazawa et al. (2004), is corroborated by the observed decline over time of O2/N2in ice core samples stored in freezers at −25◦C and by the observed increase in O2/N2in the lock-in zones of 15
virtually all firn air study sites (Severinghaus and Battle, 2006).
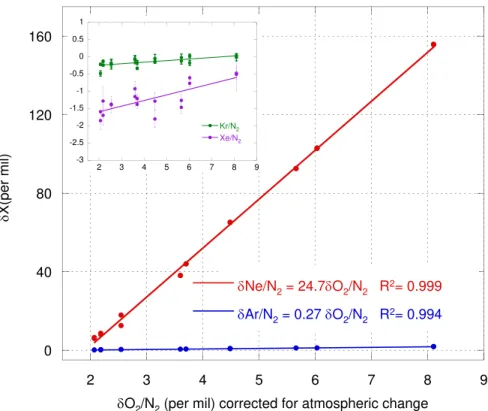
At WAIS-D, as at other sites, this size-dependent effect is evident in the substan-tial enrichment of O2/N2and Ne/N2above and within the lock-in zone, as well as the non-enrichment of Xe/N2and Kr/N2. We follow Severinghaus and Battle (2006) and plot various species versus O2/N2within the lock-in zone in Fig. 4. As in this 20
earlier work, we make O2/N2behave as if it were temporally constant at the sur-face of the firn by subtracting a modeled component of O2/N2variation with depth (an O2/N2“correction”). This correction was generated by forcing the model with an atmospheric history of O2/N2derived from direct measurements at the South Pole since 1992 (Manning and Keeling, 2006), and in earlier times, fossil fuel combustion 25
ACPD
11, 18633–18675, 2011Controls on firn air at WAIS-D
M. O. Battle et al.
Title Page
Abstract Introduction
Conclusions References
Tables Figures
◭ ◮
◭ ◮
Back Close
Full Screen / Esc
Printer-friendly Version Interactive Discussion
Discussion
P
a
per
|
Dis
cussion
P
a
per
|
Discussion
P
a
per
|
Discussio
n
P
a
per
|
Joos, 1997). While the uncertainty in this correction is hard to fully quantify, model output from differing scenarios gives some sense of the magnitude of the potential er-ror.δO2/N2values in the deep firn for model runs assuming a balanced biosphere are
∼19 per meg higher than those using our best estimate of biospheric behavior. Even
if this extreme range of input assumptions really does indicate the uncertainty in our 5
correction, it is small compared to the total correction applied (roughly 1 ) and smaller still compared to the range ofδO2/N2observed and modeled within the lock-in zone.
As at other sites (Severinghaus and Battle, 2006; Huber et al., 2006), Kr/N2and Xe/N2show essentially no covariation with O2/N2. Slopes for these species are 0.04±0.03 and 0.16±0.07/ respectively (Fig. 4 inset). We note that the exact val-10
ues we measure for these slopes depend upon the details of the correction for gravita-tional and pressure-gradient fractionation we apply to the raw data (see Sect. 10 and Severinghaus and Battle, 2006). This dependence is particularly acute for Kr/N2and Xe/N2, on account of their large mass differences.
In contrast, Ar/N2shows a small but unequivocal covariation (0.27±0.01), while 15
Ne/N2shows a strong signal (24.7±0.4). Interestingly, these slopes in the WAIS-D lock-in zone differ from the slopes measured at South Pole (0.15±0.07 and 34.0±1.5 for Ar/N2and Ne/N2, respectively)(Severinghaus and Battle, 2006). All uncertainties given here for slopes vs. O2/N2are 95 % confidence intervals.
Why should Ar/N2and Ne/N2have different slopes at WAIS-D and the South pole? 20
The explanation may lie in the temperature-dependence of the mechanisms by which Ne and O2move through the lattice. Ikeda-Fukazawa et al. (2002, 2004) suggested that the movement of Ne in ice occurs by way of “hops” between interstitial sites. In contrast, O2moves primarily (though not exclusively) through a mechanism in which hydrogen bonds in the lattice are broken as the mobile impurity (in this case O2) 25
migrates (Ikeda-Fukazawa et al., 2004). Ar, being closer to the 0.36 nm thresh-old than O2, is still more dependent on bond-breaking. Both the interstitial hopping (Ne) and the breaking-bond (O2and Ar) mechanisms imply a diffusivity of the form
ACPD
11, 18633–18675, 2011Controls on firn air at WAIS-D
M. O. Battle et al.
Title Page
Abstract Introduction
Conclusions References
Tables Figures
◭ ◮
◭ ◮
Back Close
Full Screen / Esc
Printer-friendly Version Interactive Discussion
Discussion
P
a
per
|
Dis
cussion
P
a
per
|
Discussion
P
a
per
|
Discussio
n
P
a
per
|
constant, andT is the temperature. However, O2and Ar are expected to have a larger activitation energyQthan Ne, due to the strong temperature dependence of the break-ing of hydrogen bonds. Thus, the warmer temperature at WAIS-D relative to South Pole (−31 vs.−51◦C) probably explains the lower observed slope of Ne/N2vs. O2/N2and the slightly higher slope of Ar/N2vs. O2/N2. This is also consistent with with the rela-5
tively large slope of Ar/N2vs. O2/N2at Siple Dome: Slope=0.33±0.02, temperature =−25◦C (Severinghaus and Battle, 2006).
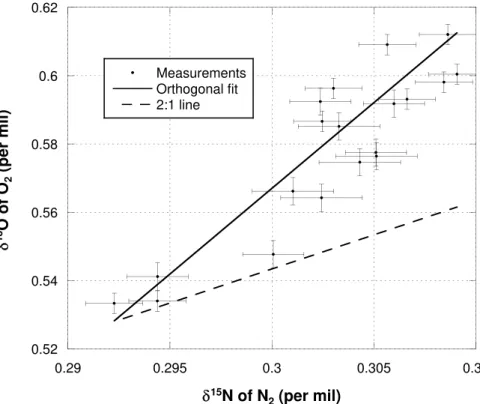
9.2 Anomalous fractionation in the lock-in zone:δ18OO 2
The mobility of Ne, O2, Ar, Xe and Kr (relative to N2) can be understood in terms of a size-dependent mechanism. However, at WAIS-D, we also observe very clear 10
evidence of isotopic fractionation in the firn-air record ofδ18OO
2. In particular, there is a
pronounced depletion of18O16O with depth in the lock-in zone (Figure 5). As discussed in Sect. 10,δ15N is believed to vary in the lock-in zone solely due to pressure-gradient fractionation at the time of collection. The possible departure from linearity in Fig. 5 may indicate some fractionation mechanism that does not have a simple mass dependence. 15
We can rule out several explanations for the observed change in lock-inδ18OO2. For the time scale spanned by gases in the lock-in zone (roughly 20 yr)δ18OO2 is essen-tially constant in the atmosphere. Even at times of extremely rapid change in atmo-sphericδ18OO2, such as the end of the previous glacial period,δ
18
OO2 changed by at most 2×10⁻⁴ yr−1 (Severinghaus et al., 2009); a rate that could account for at most 20
5 % of the change that we actually see in our firn air samples. Also, a tank archive of air pumped by C. D. Keeling on the Scripps pier in 1976 showned no difference from 2006 air within an error of 0.003 (Severinghaus et al., 2009). Our confidence in this 1976–2006 agreement is bolstered by the apparent absence of leakage and chemi-cal reaction in the tank. Furthermore, becauseδ18OO
2 is an isotopic ratio, it should 25
ACPD
11, 18633–18675, 2011Controls on firn air at WAIS-D
M. O. Battle et al.
Title Page
Abstract Introduction
Conclusions References
Tables Figures
◭ ◮
◭ ◮
Back Close
Full Screen / Esc
Printer-friendly Version Interactive Discussion
Discussion
P
a
per
|
Dis
cussion
P
a
per
|
Discussion
P
a
per
|
Discussio
n
P
a
per
|
expectδ18OO2 to show twice as much change asδ 15
N , with a linear dependence (i.e. a straight line with slope 2.0 instead of the observed slope of 5.0±0.3). Clearly, there must be some other mechanism at work.
One possible explanation is that isotopic fractionation occurs during the permeation of O2through the ice lattice. The large molecules N2, Kr and Xe appear to be un-5
fractionated by permeation despite large mass differences (Severinghaus and Battle, 2006). However, as discussed above, O2is smaller and therefore may move through the ice lattice by both bond-breaking (emphasized in Sect. 9.1 above) and the inter-stitial hop mechanism. The modeled 3-fold greater permeation rate of O2relative to N2reflects this contribution from hopping (Ikeda-Fukazawa et al., 2004; Severinghaus 10
and Battle, 2006). The hops should be velocity-dependent, so a fractionation related to √mass might be expected, and with it, a trend in δ18OO
2: the mass-dependent
expression of a size-dependent process.
Here, we explore this possibility by calculating the relative permeation coefficients implied by the observed trends ofδ18OO
2 and O2/N2in the lock-in zone. Unfortunately, 15
it is not straightforward to infer these physical parameters from the raw data because N2is also permeating at the same time as O2, effectively adding to the denominator as well as the numerator of the O2/N2ratio. We account for this with the following assumptions:
1. The permeation rates of16O16O and14N14N are as given by Ikeda-Fukazawaet 20
al.(2005);
2. No fractionation of15N14N relative to14N14N occurs (other than the gravitational, thermal and sampling effects discussed in sections 6, 8 and 10);
3. The observed increase in O2/N2occurs via differential permeation from over-pressured bubbles to the open firn pores within the lock-in zone as described by 25
ACPD
11, 18633–18675, 2011Controls on firn air at WAIS-D
M. O. Battle et al.
Title Page
Abstract Introduction
Conclusions References
Tables Figures
◭ ◮
◭ ◮
Back Close
Full Screen / Esc
Printer-friendly Version Interactive Discussion
Discussion
P
a
per
|
Dis
cussion
P
a
per
|
Discussion
P
a
per
|
Discussio
n
P
a
per
|
4. The lock-in zone is at steady state so that the vertical trends may be taken as a surrogate for the temporal trends in the evolution of a given sample of air from open pores;
5. The composition of the bubbles does not evolve significantly during the course of the evolution of the gas in the open pores, so that the bubbles may be treated as 5
having a constant composition.
Using these assumptions, our measurements imply the ratio of permeabilities of 18
O16O and16O16O is 0.9942±0.0005, corresponding to a fractionation factor of−5.8± 0.5 (see Appendix B). This is much less than expected for a simple velocity-dependent process, for which we would expect a fractionation of√mass=
q
32/34=−30 .
10
We conclude that the processes occurring in the lock-in zone are more complex than a simple velocity-dependent transport. Our result also reinforces the view that effusion cannot be the dominant process in close-off fractionation because effusion also predicts a√mass dependence (Ikeda-Fukazawa et al., 2005).
To our knowledge this is the first reported instance of natural isotopic fractionation 15
by the bubble close-offprocess. This observation was made possible in part by sig-nificant advances in analytic precision (see Appendix A). If corroborated, it has impli-cations for isotopic reconstructions of atmospheric gases from both firn air and bubble air in ice cores. Some prior studies have already attempted to make empirical correc-tions to measuredδ18OO
2 of O2in ice core records using co-measuredδO2/N2and 20
Ar/N2(Severinghaus et al., 2009). While most of this fractionation is an artifact that occurred due to gas loss during core retrieval and handling (e.g. Bender et al., 1995), some small component of this fractionation may have been due to natural close-off fractionation.
Given that oxygen isotopes are fractionated as the (indirect) result of size-dependent 25
ACPD
11, 18633–18675, 2011Controls on firn air at WAIS-D
M. O. Battle et al.
Title Page
Abstract Introduction
Conclusions References
Tables Figures
◭ ◮
◭ ◮
Back Close
Full Screen / Esc
Printer-friendly Version Interactive Discussion
Discussion
P
a
per
|
Dis
cussion
P
a
per
|
Discussion
P
a
per
|
Discussio
n
P
a
per
|
Ar/N2is modestly enriched in the firn air (Fig. 4), suggesting that Ar is indeed ex-pelled preferentially during bubble close-offlike O2/N2, but more weakly. The fact that the atomic diameter of Ar is less than the threshold value of 0.36 nm, but more than that of O2, is consistent with the observed Ar/N2and O2/N2data. Nonetheless, there is no clear sign of isotopic fractionation in Ar: compare Fig. 7 and Fig. 6.
5
It is conceivable that the physics of the O2isotopic fractionation are not operative for the isotopes of a monatomic noble gas; in other words, mass-dependence might only exist for diatomic molecules that have the zero-point energy changes associated with covalent bonds. This speculation should be explored further. We also note that whileδ40Ar/36Ar is known to be fractionated by artifactual gas loss from ice core sam-10
ples (Severinghaus et al., 2003), it is not necessarily the case that artifactual loss involves the same physical processes as natural close-offfractionation.
An obvious next step to test our hypothesis of isotopic close-offfractionation would be to measure neon isotopes in firn air, as Ne/N2is known to be heavily impacted by close-offfractionation (Fig. 4 and Severinghaus and Battle, 2006). In addition, Ne has 15
no significant atmospheric change, simplifying the interpretation. Because the small atoms neon and helium are thought to permeate through the ice lattice by the intersti-tial hopping mechanism, we expect that there will be substanintersti-tial isotopic fractionation. We likewise anticipate that hydrogen isotopes of H2 will be affected by the close-off fractionation, requiring a correction to atmospheric reconstructions, because the colli-20
sion diameter of H2is similar to that of neon (Reid et al., 1987).
10 Collection fractionation at depth
In contrast to O2just discussed, there is no evidence that istopes of N2are fraction-ated during bubble close-off(Severinghaus and Battle, 2006). This is consistent with the hypothesis of Ikeda-Fukazawa et al. (2005) that hydrogen-bond breaking limits the 25
ACPD
11, 18633–18675, 2011Controls on firn air at WAIS-D
M. O. Battle et al.
Title Page
Abstract Introduction
Conclusions References
Tables Figures
◭ ◮
◭ ◮
Back Close
Full Screen / Esc
Printer-friendly Version Interactive Discussion
Discussion
P
a
per
|
Dis
cussion
P
a
per
|
Discussion
P
a
per
|
Discussio
n
P
a
per
|
addition, this hydrogen-bond breaking mechanism is insensitive to the mass of the molecule, implying that Kr and Xe and N2should not be fractionated with respect to each other despite large mass differences. This is consistent with observations at other firn sites (Severinghaus and Battle, 2006). As discussed by Severinghaus et al. (2009), there are also several other lines of evidence that N2is not fractionated during 5
bubble close-off.
Despite the lack of evidence for isotopic fractionation of N2during close-off, there is an unequivocal depth-dependence ofδ15N within the lock-in zone at WAIS-D (Fig. 2), as well as at other sites (Severinghaus and Battle, 2006). Thisδ15N signal has been attributed to the act of extracting air from the open porosity during sampling. When 10
open channels are very restricted (as they are in the lock-in zone) the suction required to extract air may lead to substantial pressure gradients within the firn, accompanied by mass-dependent pressure-gradient fractionation (Chapman and Cowling, 1970). Such a collection artifact was invoked by Severinghaus and Battle (2006) to explain the drops inδ15N,δKr/N2andδXe/N2observed within the lock-in zone at both Siple Dome and 15
South Pole.
While the absolute decrease inδ15N in the WAIS-D dataset is difficult to quantify, if pressure-gradient fractionation is present, we expect noble gases to show heavy iso-tope depletion in the lock-in zone, covarying withδ15N on a 1:1 line when normalized by mass difference. The same should be true of elemental ratios (Severinghaus and 20
Battle, 2006).
Unfortunately, our measurements are too few and too imprecise to make a definitive statement about the presence (or absence) of pressure-gradient fractionation at WAIS-D. In particular, slopes fitted to our data are unduly influenced by the values measured at the single deepest collection point.
25
ACPD
11, 18633–18675, 2011Controls on firn air at WAIS-D
M. O. Battle et al.
Title Page
Abstract Introduction
Conclusions References
Tables Figures
◭ ◮
◭ ◮
Back Close
Full Screen / Esc
Printer-friendly Version Interactive Discussion
Discussion
P
a
per
|
Dis
cussion
P
a
per
|
Discussion
P
a
per
|
Discussio
n
P
a
per
|
it is weakly or strongly realized, pressure-gradient fractionation should manifest itself as a 1:1 covariation in species-vs-δ15N plots.
11 Age distributions of firn air
In addition to the species presented here, the WAIS-D firn air samples were analyzed for a wide range of hydrocarbons, halocarbons and other geochemically significant 5
species. Some records have already been published (methane isotopes (Mischler et al., 2009), HFC-23 (Montzka et al., 2010) and CFC-12 (Aydin et al., 2010)), while publication is forthcoming for others such as methane (Mitchellet al.2011) and ethane (Aydinet al.2011). Common to these analyses, and important for linking firn air records to underlying ice-core records, are the age distributions of the firn air at various depths. 10
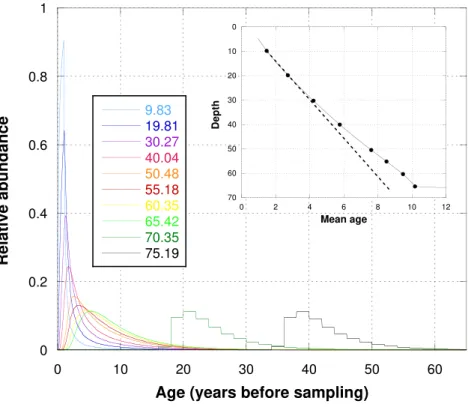
As discussed in detail by Schwander et al. (1993) and Trudinger et al. (2002), the com-position of the air extracted from the firn at any given depth reflects the convolution of the atmospheric history with diffusive mixing subject to the depth-dependent diff usiv-ity of the firn column itelf. This statement is true only to the extent that fractionating processes discussed above are either negligibly small, or have been corrected for. 15
Assuming this is the case, we can follow earlier authors (Schwander et al., 1993; Rommelaere et al., 1997; Trudinger et al., 2003) and use one-year, normalized pulse-response functions in our 1-dimensional moving-coordinate firn model (described above) to characterize the age of the firn air as a function of depth. Since each type of molecule diffuses at a different speed, distributions are species-specific. Results of 20
this exercise for CO2are shown in Fig. 8 and are consistent with other sites with similar glaciology (e.g., Trudinger et al., 2003). Air from shallow depths is young with a sharp peak, reflecting the brief time over which diffusion has been acting. As depth increases, the air becomes older, with a broader age spread. Once within the lock-in zone, the modeled air ages at the rate that would be expected from the accumulation rate. In 25
ACPD
11, 18633–18675, 2011Controls on firn air at WAIS-D
M. O. Battle et al.
Title Page
Abstract Introduction
Conclusions References
Tables Figures
◭ ◮
◭ ◮
Back Close
Full Screen / Esc
Printer-friendly Version Interactive Discussion
Discussion
P
a
per
|
Dis
cussion
P
a
per
|
Discussion
P
a
per
|
Discussio
n
P
a
per
|
model curves within the lock-in zone in Fig. 8 has no physical significance and simply reflects the discretization chosen for the model treatment of the lock-in.
Quantifying the age of the air is challenging since various metrics may be chosen to characterize these non-Gaussian age distributions (Trudinger et al., 2002). For com-parison with other sites, we calculate the 2nd moment, or “spectral width”∆of the age 5
distribution at close-off, defined by the equation
∆2(z)=1 2
Z∞
0
(t−Γ(z))2G(z,t)d t
wherez is depth,Γis the mean of the distribution, and G is the age distribution (Hall and Plumb, 1994; Hall and Waugh, 1997; Andrews et al., 1999).
Using this metric for CO2, we find∆ =4.8 yr (withΓ =45.5 yr at 75.2 m; close to the 10
bottom of the lock-in zone) at WAIS-D. This compares to∆ =5 and∆ =17 yr for Law Dome (DSSW20K) and South Pole, respectively (Trudinger et al., 2002). Given the similarities in glaciology of DSSW20K and WAIS-D, similar spectral widths are to be expected.
12 Age of air in ice bubbles 15
Thus far, we have focussed on the composition of air extracted from open pores in the firn. Of equal or greater interest is the composition of air trapped in closed pores, since this bubble air is the basis for so much of our current understanding of paleocli-mate. One quantity of importance is the difference in age between bubble air and the surrounding ice (∆age).
20
ACPD
11, 18633–18675, 2011Controls on firn air at WAIS-D
M. O. Battle et al.
Title Page
Abstract Introduction
Conclusions References
Tables Figures
◭ ◮
◭ ◮
Back Close
Full Screen / Esc
Printer-friendly Version Interactive Discussion
Discussion
P
a
per
|
Dis
cussion
P
a
per
|
Discussion
P
a
per
|
Discussio
n
P
a
per
|
column, the age of bubble air derived using these assumptions will be biased young. In addition, the temporal resolution of the record from bubble air will be reduced.
We can attempt to understand the amount of bubble formation within the diffusive column by exploiting the steady gravitational enrichment of15N14N in this part of the firn. In particular, if substantial bubble formation is occurring within the diffusive column, 5
bubble air from below the firn-ice transition should have a somewhat lowerδ15N than the firn air at the top of the lock-in zone (deeper in the lock-in zone, δ15N may be reduced by the pressure-gradient fractionation associated with collection and described above).
The 2 firn air samples from 68.26 m depth have δ15N=0.3086 and 0.3057 (or 10
0.307±0.002). The 126 bubble-air measurements made between 129 and 255 m yield
δ15N=0.3083±0.0006 (1 standard error) on the same analytic scale. The agreement seems to imply, at most, a modest amount of bubble closure above the lock-in zone.
To make this more quantitative, we consider the parameterizations of bubble closure presented by Schwander (1989, Eq. 3) and Severinghaus and Battle (2006, eq. A9). 15
These relations, along with densities measured on the WAIS-D firn cores in the field, are used as input for a closed-pore model that we include in the firn diffusion model described above.
This bubble trapping in each box of the model begins with the assumption that air in the open pores is at atmospheric pressure. For the purposes of this analysis, we 20
also assume that no fractionation occurs during trapping. As each box moves down-wards, some of the open porosity closes (the amount is an input to the model), with these new bubbles containing air of the same composition as the immediate (still open) surroundings. Consequently, the mixing ratio ofallclosed bubbles at a given depth will be the weighted average of the new bubble air mixing ratio and the preexisting bubble 25
air mixing ratio (where the weights are the respective molar abundances of the newly-and previously-trapped air).
ACPD
11, 18633–18675, 2011Controls on firn air at WAIS-D
M. O. Battle et al.
Title Page
Abstract Introduction
Conclusions References
Tables Figures
◭ ◮
◭ ◮
Back Close
Full Screen / Esc
Printer-friendly Version Interactive Discussion
Discussion
P
a
per
|
Dis
cussion
P
a
per
|
Discussion
P
a
per
|
Discussio
n
P
a
per
|
inputs to the model, we find a maximum difference inδ15N between open and closed pores of 0.9 and 0.5 per meg, respectively; too small to detect, given the scatter in our firn air (open-pore) measurements.
As a simple sensitivity study, we can calculate how much closed porosity would have to form above the lock-in zone in order to give a measureable difference between firn air 5
and bubble air inδ15N. We start with a parameterization of bubble formation and then simply scale the amount of porosity that closes above the lock-in zone by a multiplica-tive factor. We then adjust this factor until the model predicts a significant difference betweenδ15N of air in open and closed pores. We define a significant difference as non-zero at the 99 % confidence level, or about 5.4 per meg, where this value comes 10
from the uncertainties in our measurements of both the bubble air and firn air. We find that unless at least 40 % of the pores close above the lock-in zone, the difference between the firn and bubble airδ15N values will be essentially undetectable.
Naturally, this result depends strongly on the location of bubble formation above the lock-in zone. Both the Severinghaus and Schwander parameterizations place the ma-15
jority of pore closure quite close to the lock-in zone. If instead, the closure is occurring farther up the column, a smaller fraction of the total pores closing will yield a discern-able signal inδ15N.
Despite these caveats, the calculations above make two things clear. First,
δ15N provides a rather weak constraint on the amount of bubble formation occurring 20
above the lock-in zone. In other words, only if a substantial amount of pore closure is occurring above the lock-in zone, will we be able to see signs of it inδ15N.
Secondly, assuming that all bubble formation occurs in the lock-in zone probably does not lead to a significant error in ∆age. This is because the age of the firn air increases with depth in a non-linear fashion in the diffusive column (see Fig. 8, inset). 25
ACPD
11, 18633–18675, 2011Controls on firn air at WAIS-D
M. O. Battle et al.
Title Page
Abstract Introduction
Conclusions References
Tables Figures
◭ ◮
◭ ◮
Back Close
Full Screen / Esc
Printer-friendly Version Interactive Discussion
Discussion
P
a
per
|
Dis
cussion
P
a
per
|
Discussion
P
a
per
|
Discussio
n
P
a
per
|
formation. Taken together, these factors mean that a value of∆age determined simply from the difference between the age of the firn air from the lock-in zone and the age of the surrounding ice is likely to be essentially unbiased. This will be true even in the presence of bubble formation well above the depths predicted by Schwander and Severinghaus.
5
13 Conclusions
In many ways, the firn air sampling and analysis presented here is a confirmation of firn air work conducted at other sites. We have used established sampling methods and models that are similar to those already developed, at a site that has neither un-usually high, nor unun-usually low accumulation rates and temperatures. The absence 10
of significant convective influence, the thermal signal in the shallow firn, the expected gravitational enrichment in the diffusive column, the depth of the firn-ice transition, the presence and extent of a lock-in zone and the limited impact of accumulation-driven advection are all consistent with results at other sites. Taken together, these speak to the robustness of our understanding of processes operating in the firn, and the integrity 15
of the dataset presented here. In addition, usingδ15N data from firn air as well as ice bubbles, along with a simple model of bubble formation, we find that estimates of∆age (the gas age/ice age difference) are unlikely to be biased by the formation of bubbles above the lock-in zone.
Within the lock-in zone, we also find signs of processes that have been observed 20
elsewhere. In particular, molecules that are smaller than 0.36 nm in diameter (such as Ne, O2and Ar) are enriched in the open pore space, with greater enrichment corre-sponding to smaller size. Like past authors, we attribute this phenomenon to perme-ation through the ice lattice. Quantitatively, the enrichments we see differ from those observed at South Pole, probably due to the relatively warmer temperatures at our 25
ACPD
11, 18633–18675, 2011Controls on firn air at WAIS-D
M. O. Battle et al.
Title Page
Abstract Introduction
Conclusions References
Tables Figures
◭ ◮
◭ ◮
Back Close
Full Screen / Esc
Printer-friendly Version Interactive Discussion
Discussion
P
a
per
|
Dis
cussion
P
a
per
|
Discussion
P
a
per
|
Discussio
n
P
a
per
|
One unprecedented signal in our dataset is the clear variation of δ18OO2 within the lock-in zone. This cannot be explained purely in terms of direct size-dependent per-meation, but is at least conceptually consistent with a velocity-dependence (and by extension, mass-dependence) in the interstitial hopping that seems to be occurring during the size-dependent permeation of O2through the ice lattice. If this explanation 5
is correct, we might expect to see similar variation in the lock-in zone of Ne and Ar isotopes. Unfortunately, we do not yet have Ne isotopic analyses for these samples (in which we would expect a very large signal), and our Ar isotopic data are equivocally inconsistent with the simplest hypothesized mechanism. We look forward to future datasets that will shed light on the processes that give rise to the clearδ18OO2 signal 10
we see here.
Appendix A
Correction for mass spectrometer “Chemical Slope”
It has long been recognized that the mass spectrometric measurement of an isotopic 15
ratio in a mixed gas such as air can be subject to an artifactual sensitivity of the mea-surement to the major gas abundance ratios (Sowers et al., 1989; Severinghaus et al., 2003). The cause of the artifact is not well understood but probably involves ion-molecule reactions in the mass spectrometer source, which lead to small differences in the ionization efficiencies of the isotopologues. Forδ18O of O2measurements, the 20
N2abundance in the sample is the controlling variable for this effect.
A correction for this effect is routinely applied to isotopic measurements made in mixed gases, known as the “chemical slope” correction. The basis for the correction is that the mass spectrometer can be demonstrated to respond in a stable and linear fash-ion to variatfash-ions in the major gas ratio that are induced experimentally by progressive 25
ACPD
11, 18633–18675, 2011Controls on firn air at WAIS-D
M. O. Battle et al.
Title Page
Abstract Introduction
Conclusions References
Tables Figures
◭ ◮
◭ ◮
Back Close
Full Screen / Esc
Printer-friendly Version Interactive Discussion
Discussion
P
a
per
|
Dis
cussion
P
a
per
|
Discussion
P
a
per
|
Discussio
n
P
a
per
|
artifactual, and the slope of the observed variation is recorded and used to make the correction to the subsequent set of unknown samples.
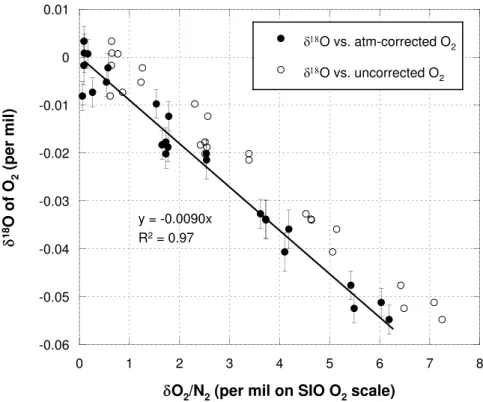
This correction is crucial to the problem of detecting isotopic fractionation of O2in the lock-in zone, because large changes in O2/N2are associated with the small isotopic signal that is sought. Prior observations of δ18OO
2 of O2trends in lock-in zones at 5
various firn air study sites (e.g. South Pole, Siple Dome) were discounted because of the very large chemical slope correction and its associated uncertainty.
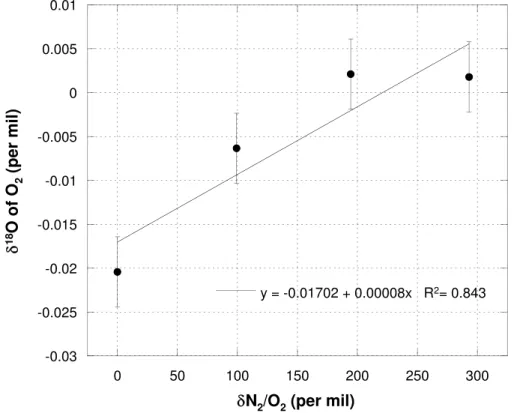
For the present study, we made a special effort to tune the Scripps mass spec-trometer to minimize its chemical slope. This was accomplished by varying source parameters such as the ion extraction voltage. As a consequence the uncertainty in 10
the chemical slope correction is small relative to the signal observed, and therefore we have confidence in the result. The measured slope is 8×10⁻⁵ for each increase in the amount of N2added (Fig. 9). This results in a maximum chemical slope correction of 6×10⁻⁴ This is much smaller than our analytical precision of 0.004 .
Appendix B 15
Calculation of the physical fractionation factor
We start by gravitationally correcting the measuredδ18O of O2(thermal fractionation is ignored) using the canonical formulaδ18OO2 gravcorr=δ
18
OO2 measured−2δ 15
Nmeasured (Sowers et al., 1989). If there is any sampling artifact, this correction will suffice to 20
remove it (Severinghaus and Battle, 2006). Note that sufficiency of this correction depends on the validity of assumption 2 in Sect. 9.2.
As described in the main text, δ18OO2 gravcorr decreases with increasing
δO2/N2(Fig. 7). A geometric-mean regression gives an empirical slope m of
−0.0090±0.0007 per (95 % confidence interval). From the definition of δ, and
con-25
ACPD
11, 18633–18675, 2011Controls on firn air at WAIS-D
M. O. Battle et al.
Title Page Abstract Introduction Conclusions References Tables Figures ◭ ◮ ◭ ◮ Back Close
Full Screen / Esc
Printer-friendly Version Interactive Discussion Discussion P a per | Dis cussion P a per | Discussion P a per | Discussio n P a per |
inventory18Oo, this slope may be expressed as:
m= ∆δ 18
OO
2
∆δO2/N2=
d18O+18Oo d16O+16Oo
R18 STD −1 − 18Oo 16Oo R18 STD −1
d16O+16Oo dN2+N2o
RSTDO2/N2 −1
!
−
16Oo N2o
RSTDO2/N2−1
!≃
d18O+18Oo d16O+16Oo
R18 STD
−1
d16O+16Oo dN2+N2o
RSTDO2/N2 −1
! =−0.0090/ (B1)
Here,RSTDis the ratio in the respective standard used to report the delta value, in our case the free atmosphere in La Jolla. Because the initial gas composition in the pores is very close to atmospheric, the approximation used in the second-from-right 5
term is appropriate.
Following Severinghaus and Battle (2006), the amount of permeating gas that is added can be written in terms of the permeabilityP, the mole fraction in the bubblex, the bubble overpressureδp, the total area of wallAavailable for permeation, and the effective mean wall thickness zL through which permeation occurs. The permeation 10
is assumed to occur for a small increment of timed t. As ∆p, A, zL and d t are the same for all gases, they may be lumped together in the parameter γ. γ has units of Pa m2m−1s, essentially representing the time-integrated driving force for permeation. We then have
d18O=P18x18∆p
A zL
d t=P18x18γ (B2) 15
d16O=P16x16∆p
A zL
d t=P16x16γ (B3)
dN2=PNxN∆p
A zL
d t=PNxNγ (B4)
Values of P16 and PN are from the Ikeda-Fukazawa et al. (2005) molecular
simula-tions, at a temperature of−31◦C (the WAIS-D mean annual temperature):
ACPD
11, 18633–18675, 2011Controls on firn air at WAIS-D
M. O. Battle et al.
Title Page
Abstract Introduction
Conclusions References
Tables Figures
◭ ◮
◭ ◮
Back Close
Full Screen / Esc
Printer-friendly Version Interactive Discussion
Discussion
P
a
per
|
Dis
cussion
P
a
per
|
Discussion
P
a
per
|
Discussio
n
P
a
per
|
PN =3.90×10⁻²¹ mol m−1s−1Pa−1
Removal of gas from the open pore spaces occurs continuously within the lock-in zone via closure of additional bubbles and compaction with expulsion of air to higher layers in the firn. We ignore this effect in this calculation, because the gas removed 5
will have a composition very similar to that in the open pores. Thus, the removal has virtually no effect on the relative abundances of the gas species (although it certainly has an effect on the absolute inventory). This follows because gas-phase diffusion in the interconnected open pores is rapid and will homogenize the open pore inventory, quickly eliminating any compositional differences within a given isolated but internally-10
connected layer.
The number of moles of air molecules in the open pores can be represented byC. The ratio γ/C is then a rough measure of how much the air in the open pores has evolved due to permeation. For example, to explain an O2/N2enrichment of 7 in the lock-in zone would require a value ofγ/C=1018Pa m−1m2s mol−1.
15
The initial number moles of each gas is the initial mole fraction timesC: 18
Oo=x18C (B5)
16
Oo=x16C (B6)
N2
o =xNC (B7)
The physical fractionation factor that we seek is the ratio of permeabilitiesP18/P16. 20
Substituting Eqs. (2–7) into 1 and rearranging, and taking advantage of the fact that
RSTDequals the ratio of the mole fractions in both the bubbles and in the initial open pore air (e.g.x18/x16), we get:
P18
P16 =
P
16γ+C
PNγ+C
m
1−PN
P16
+1=[δO2/N2+1]m
1−PN
P16
ACPD
11, 18633–18675, 2011Controls on firn air at WAIS-D
M. O. Battle et al.
Title Page
Abstract Introduction
Conclusions References
Tables Figures
◭ ◮
◭ ◮
Back Close
Full Screen / Esc
Printer-friendly Version Interactive Discussion
Discussion
P
a
per
|
Dis
cussion
P
a
per
|
Discussion
P
a
per
|
Discussio
n
P
a
per
|
where we have rewritten the left-most term in square brackets as [δO2/N2+1]. This term has a value of 1.007 for an O2/N2enrichment of 7, so it may be neglected with an error much smaller than our slope fit error. This fact also indicates that our use of a linear fit, rather than a curve, is an acceptable approximation. This leaves the final equation for the permeation fractionation factorαp:
5
αp≡P18 P16≃
m
1−PN
P16
+1 (B9)
From Ikeda-Fukazawaet al. (2005) we have PN/P16=0.356, giving the fractionation factorαpas 0.9942±0.0005, or a 5.8±0.5 fractionation. These uncertainties do not
include possible errors in the permeation coefficients. We have no information on the error on these, but as an example, a 10 % error inPN(with no error inP16) would trans-10
late into an error inαpof 0.0003. Fortunately, because we employ ratios of permeation
coefficients, systematic error in both values will tend to cancel.
Acknowledgements. We thank Lou Albershardt, Beth Bergeron, Terry Gacke, Jay Kyne and Mike Waszkiewics for their careful drilling of the holes. Markus Leuenberger graciously pro-vided accommodations and helpful conversations while writing. The authors acknowledge NSF
15
Antarctic Program support from the following grants: Aydin – 0440602, Battle – 0440509, Sev-eringhaus – 0440701, Sowers – 0739491 and 0440759. Montzka thanks the Atmospheric Composition and Climate Program of NOAA’s Climate Program Office.
References
Andrews, A., Boering, K., Daube, B., Wofsy, S., Hintsa, E., Weinstock, E., and Bui, T.: Empirical
20
age spectra for the lower tropical stratosphere from in situ observations for CO2: Implications for stratospheric transport, J. Geophys. Res., 104, 26581–26595, 1999. 18652
Aydin, M., Montzka, S. A., Battle, M. O., Williams, M. B., De Bruyn, W. J., Butler, J. H., Verhulst, K. R., Tatum, C., Gun, B. K., Plotkin, D. A., Hall, B. D., and Saltzman, E. S.: Post-coring entrapment of modern air in some shallow ice cores collected near the firn-ice transition: