Article
Are individual based models a suitable approach to estimate population
vulnerability? - a case study
Eva Maria Griebeler
Department of Ecology, Zoological Institute, University of Mainz, P.O. Box 3980, D-55099 Mainz, Germany E-mail: [email protected]
Received 27 January 2011; Accepted 24 February 2011;Published online 1 April 2011 IAEES
Abstract
European populations of the Large Blue Butterfly Maculinea arion have experienced severe declines in the last decades, especially in the northern part of the species’ range. This endangered lycaenid butterfly needs two
resources for development: flower buds of specific plants (Thymus spp., Origanum vulgare), on which young caterpillars briefly feed, and red ants of the genus Myrmica, whose nests support caterpillars during a prolonged final instar. I present an analytically solvable deterministic model to estimate the vulnerability of
populations of M.arion. Results obtained from the sensitivity analysis of this mathematical model (MM) are contrasted to the respective results that had been derived from a spatially explicit individual based model (IBM)
for this butterfly. I demonstrate that details in landscape configuration which are neglected by the MM but are easily taken into consideration by the IBM result in a different degree of intraspecific competition of caterpillars on flower buds and within host ant nests. The resulting differences in mortalities of caterpillars
lead to erroneous estimates of the extinction risk of a butterfly population living in habitat with low food plant coverage and low abundance in host ant nests. This observation favors the use of an individual based modeling
approach over the deterministic approach at least for the management of this threatened butterfly.
Keywords individual based model; mathematical model; environmental heterogeneity; competition; Maculinea arion.
1 Introduction
The last decades have seen an enormous interest in problems related to conservation biology as many species
on earth are threatened due to ongoing loss, fragmentation and degradation of habitat (e. g. Shaffer, 1981; Soulé, 1987; Hanski and Gilpin, 1997). To find reliable estimates for the vulnerability of a population
associated with the various future scenarios it may face, quantitative models are needed. This is especially important for sound decision making in conservation management.
The estimation of the risk of population extinction has been approached by different modeling techniques,
e.g. by analytically solvable models or Monte-Carlo simulations where the latter are either based on a simple stochastic population model or an individual based model (IBM). Simple deterministic models have gained wide acceptance in conservation biology although they often do not explicitly include mechanistic processes.
Deterministic models are relatively simple to produce and easy to interpret and they provide analytical rather than simulation results. For conservation biology, it has been demonstrated that the sensitivity analysis of
survival and thus, may be used to focus research and management efforts (Hochberg et al., 1994; Heppell et al., 2000).
In contrast, individual based models (IBMs) are typically tedious to create. They include many parameters which are difficult to estimate for natural populations and which rely on very detailed knowledge on the species and the spatial structure of its populations. IBMs use information at the level of individual organisms.
They derive characteristics of the population as an integral of all individuals constituting the population. In contrast to the deterministic models IBMs are mechanistic in approach and they have also been successfully
applied in conservation biology (e.g. Matsinos et al., 2000; Griebeler and Seitz, 2002; DeAngelis and Mooij, 2005; Griebeler and Gottschalk, 2010). Furthermore, in IBMs details on the spatial configuration of the landscape are easy to implement. It has been demonstrated that landscape heterogeneity strongly influences the
dynamics of a population and consequently its extinction risk (Matsinos et al., 2000; Gottschalk et al., 2003; Griebeler and Gottschalk, 2010).
In this article, I compare two modeling techniques that are applied in conservation biology, the deterministic approach and the individual based approach. I test whether the assumed high predictive power of both modeling approaches is true. In particular, I present a simple analytically solvable mathematical model (MM)
for the Large Blue Butterfly Maculinea arion. I contrast results obtained from the sensitivity analysis of the MM to the respective results derived from a spatially explicit IBM for this butterfly (Griebeler and Seitz,
2002).
2 Material and Methods
2.1 Biology of the Maculinea-Thymus-Myrmica system
As all Maculinea butterflies, M. arion is univoltine. Adults usually fly for about 4 weeks in July or August. Each female butterfly lays a clutch of one egg on flower buds of specific plants about 60 times per generation. Thymus plants are preferred for oviposition and Origanum is frequently used in the absence of thyme. A high
proportion of eggs hatch about one week after being laid (Thomas et al., 1991). Young caterpillars feed on buds for about three weeks, although they are cannibalistic during their first instars (Thomas, 1977).
Occasionally, within this time, caterpillars are parasitized by Trichogramma species (Thomas et al., 1991). Caterpillars acquire only about 1% of their ultimate biomass during their life on plants (Thomas, 1977). They
then molt for the third and last time, drop to the ground where they await discovery by Myrmica workers, or die within the next 2 days if they are beyond the foraging range of an ant colony (Thomas, 1977; Thomas et al., 1989). Curiously, adult Maculinea cannot detect Myrmica, and place their eggs more or less randomly on
plants growing both beyond and within the foraging range of these ants (Thomas et al., 1989). Even though workers from most species of Myrmica take the caterpillar back to their nests with equal success, caterpillars
almost exclusively survive within nests of M. sabuleti (Elmes et al., 1998). Within the nests, caterpillars mimic an ant larva in its final instar. They are obligate predators of Myrmica larvae. It is estimated that 230 of the largest available larvae, and a minimum nest size of 354 M. sabuleti workers, is needed to support a single
butterfly. Therefore, many caterpillars die in ant nests if nests are too small (Thomas and Wardlaw, 1992). Mortality of caterpillars is 2.8 times higher in nests with queen ants in comparison to queen less nests (Thomas
and Wardlaw, 1990). After the caterpillars have exploited ant nests for about 10 months, butterflies finally emerge from pupae.
Based on its life-cycle, the key to conserving M. arion is to manage sites to encourage high densities of the
2.2 Mathematical model
In order to assess the power of simple mathematical models for conservation, I developed an analytically solvable deterministic model for M. arion. This model is based on the model of Hochberg et al. (1994) which was established for another large blue butterfly, Maculinea rebeli. The life-cycle of this species is very similar
to the life-cycle of M. arion. Both species quickly develop on their food plants and gain the major part of their ultimate biomass in host ant nests. While M. arion is an obligate predator of Myrmica larvae, caterpillars of M. rebeli mimic ant larvae and thus induce M. schenki workers to feed them directly with regurgitations,
trophic eggs and prey (Elmes et al., 1991). Following the model of Hochberg et al. (1994), I divided the life cycle of M. arion into two parts: (1) adult reproduction, survival of eggs and of caterpillars on flower buds of
thyme (g1), and (2) subsequent recruitment and survival of caterpillars in ant nests (g2). Consequently, the size
of the adult butterfly population at generation t+1 (Nt+1) is given by the equation:
Nt+1 = g1(Nt,T)g2(g1(Nt,T),A) (1)
where Nt is the population size at generation t, T is the constant population density of thyme and A is the
constant population density of host ant nests.
The first life step, modeled by function g1(Nt,T) starts with oviposition. Each female butterfly lays in total
60 eggs per generation (Thomas, 1989; Thomas et al., 1991). Having an equal sex ratio the model treats each
adult butterfly as laying O (=30) eggs per generation. An amount of 90 percent of eggs hatch ()egg hatching,
Thomas et al., 1991) and 5.3 percent of the hatched caterpillars die from parasitism by Trichogramma species
(1-)Trichogramma, Thomas et al., 1991). Non-parasitized caterpillars continue to develop within the flower buds,
with one caterpillar surviving per bud. This competition on flower buds that results from cannibalism of
caterpillars is modeled in accordance with Hochberg et al. (1994) by the general intraspecific competition model of Hassell (1975):
T T t t
x
N
T
N
g
)
1
)
,
(
1
O
(2)
where )T = )egg hatching(1-)Trichogramma) is the proportion of caterpillars surviving from density-independent
causes of mortality (hatching rate of eggs, parasitism of caterpillars by Trichogramma) and
T N x
T T t T
H
O) is
the average number of competing caterpillars per flower bud. Parameter HT equals 7%which is the number of flower buds per square meter in field and T gives the total size of the study area that is covered by thyme. T
equals (STC/100) where TC is the percentage of ground covered by Thymus plants (Braun-Blanquet, 1951) and
S is the size of the habitat.
The second life step (g2(g1(Nt,T),A)) starts with adoption of caterpillars in host ant nests and depends on the
composition of the Myrmica fauna in the field. A constant proportion of caterpillars are adopted by other
non-host Myrmica ants ()other Myrmica). All caterpillars adopted by wrong Myrmica ants die within their nests. The
proportion of caterpillars recruited in correct host ant nests (U(A)) is modeled by assuming that host ant nests are randomly distributed with respect to Thymus plants:
U(A)=1–e-KA (3)
To model competition in host ant nests, I applied the general function of Hassell (1975) following Hochberg et al. (1994). This leads to:
A A t
x
A
A
T
N
g
g
)
1
)
(
)
),
,
(
(
12
U
(4)
where)A = 1-()other Myrmica/100) and
A T N g A x
A t A A
H
U( )) 1( , )is the average number of caterpillars competing
per host ant nest. Values of )A and )other Myrmica depend on the composition of the Myrmica fauna of the
studied area. )other Myrmica isthe proportion of non-host ant nests in the area and thus)A is the frequency of
adoption of caterpillars by correct host ants. Parameter HA (= 0.3, Thomas and Wardlaw, 1992) is the number
of caterpillars that are expected to develop to butterflies per host ant nest.
2.3 Extinction risk of the butterfly
As suggested by Hochberg et al. (1994) I used the intrinsic growth rate R0 and the equilibrium level of adult
butterflies N* to assess the extinction risk of a population. R0 is the average number of offspring that survives
to adulthood per parent in the absence of intraspecific competition. It measures the capacity of a species to increase in size after a severe decline in size or a colonization of a new habitat. R0 depends on habitat
conditions. Qualitatively, Hochberg et al. (1994) call populations for which 1<<R0 ‘safe’ from extinction,
those with R0|1 as ‘in danger’ of extinction and those with R0<<1 as ‘doomed’ to extinction.
For the MM, R0 is easily found by evaluating Nt+1/Nt at the limit Nto0:
R0=O)TU(A))A (5)
The equilibrium level of butterflies N* is found by setting N*=Nt+1=Nt and solving equation (1) for N*:
A A T
A
A A
T
T
A
N
H U H
O
U
) )
)
) ( 1
1
)
(
*
(6)2.4 Model sensitivity
To compare the MM and the IBM, I repeated the analyses given in Griebeler and Seitz (2002) for the MM. In these new analyses I again assumed an area size of 1 ha. I calculated R0 and N* for various model parameter
values applying equations (5) and (6).
In the first study, I aimed to assess the errors in the estimated extinction risk of a population which are introduced by errors in model parameter values. Therefore, I systematically varied the value assumed for each
of the model parameters O, )egg hatching, )Trichogramma, K and HA while holding the other parameters constant
(Table 1). In this study I set habitat characteristics to A=1300, )other Myrmica=50%, TC=30% and TB=150
(Griebeler and Seitz, 2002). For each combination of model parameter values I computed R0 and N*.
In the second study, I investigated the influence of habitat characteristics on the extinction risk of a butterfly population based on R0 and N*. As in Griebeler and Seitz (2002) habitat characteristics studied were Thymus
cover TC, the abundance of host ants A and the proportion of caterpillars that are adopted by other non-host
Myrmica ant species )other Myrmica. Two analyses were performed for an area of a size of 1 ha. First, Thymus
coverTC and the number of host ant nests A were both simultaneously systematically altered, assuming that a
constant proportion of 50% of caterpillars are adopted by other Myrmica ()other Myrmica). Second, the number of
analogously simultaneously changed, assuming a constant Thymus cover TC of 30%. In both analyses, TBwas
always set to 150 flower buds per m2 and the remaining model parameters were chosen as given in Table 1.
Table 1 Model parameters and their values
Parameter Meaning Value
S Area size [ha] Site dependent
A Density of host ant nests per ha Site dependent
TC Thymus-cover [%] Site dependent
TB = HT Number of flower buds per m
2
Site dependent
)other Myrmica Proportion of adoption of caterpillars by
incorrect host ants [%]
Site dependent
O Number of eggs laid per adult 30 = 60/2 (Thomas, 1989)
)egg hatching Egg survival 0.9 (Thomas et al., 1991)
)Trichogramma Survival from parasitism by Trichogramma 0.947 (=1-0.053,
Thomas et al. 1991)
K Mean potential area of search of workers from an ant nest [ha]
0.0009 (Thomas 1990, Griebeler and Seitz, 2002)
HA Average number of caterpillars competing per
host ant nest, nest capacity
0.3 (Thomas and Wardlaw, 1992)
3 Results
For none of model parameters O,)egg hatching,)Trichogramma,K and HA, I found a parameter value that resulted in
R0 values below one which would indicate that the respective population is ‘in danger’ or ‘doomed’ to
extinction (Fig. 1). With respect to R0 and N* the mean potential search area of workers from a nest K (Fig. 1)
was most sensitive to errors. Increasing K values (Fig. 1) exponentially increased R0 (R0=O)TU(A,K))A=
cU(A,K), with c=O)T)A=const; in formulas hereafter sub indices are added to analogous constants c if more
than one constant is needed) and hyperbolically increased N* (
4 3
2 1
)
,
(
)
,
(
*
c
A
c
c
c
A
N
K
U
K
U
). In contrast, increasing
the number of eggs laid per adult (O, Fig. 1) linearly increased R0 (R0=O)TU(A,K))A=cO) and hyperbolically
increased N* (
3 1 1 2
*
c
c
N
Oc ). For parameters )egg hatching and )Trichogramma (Fig. 1), R0 linearly increased withincreasing values ()egg hatching: R0=O)TU(A))A=O)egg hatching)TrichogrammaU(A))A=c)egg hatching; )Trichogramma:
R0=O)TU(A))A=O)egg hatching)TrichogrammaU(A))A=c)Trichogramma), whereas N* hyperbolically increased
()egg hatching:
3 1 1 2
*
c
c
N
c)egghatching; )Trichogramma:
3 1 1 2
*
c
c
N
c)Trichogramma. While R0 was independent of the
average number of caterpillars competing per host ant nest HA (see equation (5)), N* hyperbolically increased
(
A
c
c
c
N
H 3
2 1
*
350 400 450 500
10 20 30 40 50 2 6 10 14
N* R0
O a) 350 400 450 500
10 20 30 40 50 2 6 10 14
N* R0
O
350 400 450 500
10 20 30 40 50 2 6 10 14
N* R0
O a) 465 470 475 480
0.8 0.85 0.9 0.95 1 7 7.75 8.5 9.25
N* R0
ITrichogramma 485 10 b) 465 470 475 480
0.8 0.85 0.9 0.95 1 7 7.75 8.5 9.25
N* R0
ITrichogramma 485 10 465 470 475 480
0.8 0.85 0.9 0.95 1 7 7.75 8.5 9.25
N* R0
ITrichogramma 485 10 b) 460 467.5 475 482.5
0.7 0.8 0.9 1 6 7 8 9
N* R0
)egg hatching
490 10 c) 460 467.5 475 482.5
0.7 0.8 0.9 1 6 7 8 9
N* R0
)egg hatching
490 10
460 467.5 475 482.5
0.7 0.8 0.9 1 6 7 8 9
N* R0
)egg hatching
490 10 c) 0 200 400 600
0.2 0.4 0.6 0.8
8.6 8.7 8.8 8.9
N* R0
HA 800 9 1000 1200 9.1 9.2 1 d) 0 200 400 600
0.2 0.4 0.6 0.8
8.6 8.7 8.8 8.9
N* R0
HA 800 9 1000 1200 9.1 9.2 1 d) 200 300
0 0.002 0.004 0.006
2 6 10
N* R0
K 400 14 500 0.008 e) 200 300
0 0.002 0.004 0.006
2 6 10
N* R0
K 400 14 500 0.008 e) .
Fig. 1 Sensitivity analysis of model parameters O,)Trichogramma,)egg hatching,HA and K.R0 (open circles) and N* (filled circles) are shown in relation to different values that were assumed for a) number of eggs laid per adult O, b) survival of parasitism by Trichogramma)Trichogramma, c) egg survival )egg hatching, d) average number of caterpillars competing per host ant nest HA, and e) mean potential area of search of workers from an ant nest K.R0 and N* are calculated from equations (5) and (6). Habitat size was 1 ha (S), Thymus cover (TC) was 30%, number flower buds per m2 (TB) was 150, number of host ant nests (A) was 1,300 and non-host adoption of caterpillars ()other Myrmica) was 50%. For values of O,)Trichogramma,)egg hatching,HA and
K see Table 1.
Thymus cover TC and the number of host ant nests A are site dependent and can directly be altered by
conservation measures (Thomas, 1990; Thomas et al., 1998; Fig. 2). R0 did exponentially increase with an
increasing number of host ant nests (R0=O)TU(A))A=cU(A)), but this increase was independent of the
amount of Thymus cover (see equation (5)). A population inhabiting an area with less than 100 ant nests was
predicted to be ‘in danger’ or ‘doomed’ to extinction. While R0 did not depend on Thymus cover, N* did
hyperbolically increase with increasing Thymus cover for a fixed number of host ant nests (
3 1 1 2
*
c
c
N
c T c ). Forconstant Thymus cover, N* did hyperbolically increase with increasing numbers of host ant nests
1600
1200
800
400
0
0 1000 2000 3000 4000 5000
0 20
4060
80100
T
CA
N*
Fig. 2 Sensitivity analysis of model parameters TC and A. Calculated R0 and N* values are shown in relation to Thymus cover TC and density of host ant nests per hectare A. The proportion of caterpillars adopted by incorrect host ants )other Myrmica was 50%. Area size S was one hectare. Site independent parameters were chosen according to Table 1. Note that R0 is independent of TC(see equation (5)).
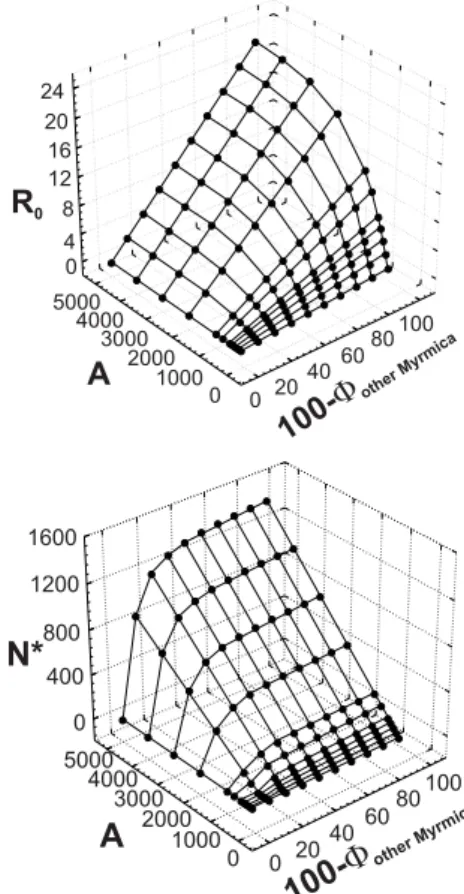
Fig. 3 Sensitivity analyses of model parameters A and )other Myrmica. Calculated R0 and N* values are shown in relation to density of host ant nests per hectare A and proportion of adoption of caterpillars by incorrect host ants )other Myrmica. Thymus cover TC was 30%. Area size S was one hectare. Site independent parameters were chosen according to Table 1.
The relation between the number of host ant nests A and the proportion of adoption of caterpillars by correct
host ants (100-)other Myrmica) and predicted R0 and N* values, respectively is given in Fig. 3. For a fixed number
of host ant nests, R0 did linearly increase (R0= O)TU(A))A=c)A) and N* did hyperbolically increase
(
4 3
2 1
*
c
c
c
c
N
A A
)
)
) with increasing proportions of host ant adoption (100-)other Myrmica). In contrast, R0 did
exponentially increase (R0=O)TU(A))A=cU(A)) and N* did hyperbolically increase (
4 3
2 1
)
(
)
(
*
c
A
c
c
c
A
N
U
U
)
with increasing numbers of host ant nests for a fixed proportion of host ant adoption (100-)other Myrmica). In
particular, there were several situations that assume positive host ant adoption when the population was ‘in
danger’ or ‘doomed’ to extinction: A=100 and (100-)other Myrmica)d40%; A=200 and (100-)other Myrmica)d20%;
In conclusion, for the MM the sensitivity analysis of habitat characteristics suggested that Thymus cover is of very low importance for species survival (minimum 1% cover) but the number of host ant nests and the
proportion of host ant adoption are key factors for the survival of the Large Blue Butterfly M. arion.
4 Discussion
4.1 Comparison of sensitivity analyses
The sensitivity analysis of the MM revealed that the mean potential search area of workers from an ant nest K,
the number of eggs laid per adult butterfly Othe average number of caterpillars competing in a host ant nest HA,
the number of host ant nests A and the proportion of caterpillars adopted by incorrect host ants )other Myrmica are
all important with respect to the vulnerability of M. arion (Fig. 1). Errors in these parameters may result in
wrong estimates of the extinction risk of the population. For example, assuming 0.0001 ha (vs. K = 0.0009 ha, Table 1) for the mean potential search area of workers from an ant nest would have classified a population as ‘in danger’ of extinction (R0=1.1) instead of ‘safe’ from extinction (R0=8.4). Moderate errors in egg survival
)egg hatching and survival from parasitism by Trichogramma)Trichogramma did not influence the classification of a
population’s vulnerability within the range of values studied for each rate. Equation (5) predicts that R0 is
independent of Thymus cover TC and of the average number of caterpillars competing in a host ant nest HA.
Thus, errors in estimates of TC and HA do not affect the classification of a population’s vulnerability in the MM.
There were several consistencies between the predictions of the MM and the IBM (Griebeler and Seitz,
2002), however, also severe differences existed. Both models suggested that parameters O,K,A and
)other Myrmica are of high importance for the vulnerability of the butterfly whereas both parameters )egg hatching
and)Trichogramma are of low importance. In contrast, in the MM Thymus cover TC did not affect survival (R0>1)
whereas the IBM predicted that this is only true when more than 500 host ant nests per hectare exist.
The MM predicted for none of the studied values of parameters O,)egg hatching,)Trichogramma and K values of
R0 which were close to or lower than one and which would indicate that the respective population is ‘in
danger’ or ‘doomed’ to extinction. In contrast, the IBM estimated for O=10 an extinction probability of 100%.
Furthermore, the relation between O and population size (N* and mean population size, respectively) differed between the two models. While the MM predicted a hyperbolic increase in size with increasing Ovalues the
IBM predicted an optimum at O=30. Predicted relations between the population size and each of the parameters )egg hatching and )Trichogramma did also differ between the two models. While the MM predicted a
linear increase in size for increasing survival rates, the IBM predicted a hyperbolic increase. Both models
suggested a hyperbolic relation between K and population size.
In the IBM habitat characteristics TC,A and )other Myrmica were key parameters for the survival of a M. arion
population. However, the MM only corroborated the importance of A and )other Myrmica.R0 that measures the
persistence of a butterfly population was independent of Thymus cover in the MM whereas the IBM suggested
that cover should not fall bellow 5% for low numbers of host ant nests (A750). Both models predicted a hyperbolic relation between population size and Thymus cover, but the predicted increase in size was much
stronger in the IBM than in the MM. Adding extra Thymus when cover was still below 20% tripled the population size in the IBM. In contrast, the MM predicted a saturation level at 10% thyme and the population size increased only about 25%. For the IBM, both an increase in the number of host ant nests and in host ant
adoption resulted in a rapid decrease in the extinction probability. In this model, a population was not endangered if more than 20% caterpillars were adopted by the correct host ant and the nest density of host ants
The MM found a hyperbolic increase, but a linear fit worked also very well (Fig. 2, worst fitting found for TC=1, in this case R=0.998). In contrast, predicted relations between the proportion of host ant adoption and
population size strongly differed between the two models. While the MM predicted a hyperbolic increase in size for increasing proportions of host ant adoption, the IBM revealed a curve with an optimum.
In general, population sizes predicted by the MM were much higher than those predicted by the IBM and
estimated sizes are unrealistic for the species. Thomas (1990) stated that a ‘safe’ population of 400-1,000 adult butterflies could theoretically be supported by one hectare sized ideal habitat (at least 2,500 M. sabuleti nests).
The IBM corroborated his field observations whereas the MM did not. The IBM predicted approximately 400 adults for a habitat of 1 ha size, 30% Thymus cover, 2,500 M. sabuleti nests and at least 20 % host ant adoption whereas the MM estimated about 600 butterflies.
4.2 Implications for population viability
The sensitivity analysis of the MM revealed several results that differed from those obtained for the IBM. I
found several situations where the extinction risk of the population was lower in the MM than in the IBM and where the estimated population sizes (N*) were clearly higher in the MM than in the IBM. While the number
of host ant nests A and the proportion of caterpillars adopted by non-host Myrmica)other Myrmica were detected
as key factors for survival by both models, a third factor Thymus cover, which was discovered by the IBM, was insignificant in the MM. Such potential errors may result in wrong estimates of the viability of a natural
M.arion population, especially in those cases where habitat quality is poor (low abundance of thyme and host ants, high abundance of non-host Myrmica ants) but reliable estimates for the extinction risk are needed. This
potential inaccuracy of the MM may severely limit its application in conservation and favor the use of the IBM, as the latter model revealed more conservative estimates of the extinction risk.
The MM, however, does not explicitly include the mechanistic processes which underlie the interaction
between M. arion,Thymus,Myrmica host ants and non-host Myrmica ants, whereas these are included in the IBM. In the MM I assumed the general interspecific competition model of Hassell (1975) for modeling
competition of caterpillars on plants and in host ant nests. One known limitation of this competition model is that it is unable to explicitly account for possible heterogeneities in intraspecific competition (Hochberg et al., 1994). Such heterogeneities in competition arise on Thymus plants and in host ant nests. Thymus plants grow in
small groups that are more or less randomly distributed in the natural habitat of M. arion. This patchy distribution of flower buds was included in the habitat model of the IBM but was neglected by the MM. In the
IBM, the habitat was modeled as a grid of square cells, with each covering an area of 1 m2. According to the natural degree of Thymus cover a proportion of cells was randomly selected where the host plant was abundant and the number of flower buds was TB in each of the cell with host plants. The MM, however, assumed that
flower buds were randomly distributed within the habitat. If caterpillars are clumped in field due to clumping of Thymus this will result in a higher competition of caterpillars in host ant nests and in overall lower population sizes than predicted by the MM due to the resulting higher mortalities in host ant nests.
Analogously, an increase in the number of eggs per adult (O) will also increase the clumping of caterpillars in host ant nests, due to the clumping of eggs on thyme. The resulting higher mortalities in host ant nests did also
cause the decline in population size observed in the IBM when the number of eggs laid per adult exceeded 30 eggs. These increasing mortalities with an increasing clumping of eggs were not observed in the MM.
Another striking difference between the results of the MM and the IBM is that a maximal population size is
reached at 50% host ant adoption in the IBM which was absent in the MM (Fig. 3). This maximum results from scramble competition of caterpillars in host ant nests (Clarke et al., 1998), causing a decrease in the
adopted individuals is high. With an increasing proportion of adopted caterpillars the mean number of caterpillars adopted per nest will exceed one and thus, the survival probability of each caterpillar will decrease.
These results in an overall smaller output of each nest with increasing numbers of caterpillars adopted, consequently resulting in a decrease in the mean population size for high proportions of host ant adoption. However, this strong competition of caterpillars in nests resulting in exponentially decreasing survival rates
(Thomas and Wardlaw, 1992) was only observed in the IBM. It was absent in the MM which assumed Hassell’s competition function (Hassell, 1975) that caused a hyperbolical decrease in survival rates.
In conclusion based on this study, I cannot fully corroborate the wide acceptance that simple deterministic models are able to reveal important insights on which parameters are likely to be most critical for the survival of a species. My evaluation is mainly based on the observation that mathematical models often neglect
important details in landscape configuration and in the interaction of species with the landscape. In this study such details have resulted in a lower intraspecific competition of caterpillars on host plants and in host ant
nests in the MM than in the IBM. Landscape heterogeneity, however, is easy to model when applying the individual based modeling approach and this advantage may favor the use of this modeling technique over mathematical modeling at least if heterogeneity of the environment could be of high importance for population
dynamics as in the case of M. arion.
References
Braun-Blanquet J. 1951. Pflanzensoziologie, Grundzüge der Vegetationskunde. Springer, Wien
Clarke RT, Thomas JA, Elmes GW, Wardlaw JC, Munguira ML, Hochberg ME. 1998. Population modelling
of the spatial interactions between Maculinea rebeli their initial foodplant Gentiana cruciata and Myrmica ant hosts. Journal of Insect Conservation, 2: 29-37
DeAngelis DL, Mooij WM. 2005. Individual-based modeling of ecological and evolutionary processes. Annual
Reviews in. Ecology, Evolution and Systematics, 36: 147-168
Elmes GW, Thomas JA, Wardlaw JC, Hochberg ME, Clarke RT, Simcox DJ. 1998. The ecology of Myrmica
ants in relation to the conservation of Maculinea butterflies. Journal of Insect Conservation, 2: 67-78
Elmes GW, Wardlaw JC, Thomas JA. 1991. Larvae of Maculinea rebeli, a large-blue butterfly, and their Myrmica host ants: patterns of caterpillar growth and survival. Journal of Zoology, 224: 79-92
Gottschalk E, Griebeler EM, Waltert M, Mühlenberg, M. 2003. Population dynamics of the Grey Bush Cricket Platycleis albopunctata (Orthoptera: Tettigonidae) – what causes interpopulation differences? Journal of
Insect Conservation, 7: 45-58
Griebeler EM, Gottschalk E. 2010. Conservation of the Grey Bush Cricket Platycleis albopunctata (Orthoptera: Tettigonidae) under differing habitat conditions: implications from an individual-based model. In: Relict
Species: Phylogeography and Conservation Biology (Eds. JC Habel and T Assmann). Springer-Verlag, Berlin, Heidelberg, 385-399
Griebeler EM, Seitz A. 2002. An individual based model for the conservation of the endangered Large Blue Butterfly,Maculinea arion (Lepidoptera: Lycaenidae). Ecological Modelling, 156: 43-60
Hanski I, Gilpin M. 1997. Metapopulation Biology: Ecology, Genetics and Evolution. Academic Press, San
Diego
Hassell MP. 1975. Density dependence in single-species populations. Journal of Animal Ecology, 44: 283-295
Hochberg ME, Clarke RT, Elmes GW, Thomas JA. 1994. Population dynamic consequences of direct and indirect interactions involving a large blue butterfly and its plant and red ant hosts. Journal of Animal
Ecology, 63: 375-391
Matsinos YG, Wolff WF, DeAngelis DL. 2000. Can individual-based models yield better assessment of population variability? In: In: Quantitative Methods for Conservation Biology (Eds. S Ferson and M
Burgman). Springer, New York, 188-198
Shaffer ML. 1981. Minimum population sizes for species conservation. Bioscience, 31: 131-134
Soulé ME. 1987. Viable Populations for Conservation. Cambridge University Press, Cambridge
Thomas JA. 1977. Second Report on the Conservation of the Large Blue butterfly. Institute of Terrestrial Ecology, UK
Thomas JA. 1989. Return of the Large Blue butterfly. British Wildlife, 1: 2-13
Thomas JA. 1990. Rare species conservation: case studies of European butterflies. In: The Scientific Management of Temperate Communities for ConservatioQ (Eds. IF Spellerberg, FB Goldsmith and MG
Morris). Blackwell, Oxford, 149-197
Thomas JA, Elmes GW, Wardlaw JC, Woyciechowski M. 1989. Host specificity among Maculinea butterflies
inMyrmica ant nests. Oecologia, 79: 452-457.
Thomas JA, Munguira ML, Martin J, Elmes GW. 1991. Basal hatching by Maculinea butterfly eggs: a consequence of advanced myrmecophily? Biological Journal of the Linnean Society, 44: 175-184
Thomas JA, Simcox DJ, Wardlaw JC, Elmes GW, Hochberg ME, Clarke RT. 1998. Effects of latitude, altitude and climate on the habitat and conservation of the endangered butterfly Maculinea arion and its Myrmica
ant hosts. Journal of Insect Conservation, 2: 39-46
Thomas JA, Wardlaw JC. 1990. The effect of queen ants on the survival of Maculinea arion larvae in Myrmica ant nests. Oecologia, 85: 87-91