*Correspondence: A.L.O. Costa. Departamento de Produtos Farmacêuticos, Faculdade de Farmácia, Universidade Federal de Minas Gerais, 31.270-901 - Belo Horizonte - MG, Brasil. E-mail: [email protected]
A
vol. 49, n. 2, apr./jun., 2013
In vitro
dissolution kinetic for mycophenolic acid derivatives tablets
André Lima de Oliveira Costa
1,*, Paula Cristina Rezende Enéas
1, Tiago Assis Miranda
1,
Sueli Aparecida Mingoti
2, Cristina Duarte Vianna Soares
1, Gerson Antônio Pianetti
11Departament of Pharmaceutical Products, Faculty of Pharmacy, 2Departament of Statistics, Institute of Exact Sciences, Federal University of Minas Gerais
Mycophenolate mofetil (MMF) and mycophenolate sodium (MPS) are an ester and a salt of mycophenolic acid. They have different kinetic in vivo characteristics due to differences in molecular structures, physicochemical properties and formulations administered. In this study, dissolution proiles of reference products were tested in different media to evaluate the effect of pH, kinetic dissolution and the best statistical model that can be used to predict the release of both drugs. The drug release was determined by using a validated ultraviolet spectrophotometry method, λ 250 nm. The method showed to be selective, linear, precise and accurate for MMF in 0.1 M HCl and MPS in sodium phosphate buffer pH 6.8. Dissolution kinetics models of zero order, irst order, Higuchi, Hixson-Crowell and Weibull were applied to data in order to select the best it by linear regression.The regression parameters were estimated and the models were evaluated with the results of residuals and coeficient of determination. The residuals obtained from dissolution kinetics models were random, uncorrelated, and normally distributed with constant variance. The R2values (74.7% for MMF and 95.8% for MPS) demonstrated good ability of
the Weibull regression to explain the variability and to predict the drugs’ release.
Uniterms: Mycophenolate sodium. Mycophenolate mofetil. Dissolution proiles. Weibull kinetics.
Micofenolato de mofetila (MMF) e micofenolato sódico (MPS) são, respectivamente, éster e sal sódico do ácido micofenólico. Os fármacos possuem características farmacocinéticas distintas em função das diferenças na estrutura molecular, nas propriedades físico-químicas e nas formulações administradas. Neste trabalho, os peris de dissolução dos medicamentos referências foram testados em diferentes meios de dissolução com o objetivo de avaliar o efeito da variação de pH, a cinética de dissolução e o modelo estatístico mais adequado para prever a dissolução dos fármacos. A liberação dos fármacos foi determinada com método validado por espectroscopia no ultravioleta, λ 250 nm. O método mostrou-se seletivo, linear, preciso e exato para dissolução de MMF em 0,1 M HCl e MPS em tampão fosfato pH 6,8. Os modelos cinéticos de dissolução de ordem zero, primeira ordem, Higuchi, Hixson-Crowell e Weibull foram aplicados com o objetivo de selecionar aquele com o melhor ajuste por regressão linear. Os parâmetros de regressão foram estimados e os ajustes dos modelos foram veriicados pelos resíduos e coeicientes de determinação. Os resíduos obtidos foram aleatórios, independentes, apresentaram variância constante e seguiram a distribuição normal. Os valores de R2 (74,7% para MMF e 95,8% para
MPS) indicaram bom ajuste da regressão de Weibull para explicar a variabilidade e estimar a liberação dos fármacos.
Unitermos: Micofenolato sódico. Micofenolato de mofetila. Peril de dissolução. Cinética de Weibull.
INTRODUCTION
Mycophenolic acid (MPA), commonly used in the immunosuppressive therapy of post-transplant patients,
is a speciic, non-competitive and reversible inhibitor of
inosine monophosphate dehydrogenase (Noronha et al.,
2005; Sánchez-Fructuoso, 2005; Staatz, Tett, 2007). It is administered as a pro-drug, the ester mycophenolate mofetil (MMF), or its salt, mycophenolate sodium (MPS) (Figure 1).
Following oral administration, MMF undergoes
metabolism to MPA. The active metabolite reaches
maximum plasma concentration after 1 h and a secondary increase in plasma is observed at approximately 6-12
h post dose (Staatz, Tett, 2007; Lee et al., 1990; Jeong, Kaplan, 2007).
Enteric-coated mycophenolate sodium (EC-MPS) was developed to reduce the incidence and severity of gastric side effects of mycophenolate mofetil immediate release tablets (MMF-IR) used in immunosuppressive therapy. The goal of this formulation development was delaying release and absorption of MPA to reduce the incidence of gastrointestinal effects (Arns, 2007; Budde et al., 2004; Sábada et al., 2005). After oral administration of EC-MPS the absolute bioavailability is greater than 71% and peak plasma concentration is reached within 1.5 to 2 h (Sánchez-Fructuoso, 2005; Zolezzi, 2005).
Several analytical methods for MPA have been established to support pharmacokinetics studies of EC-MPS compared with MMF-IR in human and animal models
(Tsina et al., 1996; Barkosi, 2005; Wiwattanawongsa,
2001). The drugs demonstrated similar eficacy and safety
profile, indicating that patients receiving MMF-IR as maintenance therapy can be safely interchanged to EC-MPS. However, there is no consensus on reducing the adverse effects (Sánchez-Fructuoso, 2005; Arns, 2007; Budde et al., 2004; Sábada et al., 2005; Zolezzi, 2005).
Despite similar safety and eficacy, the tablets may
present different drug releases after oral administration. The objectives of this work were evaluated dissolution profiles of MMF-IR and EC-MPS in different media to determine the pH effect on drug release and applied statistical models to describe the dissolution kinetics.
MATERIAL AND METHODS
Reagents and chemicals
MPA from Sigma-Aldrich® (St. Louis, MO, USA,
batch 097K4005) and MMF reference standard from European Pharmacopoeia, batch 2.0, were obtained. The
reference tablets CellCept® 500 mg (MMF-IR, Roche)
and Myfortic® 360 mg (EC-MPS, Novartis) were used.
The analytical reagents concentrated hydrochloric acid, methanol, sodium monobasic phosphate and sodium tribasic phosphate were purchased (J.T. Baker®, Phillipsburg, NJ, USA). High purity water was used (Milli-Q, Millipore®, Bedford, MA, USA).
Instrumentation and analytical conditions
The dissolution profiles were performed in a
dissolution system (Erweka® DT80) in accordance to
speciications of The United States Pharmacopeia (USP
34, 2011). The drug release percentage was determined in a UV-Vis spectrophotometer (HP8453, Agilent, Palo Alto, CA, USA) at λ 250 nm, in adequate diluents.
Dissolution profiles
Immediate release profile of MMF was carried
out using six units in each medium: 0.1 M HCl, 0.01 M
HCl and 0.1 M sodium phosphate buffer (PBS) pH 3.0 maintained at 37±0.5 °C. Paddle apparatus were used at
50 rpm and dissolution points were deined at 5, 10, 15, 30, 45 and 60 min. The samples were iltered through a 0.45 µm membrane and exactly diluted to approximately
25 µg/mL. The amount of MMF dissolved was determined against MMF standard solution in dissolution medium at same concentration.
Dissolution profiles for EC-MPS tablets were obtained according to USP general method <711> for dissolution of enteric-coated tablets. The dissolution started with 750 mL 0.1 M HCl at 37±0.5 °C and paddle apparatus at 50 rpm. After 120 min, an aliquot was collected and 250 mL of 0.20 M sodium phosphate buffer tribasic, 37±0.5 °C, were added. The pH of each vessel was rapidly adjusted to 6.8±0.05. The amount of MPS dissolved
was determined after 10, 20, 30, 45, 60, 90 e 120 min in buffer medium. A stock solution of MPA standard
was prepared in methanol at 450 μg/mL and diluted in
dissolution media to final concentration of 18 μg/mL. The same procedure was performed to obtain dissolution
proiles at adjusted pH values of 6.0±0.05 and 5.5±0.05.
Statistical comparison was performed by Duncan test at 95% of confidence for the selection of an ideal
medium and, dissolution test speciications were proposed
for each drug. The difference of average drug release at each time point was considered significantly if it was larger than the critical value. Similarity factor (f2) was also determined to compare the curves of dissolution. In Equation 1 for f2 factor, n is the number of dissolution points, Rt and Tt are the reference and test dissolution
values at time t. Values of f2 between 50 and 100 ensure
the sameness of two dissolution proiles (USA, 1997).
Eq. 1
Dissolution kinetics
Mathematical models are often used to describe dissolution profiles and to compare drug release by dependent method. The evaluation of dissolution kinetics
allows knowing the rate of the process, the maximum concentration dissolved and when signiicant, changes
occur (Patel et al., 2008; Raslan, Maswadeh, 2006;
Demirturk, Oner, 2005; Serra, Storpirtis, 2007).
The release kinetics of MMF-IR tablets in 0.1 M HCl and EC-MPS in PBS pH 6.8 were analyzed by linear regression using different mathematical models (see Table I). The general function of a simple linear regression is described by Equation 2, where β0 is the intercept, β1 is the slope and ε the random error (residual) with zero mean and variance σ2.
f(xi) = β0 + β1 xi + εi Eq. 2
Regression parameters (β0 and β1) were estimated by
least squares method and the best it model was selected
for each drug based on the results of the coefficient of determination (R2) and residual analyses. The observations
at 5, 10, 15 and 30 min were used for MMF-IR. The kinetics studied for EC-MPS were assessed in the time interval 10-45 min in the buffered stage.
Pharmaceutical dosage forms that follow zero order kinetics, release the same amount of drug per unit
of time. In the irst order kinetics, the plot of dissolution
time versus natural logarithm of the percentage dissolved drug was evaluated. Drug release occurs proportionally to the drug amount remaining inside the dosage form, so that the amount of drug released per unit time decreases (Manadas et al., 2002).
Higuchi developed several theoretical models to study the release of soluble and poorly soluble drugs incorporated in solid and semi-solid matrices. The
simplified Higuchi model is based on Fick’s law of
diffusion and the square root of time is described versus drug release (Manadas et al., 2002). The equation of the
Hixson-Crowell model considers the principle that the area
of a particle is proportional to the cube root of its volume. This model assumes that the release rate is limited by the dissolution of the particles of the drug and not by diffusion
in the matrix tablet.
The general empirical equation described by Weibull
(Equation 3) was applied to the drug release processes and provides satisfactory results for almost all types of dissolution curves.
log[–ln(1 – m)] = βlog(t – Ti) – log Eq. 3
In Weibull model, the statistical parameter α deines
the time scale of the process estimated from X value (t=1), Tirepresents the time interval before dissolution starts (Ti=0)
and β is the shape parameter that characterizes the curve as exponential (β=1), sigmoid (β>1) or parabolic (β<1).
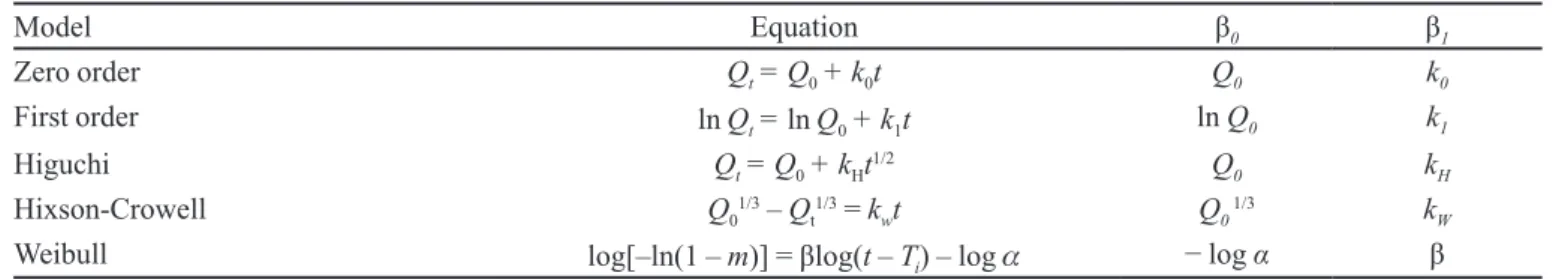
TABLE I - Regression models applied to dissolution proiles of MMF-IR and EC-MPS tablets
Model Equation β0 β1
Zero order Qt = Q0 + k0t Q0 k0
First order lnQt = lnQ0 + k1t ln Q0 k1
Higuchi Qt = Q0 + kHt
1/2 Q
0 kH
Hixson-Crowell Q01/3 – Qt1/3 = kwt Q0 1/3 kW
Weibull log[–ln(1 – m)] = βlog(t – Ti) – log − log α β
The Weibull linear relationship was obtained by log-log
plot of time versus -ln (1-m), where m is the cumulative fraction of drug dissolved over a time t (Manadas et al., 2002; Yukse et al., 2000).
Method validation
Spectrophotometric method was validated regarding
merit igures speciicity, linearity, accuracy, precision,
detection (LOD) and quantitation limits (LOQ) for MMF-IR in 0.1 M HCl and, for EC-MPS in PBS pH 6.8, according to ICH guidelines (ICH, 2005). EC-MPS
determination was expressed in the equivalent amount of
MPA.
Placebo enriched by standard solutions was used to evaluate selectivity over the range 200-400 nm. MMF-IR placebo formulation contained microcrystalline cellulose, croscarmellose sodium, magnesium stearate,
Povidone K-90, Hypromellose, titanium dioxide, indigo carmine and yellow iron oxide. EC-MPS placebo was
composed by corn starch, Povidone K-90, Crospovidone,
lactose, colloidal silicon dioxide, magnesium stearate, Hypromellose, titanium dioxide, indigotine, yellow iron oxide and red iron oxide.
Linearity was evaluated by thirty determinations across the range 5.0-50.0 μg/mL for MMF and by twenty four determinations across the range 6.0-34.0 μg/mL for MPA. The results were analyzed by visual inspection and a regression model estimated by the least squares method. Detection and quantitation limits were estimated based on the standard deviation of the intercept (sa) and the slope
(b) of the respective analytical curve were used following Equations 4 and 5.
LOD = 3.3 sa / b Eq. 4
LOQ = 10 sa / b Eq. 5
Precision was investigated in the tablets by repeatability (intra-day) and intermediate precision
(inter-day) using six determinations in three different days.
Final test concentrations were 25 µg/mL for MMF and 18 µg/mL for MPA. Intra-day precision was reported as relative standard deviation (RSD) and inter-day precision was evaluated by comparison of the means in different days, by Anova (α=0.05).
In order to evaluate accuracy, three placebo samples were added of different standard concentrations of MMF (17.5, 25.0, 32.5 µg/mL) and of MPA (12.6, 18.0,
23.4 µg/mL). Recovery was expressed by the ratio of experimental to nominal drug percentage concentrations.
RESULTS
Dissolution profiles
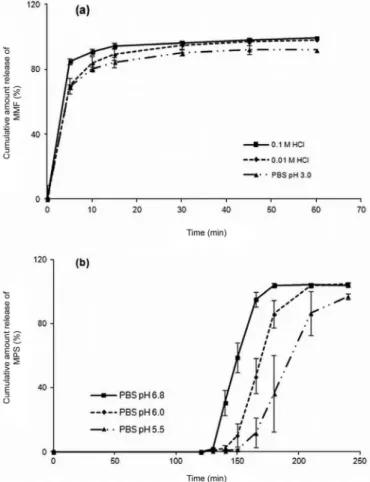
The MMF-IR dissolution proiles shown in Figure 2a
were statistically different at all sampling times (p<0.05). It was observed that the amount of MMF released in
PBS pH 3.0 was signiicantly different to that released in
0.1 M HCl (p<0.05) at all points. The dissolution proile in 0.01 M HCl was not significantly different to that in PBS pH 3.0 at initial points (p>0.05). However, the dissolution curves in media 0.01 M HCl and 0.1 M HCl yield superposed points, starting at 30 min, in the plateau region (see Table II).
The similarity factor was applied to compare the dissolution profile over 0-30 min (critical interval of dissolution). In a similar drug dissolution was observed the curves in 0.1 M HCl vs. 0.01 M HCl (f2= 53.15), as well as for those in 0.01 M HCl vs. PBS pH 3.0 media (f2 = 70.37). However, the curves were considered statistically different
FIGURE 2 - Cumulative amount release for (a) MMF-IR in 0.1 M HCl, 0.01 M HCl and PBS pH 3.0 and for (b) EC-MPS in PBS pH 5.5, 6.0 and 6.8 at 37±0.5 °C, paddles, 50 rpm, using
between the tested media 0.1 M HCl vs. PBS pH 3.0 (f2= 47.75). Despite the difference of drug dissolution found in 0.1 M HCl, 0.01 M HCl and PBS pH 3.0 media, the cumulative amount (94.44%, 89.07% and 84.33%, respectively) was greater than 80% in all media in the time point 15 min.
Figure 2b depicts the EC-MPS tablets dissolution profile. The first stage release was performed during 120 min in 0.1 M HCl with the aim to evaluate the resistance of the enteric coating. In the second stage, the
aim was to characterize the delayed release proile during
120 min in the media PBS pH 5.5, 6.0 and 6.8. The tablets remained visually intact in the acid stage and the amount of drug released was negligible (0.0%). Moreover, there was a greater drug release with the increase of pH. The
dissolution steady state was irst achieved within 60 min in PBS pH 6.8. EC-MPS dissolution proile was signiicantly
different in the media at all sampling times (p<0.05). Duncan test showed that the amounts of MPS dissolved in
PBS pH 6.8 were signiicantly different when compared to those in PBS pH 5.5. The drug dissolution proile in PBS
pH 6.0 was similar to that in PBS pH 5.5 at the two initial
points and closer to that in PBS pH 6.8 at the inal three
dissolution points (Table III).
By using the similarity factor approach over the
irst 45 min for the second stage of the dissolution proile
of EC-MPS tablets, f2values were smaller than 50 and
pointed for no similarity observed between the curves (f2 = 21.71 for pH 6.8 vs. 6.0; f2= 13.93 for pH 6.8 vs. 5.5; f2 = 36.87 for pH 6.0 vs. 5.5). Hence, the pH was critical
for the drug dissolution proile at this stage.
Dissolution kinetics
Dissolution kinetics was studied considered the
dissolution proiles of MMF-IR and EC-MPS in 0.1 M
HCl and PBS pH 6.8, respectively. The mathematical
models for zero order, first order, Higuchi, Hixon-Crowel and Weibull were applied to determine the best
model to represent the dissolution process. Results of R2
(coeficient of determination), intercept (β0) and slope (β1),
normality test for standardized residual and signiicance
of parameters were evaluated for MMF-IR and EC-MPS, according to Tables IV and V.
Method validation
Interference of placebo was not observed over the range 200-400 nm, attesting for the method selectivity. The calibration curves showed linearity over the ranges
5.0-50.0 μg/mL for MMF and 6.0-34.0 μg/mL for MPA
determinations. The regressions were signiicant (p<0.05)
and data showed good curve its. All R2 values were greater
than 99.9%, which is the proportion explained by the
TABLE II - Duncan test (α=0.05) for MMF-IR dissolution proiles in the media 0.1 M HCl, 0.01 M HCl and PBS pH 3.0 using UV
method, λ 250 nm
Dissolution media Time (min)
5 10 15 30 45 60
0.1 M HCl vs. PBS pH 3.0 15.45 10.52 10.11 6.01 5.95 7.24
0.1 M HCl vs. 0.01 M HCl 14.63 7.12 5.37 1.26* 1.10* 1.23*
0.01 M HCl vs. PBS pH 3.0 0.82* 3.40* 4.74 4.75 4.85 6.01
Critical value 7.56 3.91 3.53 3.75 2.37 2.73
*No signiicant difference.
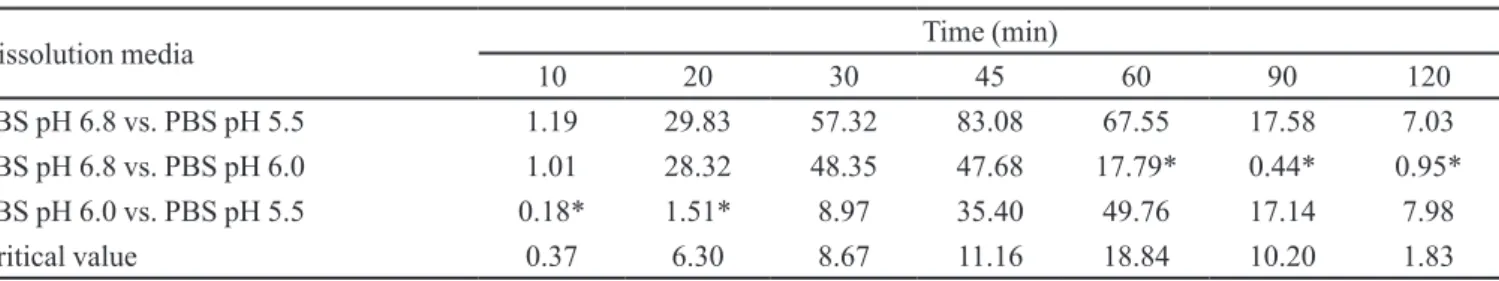
TABLE III - Duncan test (α=0.05) for EC-MPS dissolution proiles in media PBS pH 5.5, 6.0 and 6.8, using UV method, λ 250 nm
Dissolution media Time (min)
10 20 30 45 60 90 120
PBS pH 6.8 vs. PBS pH 5.5 1.19 29.83 57.32 83.08 67.55 17.58 7.03
PBS pH 6.8 vs. PBS pH 6.0 1.01 28.32 48.35 47.68 17.79* 0.44* 0.95*
PBS pH 6.0 vs. PBS pH 5.5 0.18* 1.51* 8.97 35.40 49.76 17.14 7.98
Critical value 0.37 6.30 8.67 11.16 18.84 10.20 1.83
total variance of the response by the regression models (Table VI). The LOD and LOQ limits were calculated from the response standard deviation of the intercept and the slope of the analytic regression line. Estimated LOD value for MMF was 0.32 µg/mL and 0.13 µg/mL for MPA. The estimated LOQ values were 0.97 µg/mL for MMF and 0.45 µg/mL for MPA.
The Table VII shows the precision and accuracy results. Precision was calculated by MMF and MPA determinations in tablets in three days. All RSD values were
lower than 2.0% and there was no signiicant difference
between averages in the three-day analyses (p>0.05).
Accuracy, investigated by standard recovery over three
different concentrations, resulted in experimental values
near the nominal concentrations. Recovery means were 99.28% for MMF and 99.84% for EC-MPS.
DISCUSSION
The dissolution media used was defined based on the best solubility and characteristics of the drug formulations. MMF is formulated as immediate release tablets, nevertheless, the drug is poorly soluble in water. Hence, an increase in hydrogen ion concentration of the
TABLE IV - Results of the regression it models for MMF-IR dissolution proile in selected medium 0.1 M HCl, using UV method, λ 250 nm
Model R2(%) β0 β1 Tests for normality of
residuals (p-value)
Estimated value p-value Estimated value p-value
Zero order 56.2 85.322 < 0.001 0.406 < 0.001 0.452
First order 54.5 4.446 < 0.001 0.005 < 0.001 0.331
Higuchi 64.2 78.780 < 0.001 3.427 < 0.001 0.460
Hixson-Crowell 55.1 0.239 < 0.001 − 0.007 < 0.001 0.369
Weibull 74.7 0.059 0.201 0.321 < 0.001 0.418
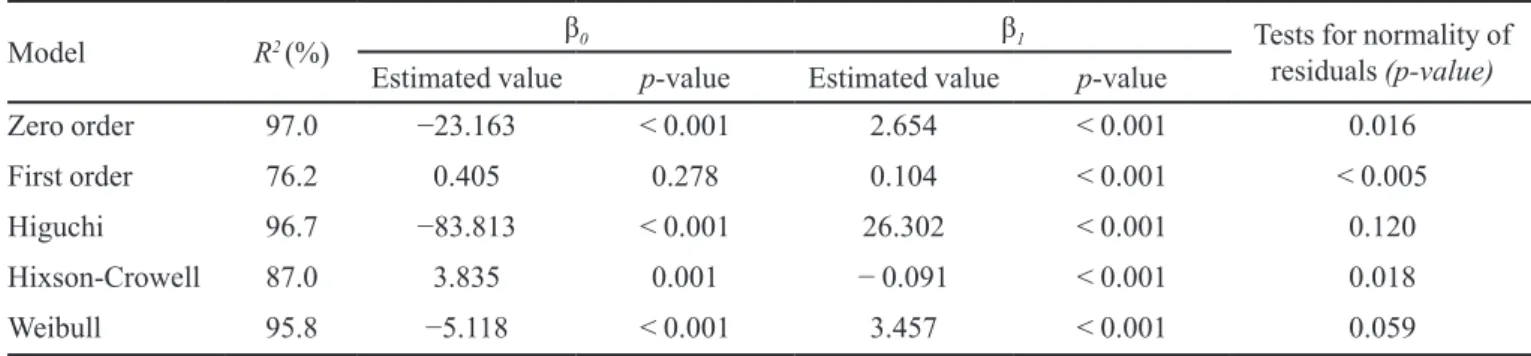
TABLE V - Results of the regression it models for EC-MPS dissolution proile in selected medium PBS pH 6.8, using UV method, λ 250 nm
Model R2 (%) β0 β1 Tests for normality of
residuals (p-value)
Estimated value p-value Estimated value p-value
Zero order 97.0 −23.163 < 0.001 2.654 < 0.001 0.016
First order 76.2 0.405 0.278 0.104 < 0.001 < 0.005
Higuchi 96.7 −83.813 < 0.001 26.302 < 0.001 0.120
Hixson-Crowell 87.0 3.835 0.001 − 0.091 < 0.001 0.018
Weibull 95.8 −5.118 < 0.001 3.457 < 0.001 0.059
TABLE VI - Results of linearity, LOD and LOQ for MMF and MPA in selected media 0.1 M HCl and PBS pH 6.8, respectively,
using UV method, λ 250 nm
Coeficients MMF in 0.1 M HCl MPA in PBS pH 6.8
R2 (%) 99.98 99.99
Slope ± standard deviation 0.0203 ± 0.0001 0.0292 ± 0.0001
Intercept ± standard deviation 0.0030 ± 0.0020 0.0003 ± 0.0013
LOD (µg/mL) 0.32 0.13
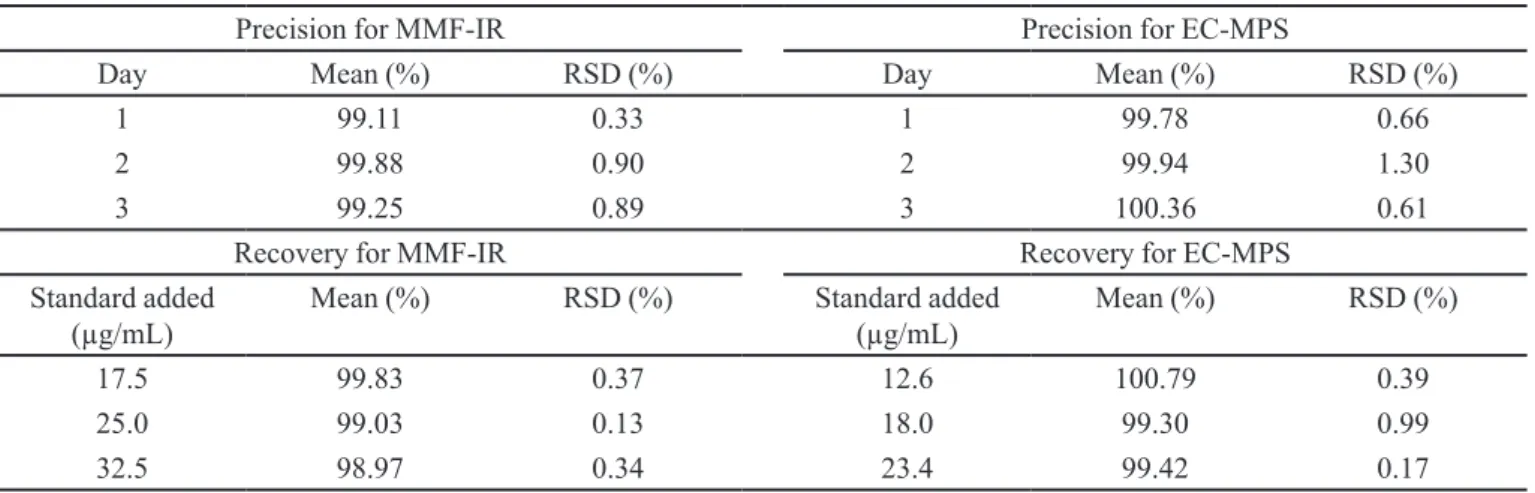
TABLE VII - Precision (n=18) and recovery (n=12)data for MMF-IR and EC-MPS tablets, in selected media 0.1 M HCl and PBS
pH 6.8, respectively, using UV method, λ 250 nm
Precision for MMF-IR Precision for EC-MPS
Day Mean (%) RSD (%) Day Mean (%) RSD (%)
1 99.11 0.33 1 99.78 0.66
2 99.88 0.90 2 99.94 1.30
3 99.25 0.89 3 100.36 0.61
Recovery for MMF-IR Recovery for EC-MPS
Standard added (µg/mL)
Mean (%) RSD (%) Standard added
(µg/mL)
Mean (%) RSD (%)
17.5 99.83 0.37 12.6 100.79 0.39
25.0 99.03 0.13 18.0 99.30 0.99
32.5 98.97 0.34 23.4 99.42 0.17
medium favors its solubility (Lee et al., 1990). Because of this feature, the acidic dissolution media 0.1 M HCl, 0.01 M HCl and 0.1 M PBS pH 3.0 were selected to
determine the dissolution proile of MMF tablets.
The mean release at 15 min in 0.1 M HCl was almost complete (94.44%) for MMF-IR. According to the regulatory agency Food and Drug Administration (USA, 1997), a drug product undergoing 85% dissolution in 15 min under mild dissolution test conditions behaves like a solution. Thus, generally, it should not have any bioavailability problems since the mean gastric emptying time (t50%) is 15 to 20 min under fasting conditions. The use of 0.1 M HCl as the dissolution medium was appropriate for MMF-IR and the acceptance criteria, Q=85%, for a very fast dissolving release (94.44%, in 15 min) can be applied as a quality control.
For EC-MPS, no drug release was detected at the acid stage. The MPS mean dissolution at 45 min of the buffered stage was 95.01% in pH 6.8, 47.33% in pH 6.0 and 11.93% in pH 5.5. The USP general method acceptance criteria for enteric-coated tablets consider the limit of 10% of the amount of drug dissolved in each unit after 120 min in 0.1 M HCl. A minimum of 80% of the dissolved amount for each unit after 45 min of dissolution is recommended at the buffered stage. These criteria are suitable for analysis of EC-MPS dissolution evaluation in PBS pH 6.8.
A regression model is well adjusted when the average of the response variable Y is a linear function of the predictor variable X, the variance of the residuals is constant, the residuals follow the normal distribution with zero mean and are independent. The value of R2 represents
the proportion of the total variability of the variable Y that
is explained by the variable X. This index is widely used to
classify a set of regression because it scales the ability of
the predictor variable in determining the response variable. However, R2should not be used as an isolated parameter
without the validation of the assumptions established for
the residuals in order to it the regression model.
The zero order model was not ideal for evaluating the kinetics release of the drugs. The model did not show
good ability to explain the data variation for MMF-IR
(R2 = 56.2%). The R2value was larger for EC-MPS
(97.0%) but the residuals were not random and did not follow the normal distribution (p<0.05). The irst order model had no advantage over the initial results compared to the zero order model.
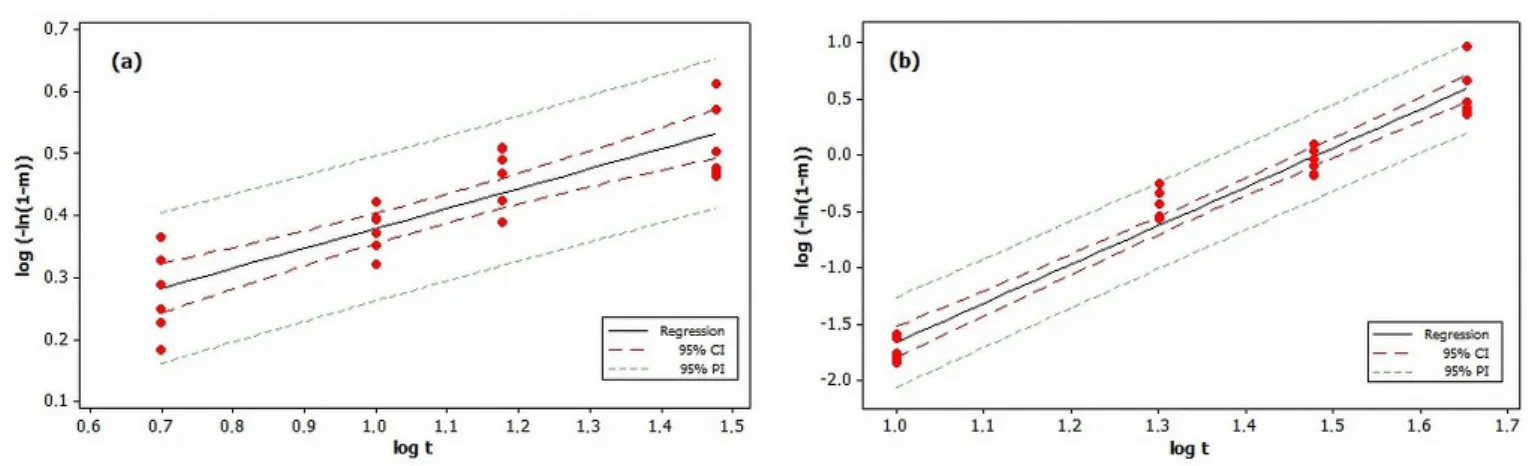
Weibull transformation resulted in a significant
(p<0.001) and valid regression for MMF-IR dissolution
proile (Figure 3a). This model explained 74.7% of total variance of observations. The inal regression model could
be described by the Equation 6, where m is the cumulative fraction of drug dissolved over a time t.
For EC-MPS study, Higuchi transformation resulted
in residuals with best it to normal distribution. Noteworthy, β0parameter was not significantly different from zero
(p>0.05) only in first order model. This result is ideal because the drug release at time zero is null. Despite the
merits of irst order and Higuchi models, the best it was yet obtained with Weibull transformation. The residuals showed
to be random with constant variance (Levene test p=0.700)
only with Weibull model. Data transformation resulted in a
signiicant regression (p<0.001) and the model was able to
explain 95.8% of the total data variation (Figure 3b). The
regression could be described by Equation 7.
log (−ln(1−m)) = 0.05912 + 0.3210 log t Eq. 6
CONCLUSIONS
T h e r e s u l t s o b t a i n e d f o r d e t e r m i n a t i o n o f mycophenolic acid derivatives after tablets dissolution
by using UV spectrophotometry at λ 250 nm showed
to be selective, linear, precise and accurate. The use of 0.1 M HCl as a dissolution medium for MMF-IR was appropriate, considering dissolution acceptance criteria Q=85% of the labeled amount in 15 min. A minimum criterion of 80% of the dissolved amount after 45 min is proposed for EC-MPS in PBS pH 6.8.
Weibull model showed a significant (p<0.001)
and best it to linear regression for dissolution proile of
MMF-IR and EC-MPS tablets. The obtained residuals were random, uncorrelated, and normally distributed with constant variance. The R2values (74.7% for MMF-IR and
95.8% for EC-MPS) demonstrated good ability of the
Weibull regression to explain the variability and to predict
the drug release from the reference dosage forms.
ACKNOWLEDGMENTS
The authors thank the Brazilian Pharmacopoeia for
inancial support.
REFERENCES
ARNS, W. Noninfectious gastrointestinal (GI) complications
of mycophenolic acid therapy: a consequence of local GI
toxicity? Transplant. Proc., v.39, p.88-93, 2007.
BARKOZI, M.A.; ROUINI, M.; GHOLAMI, K.; PEZASHKI, M.L.; REZAEE, S. Determination of mycophenolic acid in human plasma by high-performace liquid chromatography.
Daru, v.3, p.120-126, 2005.
BUDDE, K.; GLANDER, P.; DIEKMANN, F.; DRAGUN.
D.; WAISER, J.; FRITSCHE, L.; NEUMAYER, H.H.
Enteric-coated mycophenolate sodium: safe conversion from mycophenolate mofetila in maintenance renal transplant recipients. Transplant. Proc., v.36, p.524-527, 2004.
DEMIRTÜRK, E.; ÖNER, L. Evaluation of in vitro dissolution
proile comparison methods of immediate release gliclazide
tablets formulation. Hacettepe Univ. J. Pharm., v.25, p.1-10, 2005.
INTERNATIONAL CONFERENCE ON HARMONIZATION.
ICH. Validation of analytical procedures: text and
methodology (Q2 R1). London: ICH, 2005. 17 p.
J E O N G, H; K A P L A N, B . Therapeutic monitoring of mycophenolate mofetil. Clin. J. Am. Soc. Nephrol., v.2, p.184-191, 2007.
LEE, W.A.; GU, L.; MIKSZTAL, A.R.; CHU, N.; LEUNG,
K.; NELSON, P.H. Bioavailability improvement of mycophenolic acid through amino ester derivatization.
Pharm. Res., v.7, p.161-166, 1990.
MANADAS, R.; PINA, M.E.; VEIGA, F. A dissolução in vitro na previsão da absorção oral de fármacos em formas
farmacêuticas de liberação modiicada. Rev. Bras, Cienc. Farm., v.38, p.375-399, 2002.
NORONHA, I.L.; OLIVEIRA, A.C.; ARAÚJO, M.R.T.; ABENSUR, H.; QUINTAES, S.L.; GENZINI, T.; PEDROSA, M.; CAMPAGNARI, M.M.; JÚNIOR, J.E.R. Micofenolato mofetil em transplante de órgãos. J. Bras. Nefrol., v.19, p.398-406, 2005.
PATEL, N.; CHOTAI, N.; PATEL, J.; SONI, T.; DESAL, J.; PATEL, R. Comparison of in vitro dissolution proiles of
oxcarbazepine-HP β-CD tablets formulations with marketed
oxcarbazepine tablets. Dissol. Technol., v.15, p.28-34, 2008.
RASLAN, H.K.; MASWADEH, H. In vitro dissolution kinetic
study of theophylline from mixed controlled release matrix tablets containing hydroxypropylmethyl cellulose and
glycerylbehenate. Ind. J. Pharm. Sci., v.68, p.308-312, 2006.
SÁBADA, B.; AZANZA, J.R.; MUÑOZ, M.J.; GIL, I. Nuevas perspectivas del tratamiento inmunosupresor en el trasplante de órganos. Nefrologia, v.25, p.47-492, 2005.
SÁNC HE Z-FR UC T UOSO, A.I. Revisión de un nuevo inmunosupresor: micofenolato sódico con cubierta entérica (Myfortic®). Nefrologia, v.25, p.23-242, 2005.
SERRA, C.H.H.; STORPIRTIS, S. Comparação de peris de
dissolução da cefalexina através de estudos de cinética e
eiciência de dissolução (ED%). Rev. Bras. Ciênc. Farm.,
v.43, p.79-88, 2007.
STAATZ, C.E.; TETT, S.E. Clinical pharmacokinetics and pharmacodynamics of mycophenolate in solid organ transplant recipients. Clin. Pharm., v.46, p.13-58, 2007.
THE UNITED STATES PHARMACOPEIA. 34ed. Rockville: United States Pharmacopeial Convention, 2011. 4638 p.
TSINA, I.; KALOOSTIAN, M.; LEE, R.; TARNOWSKI,
T.; WONG, B. High performance liquid chromatographic
method for the determination of mycophenolate mofetil in human plasma. J. Chromatogr. B, v.681, p.347-353, 1996.
U N I T E D S TAT E S O F A M E R I C A . F o o d a n d D r u g Administration. Guidance for industry: dissolution testing of immediate release solid oral dosage forms. Silver Spring: Center for Drug Evaluation and Research, 1997. 17 p.
WIWATTANAWONGSA, K.; HEINZEN, E.L.; KEMPP,
D.C.; DUPUIS, R.E.; SMITH, P.C. Determination of mycophenolic acid and its phenol glucuronide metabolite inhuman plasma and high-performance liquid. J. Chromatogr. B, v.763, p.35-45, 2001.
YUKSE, N.; KANIK, A.E.; BAYKARA, T. Comparison of in
vitro dissolution proiles by Anova-based, model-dependent
and –independent methods. Int. J. Pharm., v.209, p.57-67, 2000.
ZOLEZZI, M. Mycophenolate sodium versus mycophenolate mofetil: a review of their comparative features. Saudi. J. Kidney Dis. Transplant., v.16, p.140-145, 2005.
Received for publication on 27th August 2012